Lessons from the Texas Homeowners Insurance Crisis Bob Puelz ...
Lessons from the Texas Homeowners Insurance Crisis Bob Puelz ...
Lessons from the Texas Homeowners Insurance Crisis Bob Puelz ...

Create successful ePaper yourself
Turn your PDF publications into a flip-book with our unique Google optimized e-Paper software.
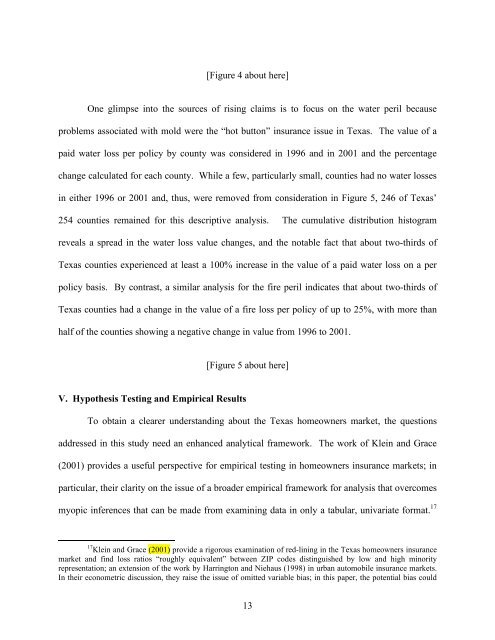
[Figure 4 about here]<br />
One glimpse into <strong>the</strong> sources of rising claims is to focus on <strong>the</strong> water peril because<br />
problems associated with mold were <strong>the</strong> “hot button” insurance issue in <strong>Texas</strong>. The value of a<br />
paid water loss per policy by county was considered in 1996 and in 2001 and <strong>the</strong> percentage<br />
change calculated for each county. While a few, particularly small, counties had no water losses<br />
in ei<strong>the</strong>r 1996 or 2001 and, thus, were removed <strong>from</strong> consideration in Figure 5, 246 of <strong>Texas</strong>’<br />
254 counties remained for this descriptive analysis. The cumulative distribution histogram<br />
reveals a spread in <strong>the</strong> water loss value changes, and <strong>the</strong> notable fact that about two-thirds of<br />
<strong>Texas</strong> counties experienced at least a 100% increase in <strong>the</strong> value of a paid water loss on a per<br />
policy basis. By contrast, a similar analysis for <strong>the</strong> fire peril indicates that about two-thirds of<br />
<strong>Texas</strong> counties had a change in <strong>the</strong> value of a fire loss per policy of up to 25%, with more than<br />
half of <strong>the</strong> counties showing a negative change in value <strong>from</strong> 1996 to 2001.<br />
V. Hypo<strong>the</strong>sis Testing and Empirical Results<br />
[Figure 5 about here]<br />
To obtain a clearer understanding about <strong>the</strong> <strong>Texas</strong> homeowners market, <strong>the</strong> questions<br />
addressed in this study need an enhanced analytical framework. The work of Klein and Grace<br />
(2001) provides a useful perspective for empirical testing in homeowners insurance markets; in<br />
particular, <strong>the</strong>ir clarity on <strong>the</strong> issue of a broader empirical framework for analysis that overcomes<br />
myopic inferences that can be made <strong>from</strong> examining data in only a tabular, univariate format. 17<br />
17 Klein and Grace (2001) provide a rigorous examination of red-lining in <strong>the</strong> <strong>Texas</strong> homeowners insurance<br />
market and find loss ratios “roughly equivalent” between ZIP codes distinguished by low and high minority<br />
representation; an extension of <strong>the</strong> work by Harrington and Niehaus (1998) in urban automobile insurance markets.<br />
In <strong>the</strong>ir econometric discussion, <strong>the</strong>y raise <strong>the</strong> issue of omitted variable bias; in this paper, <strong>the</strong> potential bias could<br />
13