Lessons from the Texas Homeowners Insurance Crisis Bob Puelz ...
Lessons from the Texas Homeowners Insurance Crisis Bob Puelz ...
Lessons from the Texas Homeowners Insurance Crisis Bob Puelz ...
Create successful ePaper yourself
Turn your PDF publications into a flip-book with our unique Google optimized e-Paper software.
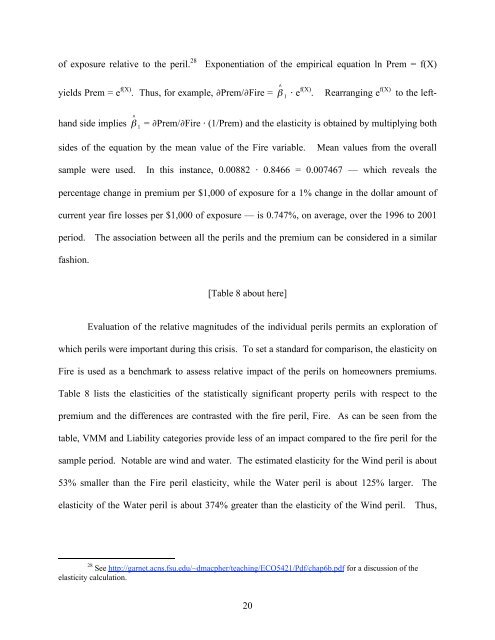
of exposure relative to <strong>the</strong> peril. 28 Exponentiation of <strong>the</strong> empirical equation ln Prem = f(X)<br />
yields Prem = e f(X) !<br />
. Thus, for example, ∂Prem/∂Fire = " 1 ⋅ e f(X) . Rearranging e f(X) to <strong>the</strong> left-<br />
!<br />
hand side implies " 1 = ∂Prem/∂Fire ⋅ (1/Prem) and <strong>the</strong> elasticity is obtained by multiplying both<br />
sides of <strong>the</strong> equation by <strong>the</strong> mean value of <strong>the</strong> Fire variable. Mean values <strong>from</strong> <strong>the</strong> overall<br />
sample were used. In this instance, 0.00882 ⋅ 0.8466 = 0.007467 — which reveals <strong>the</strong><br />
percentage change in premium per $1,000 of exposure for a 1% change in <strong>the</strong> dollar amount of<br />
current year fire losses per $1,000 of exposure — is 0.747%, on average, over <strong>the</strong> 1996 to 2001<br />
period. The association between all <strong>the</strong> perils and <strong>the</strong> premium can be considered in a similar<br />
fashion.<br />
[Table 8 about here]<br />
Evaluation of <strong>the</strong> relative magnitudes of <strong>the</strong> individual perils permits an exploration of<br />
which perils were important during this crisis. To set a standard for comparison, <strong>the</strong> elasticity on<br />
Fire is used as a benchmark to assess relative impact of <strong>the</strong> perils on homeowners premiums.<br />
Table 8 lists <strong>the</strong> elasticities of <strong>the</strong> statistically significant property perils with respect to <strong>the</strong><br />
premium and <strong>the</strong> differences are contrasted with <strong>the</strong> fire peril, Fire. As can be seen <strong>from</strong> <strong>the</strong><br />
table, VMM and Liability categories provide less of an impact compared to <strong>the</strong> fire peril for <strong>the</strong><br />
sample period. Notable are wind and water. The estimated elasticity for <strong>the</strong> Wind peril is about<br />
53% smaller than <strong>the</strong> Fire peril elasticity, while <strong>the</strong> Water peril is about 125% larger. The<br />
elasticity of <strong>the</strong> Water peril is about 374% greater than <strong>the</strong> elasticity of <strong>the</strong> Wind peril. Thus,<br />
28 See http://garnet.acns.fsu.edu/~dmacpher/teaching/ECO5421/Pdf/chap6b.pdf for a discussion of <strong>the</strong><br />
elasticity calculation.<br />
20


