Lessons from the Texas Homeowners Insurance Crisis Bob Puelz ...
Lessons from the Texas Homeowners Insurance Crisis Bob Puelz ...
Lessons from the Texas Homeowners Insurance Crisis Bob Puelz ...

Create successful ePaper yourself
Turn your PDF publications into a flip-book with our unique Google optimized e-Paper software.
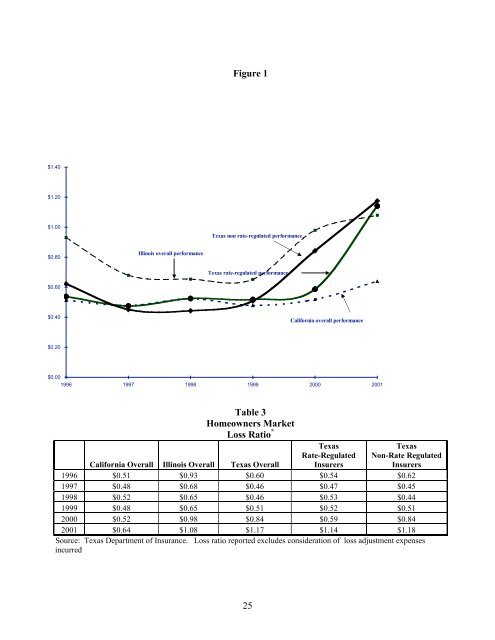
$1.40<br />
$1.20<br />
$1.00<br />
$0.80<br />
$0.60<br />
$0.40<br />
$0.20<br />
California Overall<br />
Illinois overall performance<br />
Figure 1<br />
<strong>Texas</strong> non rate-regulated performance<br />
<strong>Texas</strong> rate-regulated performance<br />
$0.00<br />
1996 1997 1998 1999 2000 2001<br />
Table 3<br />
<strong>Homeowners</strong> Market<br />
Loss Ratio *<br />
Illinois Overall <strong>Texas</strong> Overall<br />
25<br />
California overall performance<br />
<strong>Texas</strong><br />
Rate-Regulated<br />
Insurers<br />
<strong>Texas</strong><br />
Non-Rate Regulated<br />
Insurers<br />
1996 $0.51 $0.93 $0.60 $0.54 $0.62<br />
1997 $0.48 $0.68 $0.46 $0.47 $0.45<br />
1998 $0.52 $0.65 $0.46 $0.53 $0.44<br />
1999 $0.48 $0.65 $0.51 $0.52 $0.51<br />
2000 $0.52 $0.98 $0.84 $0.59 $0.84<br />
2001 $0.64 $1.08 $1.17 $1.14 $1.18<br />
Source: <strong>Texas</strong> Department of <strong>Insurance</strong>. Loss ratio reported excludes consideration of loss adjustment expenses<br />
incurred