booklet format - inaf iasf bologna
booklet format - inaf iasf bologna
booklet format - inaf iasf bologna

Create successful ePaper yourself
Turn your PDF publications into a flip-book with our unique Google optimized e-Paper software.
A.A. 2011/2012<br />
Temporal Data Analysis<br />
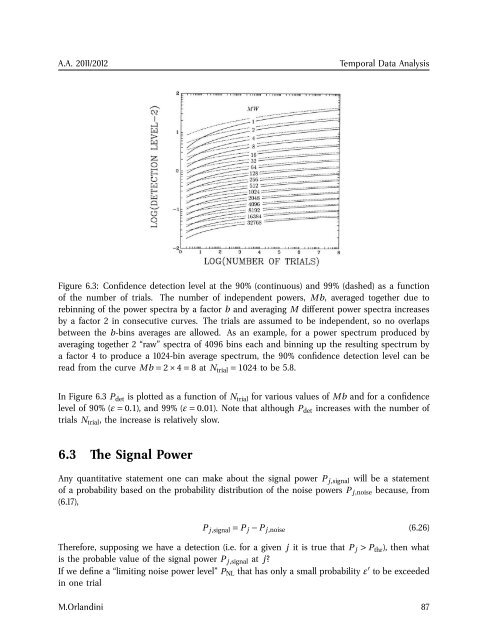
Figure 6.3: Confidence detection level at the 90% (continuous) and 99% (dashed) as a function<br />
of the number of trials. The number of independent powers, Mb, averaged together due to<br />
rebinning of the power spectra by a factor b and averaging M different power spectra increases<br />
by a factor 2 in consecutive curves. The trials are assumed to be independent, so no overlaps<br />
between the b-bins averages are allowed. As an example, for a power spectrum produced by<br />
averaging together 2 “raw” spectra of 4096 bins each and binning up the resulting spectrum by<br />
a factor 4 to produce a 1024-bin average spectrum, the 90% confidence detection level can be<br />
read from the curve Mb = 2 × 4 = 8 at N trial = 1024 to be 5.8.<br />
In Figure 6.3 P det is plotted as a function of N trial for various values of Mb and for a confidence<br />
level of 90% (ε = 0.1), and 99% (ε = 0.01). Note that although P det increases with the number of<br />
trials N trial , the increase is relatively slow.<br />
6.3 The Signal Power<br />
Any quantitative statement one can make about the signal power P j,signal will be a statement<br />
of a probability based on the probability distribution of the noise powers P j,noise because, from<br />
(6.17),<br />
P j,signal = P j − P j,noise (6.26)<br />
Therefore, supposing we have a detection (i.e. for a given j it is true that P j > P thr ), then what<br />
is the probable value of the signal power P j,signal at j?<br />
If we define a “limiting noise power level” P NL that has only a small probability ε ′ to be exceeded<br />
in one trial<br />
M.Orlandini 87