

The Case for Emerging Market Corporates - IndexUniverse.com
The Case for Emerging Market Corporates - IndexUniverse.com
The Case for Emerging Market Corporates - IndexUniverse.com

Create successful ePaper yourself
Turn your PDF publications into a flip-book with our unique Google optimized e-Paper software.
With recent events in Egypt leading to suspension<br />
of that country’s investment market activity and<br />
the closure of its stock exchange on Jan. 27, 1 the<br />
question of the risks inherent in emerging market investing<br />
is on many investors’ minds. While we do not believe recent<br />
events warrant a flight of capital from emerging markets,<br />
we do believe that the situation represents an opportunity<br />
<strong>for</strong> investors to consider the best way to access emerging<br />
market stocks. We delve into the risks of shifting an emerging<br />
market allocation away from broad, diversified coverage<br />
to a more concentrated focus. We conclude that diversifying<br />
across emerging market countries helps to minimize idiosyncratic<br />
or un<strong>com</strong>pensated risks and is analogous to diversifying<br />
across individual <strong>com</strong>panies in developed markets.<br />
Why Focus On Countries?<br />
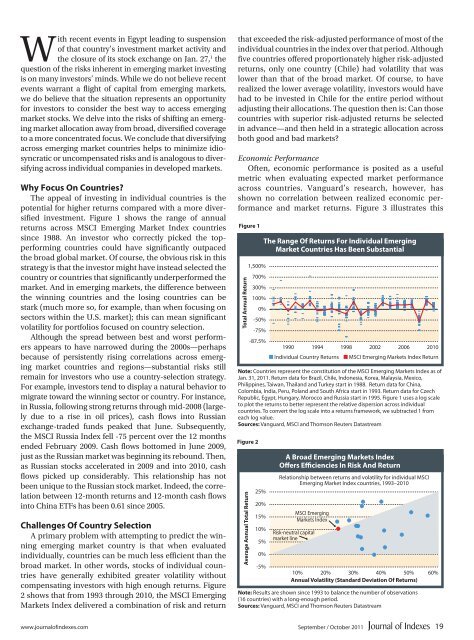
<strong>The</strong> appeal of investing in individual countries is the<br />
potential <strong>for</strong> higher returns <strong>com</strong>pared with a more diversified<br />
investment. Figure 1 shows the range of annual<br />
returns across MSCI <strong>Emerging</strong> <strong>Market</strong> Index countries<br />
since 1988. An investor who correctly picked the topper<strong>for</strong>ming<br />
countries could have significantly outpaced<br />
the broad global market. Of course, the obvious risk in this<br />
strategy is that the investor might have instead selected the<br />
country or countries that significantly underper<strong>for</strong>med the<br />
market. And in emerging markets, the difference between<br />
the winning countries and the losing countries can be<br />
stark (much more so, <strong>for</strong> example, than when focusing on<br />
sectors within the U.S. market); this can mean significant<br />
volatility <strong>for</strong> portfolios focused on country selection.<br />
Although the spread between best and worst per<strong>for</strong>mers<br />
appears to have narrowed during the 2000s—perhaps<br />
because of persistently rising correlations across emerging<br />
market countries and regions—substantial risks still<br />
remain <strong>for</strong> investors who use a country-selection strategy.<br />
For example, investors tend to display a natural behavior to<br />
migrate toward the winning sector or country. For instance,<br />
in Russia, following strong returns through mid-2008 (largely<br />
due to a rise in oil prices), cash flows into Russian<br />
exchange-traded funds peaked that June. Subsequently,<br />
the MSCI Russia Index fell -75 percent over the 12 months<br />
ended February 2009. Cash flows bottomed in June 2009,<br />
just as the Russian market was beginning its rebound. <strong>The</strong>n,<br />
as Russian stocks accelerated in 2009 and into 2010, cash<br />
flows picked up considerably. This relationship has not<br />
been unique to the Russian stock market. Indeed, the correlation<br />
between 12-month returns and 12-month cash flows<br />
into China ETFs has been 0.61 since 2005.<br />
Challenges Of Country Selection<br />
A primary problem with attempting to predict the winning<br />
emerging market country is that when evaluated<br />
individually, countries can be much less efficient than the<br />
broad market. In other words, stocks of individual countries<br />
have generally exhibited greater volatility without<br />
<strong>com</strong>pensating investors with high enough returns. Figure<br />
2 shows that from 1993 through 2010, the MSCI <strong>Emerging</strong><br />
<strong>Market</strong>s Index delivered a <strong>com</strong>bination of risk and return<br />
that exceeded the risk-adjusted per<strong>for</strong>mance of most of the<br />
individual countries in the index over that period. Although<br />
five countries offered proportionately higher risk-adjusted<br />
returns, only one country (Chile) had volatility that was<br />
lower than that of the broad market. Of course, to have<br />
realized the lower average volatility, investors would have<br />
had to be invested in Chile <strong>for</strong> the entire period without<br />
adjusting their allocations. <strong>The</strong> question then is: Can those<br />
countries with superior risk-adjusted returns be selected<br />
in advance—and then held in a strategic allocation across<br />
both good and bad markets?<br />
Economic Per<strong>for</strong>mance<br />
Often, economic per<strong>for</strong>mance is posited as a useful<br />
metric when evaluating expected market per<strong>for</strong>mance<br />
across countries. Vanguard’s research, however, has<br />
shown no correlation between realized economic per<strong>for</strong>mance<br />
and market returns. Figure 3 illustrates this<br />
Figure 1<br />
Total Annual Return<br />
1,500%<br />
700%<br />
300%<br />
100%<br />
0%<br />
-50%<br />
-75%<br />
-87.5%<br />
<strong>The</strong> Range Of Returns For Individual <strong>Emerging</strong><br />
<strong>Market</strong> Countries Has Been Substantial<br />
1990 1994 1998 2002 2006 2010<br />
N Individual Country Returns N MSCI <strong>Emerging</strong> <strong>Market</strong>s Index Return<br />
Note: Countries represent the constitution of the MSCI <strong>Emerging</strong> <strong>Market</strong>s Index as of<br />
Jan. 31, 2011. Return data <strong>for</strong> Brazil, Chile, Indonesia, Korea, Malaysia, Mexico,<br />
Philippines, Taiwan, Thailand and Turkey start in 1988. Return data <strong>for</strong> China,<br />
Colombia, India, Peru, Poland and South Africa start in 1993. Return data <strong>for</strong> Czech<br />
Republic, Egypt, Hungary, Morocco and Russia start in 1995. Figure 1 uses a log scale<br />
to plot the returns to better represent the relative dispersion across individual<br />
countries. To convert the log scale into a returns framework, we subtracted 1 from<br />
each log value.<br />
Sources: Vanguard, MSCI and Thomson Reuters Datastream<br />
Figure 2<br />
Average Annual Total Return<br />
25%<br />
20%<br />
15%<br />
10%<br />
5%<br />
0%<br />
-5%<br />
A Broad <strong>Emerging</strong> <strong>Market</strong>s Index<br />
Offers Efficiencies In Risk And Return<br />
Relationship between returns and volatility <strong>for</strong> individual MSCI<br />
<strong>Emerging</strong> <strong>Market</strong> Index countries, 1993–2010<br />
MSCI <strong>Emerging</strong><br />
<strong>Market</strong>s Index<br />
Risk-neutral capital<br />
market line<br />
10% 20% 30% 40% 50% 60%<br />
Annual Volatility (Standard Deviation Of Returns)<br />
Note: Results are shown since 1993 to balance the number of observations<br />
(16 countries) with a long-enough period.<br />
Sources: Vanguard, MSCI and Thomson Reuters Datastream<br />
www.journalofindexes.<strong>com</strong><br />
September / October 2011<br />
19


