

The Case for Emerging Market Corporates - IndexUniverse.com
The Case for Emerging Market Corporates - IndexUniverse.com
The Case for Emerging Market Corporates - IndexUniverse.com

You also want an ePaper? Increase the reach of your titles
YUMPU automatically turns print PDFs into web optimized ePapers that Google loves.
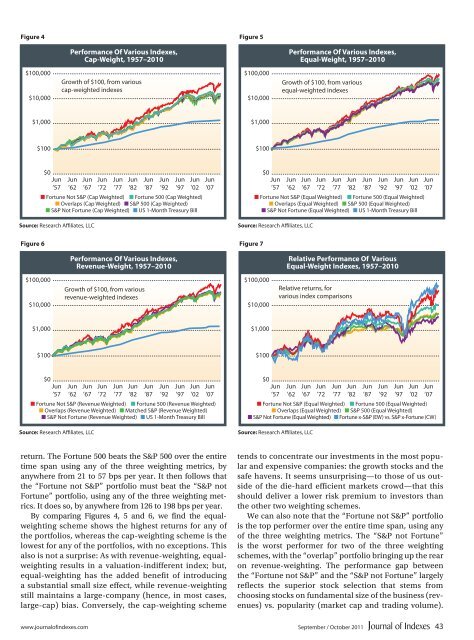
Figure 4<br />
Figure 5<br />
Per<strong>for</strong>mance Of Various Indexes,<br />
Cap-Weight, 1957–2010<br />
Per<strong>for</strong>mance Of Various Indexes,<br />
Equal-Weight, 1957–2010<br />
$100,000<br />
$10,000<br />
Growth of $100, from various<br />
cap-weighted indexes<br />
$100,000<br />
$10,000<br />
Growth of $100, from various<br />
equal-weighted indexes<br />
$1,000<br />
$1,000<br />
$100<br />
$100<br />
Source: Research Affiliates, LLC<br />
Figure 6<br />
$0<br />
Jun<br />
’57<br />
Jun<br />
’62<br />
Jun<br />
’67<br />
Jun<br />
’72<br />
Jun<br />
’77<br />
Jun<br />
’82<br />
Jun<br />
’87<br />
Jun<br />
’92<br />
Jun<br />
’97<br />
Jun<br />
’02<br />
N Fortune Not S&P (Cap Weighted) N Fortune 500 (Cap Weighted)<br />
N Overlaps (Cap Weighted) N S&P 500 (Cap Weighted)<br />
N S&P Not Fortune (Cap Weighted) N US 1-Month Treasury Bill<br />
Per<strong>for</strong>mance Of Various Indexes,<br />
Revenue-Weight, 1957–2010<br />
Jun<br />
’07<br />
Figure 7<br />
$0<br />
Jun<br />
’57<br />
Jun<br />
’62<br />
Jun<br />
’67<br />
Source: Research Affiliates, LLC<br />
Jun<br />
’72<br />
Jun<br />
’77<br />
Jun<br />
’82<br />
Jun<br />
’87<br />
Jun<br />
’92<br />
Jun<br />
’97<br />
Jun<br />
’02<br />
N Fortune Not S&P (Equal Weighted) N Fortune 500 (Equal Weighted)<br />
N Overlaps (Equal Weighted) N S&P 500 (Equal Weighted)<br />
N S&P Not Fortune (Equal Weighted) N US 1-Month Treasury Bill<br />
Relative Per<strong>for</strong>mance Of Various<br />
Equal-Weight Indexes, 1957–2010<br />
Jun<br />
’07<br />
$100,000<br />
$10,000<br />
Growth of $100, from various<br />
revenue-weighted indexes<br />
$100,000<br />
$10,000<br />
Relative returns, <strong>for</strong><br />
various index <strong>com</strong>parisons<br />
$1,000<br />
$1,000<br />
$100<br />
$100<br />
$0<br />
Jun<br />
’57<br />
Jun<br />
’62<br />
Jun<br />
’67<br />
Source: Research Affiliates, LLC<br />
Jun<br />
’72<br />
Jun<br />
’77<br />
Jun<br />
’82<br />
Jun<br />
’87<br />
Jun<br />
’92<br />
Jun<br />
’97<br />
Jun<br />
’02<br />
Jun<br />
’07<br />
N Fortune Not S&P (Revenue Weighted) N Fortune 500 (Revenue Weighted)<br />
N Overlaps (Revenue Weighted) N Matched S&P (Revenue Weighted)<br />
N S&P Not Fortune (Revenue Weighted) N US 1-Month Treasury Bill<br />
$0<br />
Jun<br />
’57<br />
Jun<br />
’62<br />
Jun<br />
’67<br />
Source: Research Affiliates, LLC<br />
Jun<br />
’72<br />
Jun<br />
’77<br />
Jun<br />
’82<br />
Jun<br />
’87<br />
Jun<br />
’92<br />
Jun<br />
’97<br />
Jun<br />
’02<br />
Jun<br />
’07<br />
N Fortune Not S&P (Equal Weighted) N Fortune 500 (Equal Weighted)<br />
N Overlaps (Equal Weighted) N S&P 500 (Equal Weighted)<br />
N S&P Not Fortune (Equal Weighted) N Fortune x-S&P (EW) vs. S&P x-Fortune (CW)<br />
return. <strong>The</strong> Fortune 500 beats the S&P 500 over the entire<br />
time span using any of the three weighting metrics, by<br />
anywhere from 21 to 57 bps per year. It then follows that<br />
the “Fortune not S&P” portfolio must beat the “S&P not<br />
Fortune” portfolio, using any of the three weighting metrics.<br />
It does so, by anywhere from 126 to 198 bps per year.<br />
By <strong>com</strong>paring Figures 4, 5 and 6, we find the equalweighting<br />
scheme shows the highest returns <strong>for</strong> any of<br />
the portfolios, whereas the cap-weighting scheme is the<br />
lowest <strong>for</strong> any of the portfolios, with no exceptions. This<br />
also is not a surprise: As with revenue-weighting, equalweighting<br />
results in a valuation-indifferent index; but,<br />
equal-weighting has the added benefit of introducing<br />
a substantial small size effect, while revenue-weighting<br />
still maintains a large-<strong>com</strong>pany (hence, in most cases,<br />
large-cap) bias. Conversely, the cap-weighting scheme<br />
tends to concentrate our investments in the most popular<br />
and expensive <strong>com</strong>panies: the growth stocks and the<br />
safe havens. It seems unsurprising—to those of us outside<br />
of the die-hard efficient markets crowd—that this<br />
should deliver a lower risk premium to investors than<br />
the other two weighting schemes.<br />
We can also note that the “Fortune not S&P” portfolio<br />
is the top per<strong>for</strong>mer over the entire time span, using any<br />
of the three weighting metrics. <strong>The</strong> “S&P not Fortune”<br />
is the worst per<strong>for</strong>mer <strong>for</strong> two of the three weighting<br />
schemes, with the “overlap” portfolio bringing up the rear<br />
on revenue-weighting. <strong>The</strong> per<strong>for</strong>mance gap between<br />
the “Fortune not S&P” and the “S&P not Fortune” largely<br />
reflects the superior stock selection that stems from<br />
choosing stocks on fundamental size of the business (revenues)<br />
vs. popularity (market cap and trading volume).<br />
www.journalofindexes.<strong>com</strong> September / October 2011 43


