- Page 1 and 2:
1. INTRODUCTION POSCO intends to se
- Page 3 and 4:
FIGURE 1.1 LOCATION OF THE PORT 3
- Page 5 and 6:
FIGURE 1.3 SATELLITE IMAGERY OF THE
- Page 7 and 8:
the water depth of 9 m due to non-a
- Page 9 and 10:
The present DGPS system operates wi
- Page 11 and 12:
(Model 232-A), Trigger capacitor ba
- Page 13 and 14:
_______________ Spectral width para
- Page 15 and 16:
1.3.3. Water quality Parameters Thr
- Page 17 and 18:
1.3.3.4 Salinity The halogen compou
- Page 19 and 20:
degradation with possible contribut
- Page 21 and 22:
each station the net was towed for
- Page 23 and 24:
2. PROJECT DESCRIPTION POSCO, Korea
- Page 25 and 26:
FIGURE 2.1. LAYOUT OF THE HARBOUR F
- Page 27 and 28:
tranquil condition inside the port
- Page 29 and 30:
FIGURE 2.2. SAND MOUND TYPE REVETME
- Page 31 and 32:
Containment Dikes: The containment
- Page 33 and 34:
3 BASELINE STUDIES Baseline data on
- Page 35 and 36:
erosional activity has been observe
- Page 37 and 38:
FIGURE 3.1 MAP SHOWING THE BATHYMET
- Page 39 and 40:
FIGURE 3.3 a TYPICAL SESIMIC SECTIO
- Page 41 and 42:
FIGURE 3.4 a TYPICAL INTERPRETED SE
- Page 43 and 44:
Line-40/1: (central line close to L
- Page 45 and 46:
3.1.6 Side Scan Sonar The Side Scan
- Page 47 and 48:
3.2 ENVIRONMENTAL CONDITIONS The st
- Page 49 and 50:
Bengal and in the vicinity of Parad
- Page 51 and 52:
3.2.5 Visibility The monthly averag
- Page 53 and 54:
FIGURE 3.7 TRACK OF CYCLONE PASSED
- Page 55 and 56:
3.5 3 2.5 Tide (m) 2 1.5 1 0.5 13 1
- Page 57 and 58:
Table 3.8 Joint distribution of Hs
- Page 59 and 60:
MAXIMUM SPECTRAL ENERGY(m 2 /Hz) 30
- Page 61 and 62:
N 330 30 300 60 W E 240 120 2.5 - 3
- Page 63 and 64:
360 WATER DEPTH : 16 m MEASURED AT
- Page 65 and 66:
At location L2, the near surface (8
- Page 67 and 68:
N 330 30 300 60 W E 10% 20% 240 30%
- Page 69 and 70:
N 330 30 300 60 W E 10% 20% 240 30%
- Page 71 and 72:
1010 1012 1014 1016 1010 1012 1014
- Page 73 and 74:
0 Location 20 deg 13' 40.23" N : 86
- Page 75 and 76:
3.4 WATER QUALITY CHARACTERISTICS I
- Page 77 and 78:
Table 3.12 Hydrochemical characteri
- Page 79 and 80:
Table 3.13 Tracemetal elements in s
- Page 81 and 82: Table 3.15 Bacterial population in
- Page 83 and 84: Table 3.17 Composition and mean abu
- Page 85 and 86: and N3 recorded highest diversity (
- Page 87 and 88: Table 3.19: Abundance (no. /m 2 ) o
- Page 89 and 90: Table 3.21 Abundance (no. /10cm 2 )
- Page 91 and 92: 0 20 Similarity 40 60 80 100 S#1 C#
- Page 93 and 94: Table 3.24 Percentage composition o
- Page 95 and 96: Table 3.26 Estimated group-wise fis
- Page 97 and 98: dry sandy beaches of Gahirmatha. Af
- Page 99 and 100: strongly recommended used of TED in
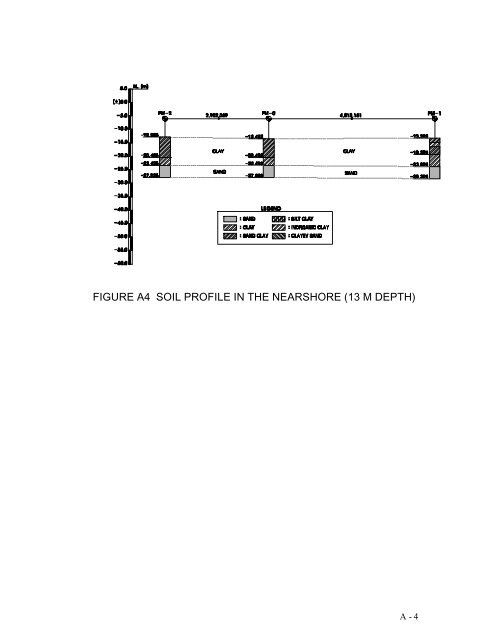
- Page 130 and 131: Appendix 1: Summary of soil investi
- Page 134 and 135: Appendix 2a List of Phytoplankton r
- Page 136 and 137: Appendix 2a contd……… Sr.No. G
- Page 138 and 139: Appendix 2b List of Phytoplankton r
- Page 140 and 141: Appendix 2b contd…… Sr.No. Gene
- Page 142 and 143: Appendix 2c contd…. Sr.No. Genera