

Annual Report 2009/2010 - JUWEL - Forschungszentrum Jülich
Annual Report 2009/2010 - JUWEL - Forschungszentrum Jülich
Annual Report 2009/2010 - JUWEL - Forschungszentrum Jülich

You also want an ePaper? Increase the reach of your titles
YUMPU automatically turns print PDFs into web optimized ePapers that Google loves.
The MGD products used in the study were already speckle-filtered. However, in order to<br />
investigate whether the speckle noise was sufficiently removed in the MGD processing, an<br />
additional filtering using different approaches was applied: Median, Gamma and Lee filtering<br />
were applied.<br />
For geometric correction, internal Ground Control Points (GCPs) from the input data were<br />
used (as well as from an additional DEM derived from a topographic map (scale 1:25.000).<br />
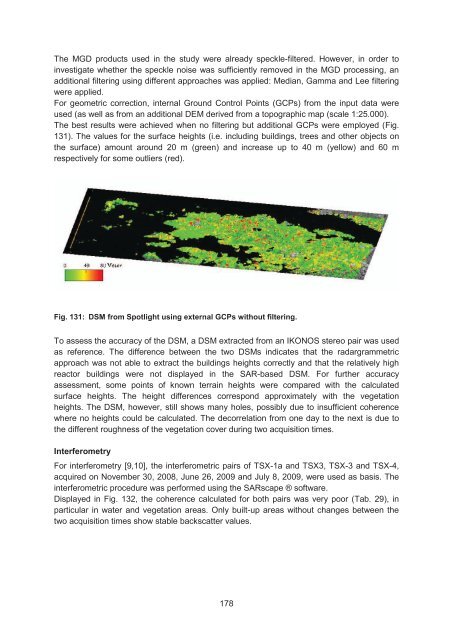
The best results were achieved when no filtering but additional GCPs were employed (Fig.<br />
131). The values for the surface heights (i.e. including buildings, trees and other objects on<br />
the surface) amount around 20 m (green) and increase up to 40 m (yellow) and 60 m<br />
respectively for some outliers (red).<br />
Fig. 131: DSM from Spotlight using external GCPs without filtering.<br />
To assess the accuracy of the DSM, a DSM extracted from an IKONOS stereo pair was used<br />
as reference. The difference between the two DSMs indicates that the radargrammetric<br />
approach was not able to extract the buildings heights correctly and that the relatively high<br />
reactor buildings were not displayed in the SAR-based DSM. For further accuracy<br />
assessment, some points of known terrain heights were compared with the calculated<br />
surface heights. The height differences correspond approximately with the vegetation<br />
heights. The DSM, however, still shows many holes, possibly due to insufficient coherence<br />
where no heights could be calculated. The decorrelation from one day to the next is due to<br />
the different roughness of the vegetation cover during two acquisition times.<br />
Interferometry<br />
For interferometry [9,10], the interferometric pairs of TSX-1a and TSX3, TSX-3 and TSX-4,<br />
acquired on November 30, 2008, June 26, <strong>2009</strong> and July 8, <strong>2009</strong>, were used as basis. The<br />
interferometric procedure was performed using the SARscape ® software.<br />
Displayed in Fig. 132, the coherence calculated for both pairs was very poor (Tab. 29), in<br />
particular in water and vegetation areas. Only built-up areas without changes between the<br />
two acquisition times show stable backscatter values.<br />
178


