The Secret Society: Descendants of Crypto-Jews in the San Antonio ...
The Secret Society: Descendants of Crypto-Jews in the San Antonio ...
The Secret Society: Descendants of Crypto-Jews in the San Antonio ...

Create successful ePaper yourself
Turn your PDF publications into a flip-book with our unique Google optimized e-Paper software.
approximation <strong>of</strong> <strong>the</strong> amount <strong>of</strong> avid<strong>in</strong> bound to <strong>the</strong> surface <strong>of</strong> <strong>the</strong> vesicles (note that <strong>the</strong><br />
fluorescence <strong>in</strong>tensity was measured at 548 nm, <strong>the</strong> wavelength for <strong>the</strong> color green). <strong>The</strong><br />
difference <strong>in</strong> green fluorescence between <strong>the</strong> dialyzed and undialyzed samples provides a clear<br />
<strong>in</strong>dication that avid<strong>in</strong>-FITC bound to <strong>the</strong> vesicle and rema<strong>in</strong>ed bound to <strong>the</strong> vesicles after<br />
dialysis. <strong>The</strong> <strong>in</strong>tensity measurements showed a 4-fold decrease after dialysis (Table 2). <strong>The</strong><br />
samples that were tested by o<strong>the</strong>r characterization methods, however, were left undialyzed to<br />
provide <strong>the</strong> possibility <strong>of</strong> more b<strong>in</strong>d<strong>in</strong>g <strong>of</strong> unbound avid<strong>in</strong> to <strong>the</strong> unbound surface biot<strong>in</strong>.<br />
Table 2: Fluorescence <strong>in</strong>tensities 48 hours after <strong>the</strong> addition <strong>of</strong> avid<strong>in</strong>, dialyzed and undialyzed<br />
Undialyzed<br />
Mole ratio <strong>of</strong> Biot<strong>in</strong> (%)<br />
Average Intensity (au)<br />
2.00 1925<br />
0.50 933<br />
0.05 81<br />
Dialyzed<br />
Mole ratio <strong>of</strong> Biot<strong>in</strong> (%)<br />
Average Intensity (au)<br />
2.00 346<br />
0.50 136<br />
0.05 21<br />
<strong>The</strong> ma<strong>in</strong> concern regard<strong>in</strong>g <strong>the</strong> viability <strong>of</strong> this avid<strong>in</strong>-biot<strong>in</strong> system was <strong>the</strong> aggregation <strong>of</strong><br />
<strong>the</strong> vesicles to a size that would be removed by <strong>the</strong> body. <strong>The</strong> aggregation <strong>of</strong> <strong>the</strong> vesicles were<br />
measured us<strong>in</strong>g dynamic light scatter<strong>in</strong>g (DLS) and freeze-fracture transmission electron<br />
microscopy (TEM). <strong>The</strong> trends for <strong>the</strong> aggregate formation and morphology <strong>of</strong> <strong>the</strong> vesicles<br />
provide <strong>in</strong>sight <strong>in</strong>to <strong>the</strong> optimal surface biot<strong>in</strong> concentration.<br />
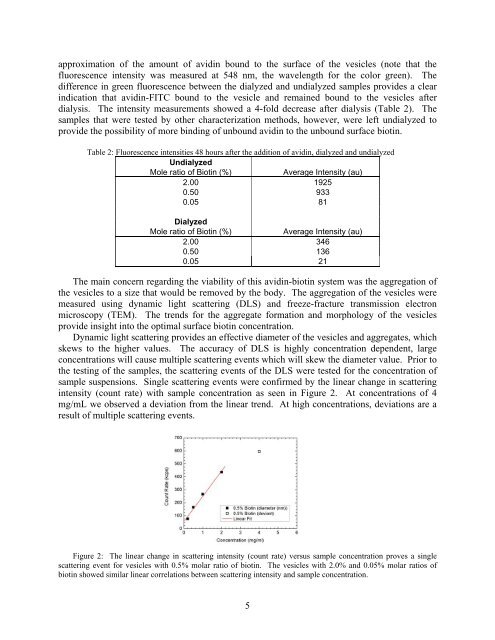
Dynamic light scatter<strong>in</strong>g provides an effective diameter <strong>of</strong> <strong>the</strong> vesicles and aggregates, which<br />
skews to <strong>the</strong> higher values. <strong>The</strong> accuracy <strong>of</strong> DLS is highly concentration dependent, large<br />
concentrations will cause multiple scatter<strong>in</strong>g events which will skew <strong>the</strong> diameter value. Prior to<br />
<strong>the</strong> test<strong>in</strong>g <strong>of</strong> <strong>the</strong> samples, <strong>the</strong> scatter<strong>in</strong>g events <strong>of</strong> <strong>the</strong> DLS were tested for <strong>the</strong> concentration <strong>of</strong><br />
sample suspensions. S<strong>in</strong>gle scatter<strong>in</strong>g events were confirmed by <strong>the</strong> l<strong>in</strong>ear change <strong>in</strong> scatter<strong>in</strong>g<br />
<strong>in</strong>tensity (count rate) with sample concentration as seen <strong>in</strong> Figure 2. At concentrations <strong>of</strong> 4<br />
mg/mL we observed a deviation from <strong>the</strong> l<strong>in</strong>ear trend. At high concentrations, deviations are a<br />
result <strong>of</strong> multiple scatter<strong>in</strong>g events.<br />
Figure 2: <strong>The</strong> l<strong>in</strong>ear change <strong>in</strong> scatter<strong>in</strong>g <strong>in</strong>tensity (count rate) versus sample concentration proves a s<strong>in</strong>gle<br />
scatter<strong>in</strong>g event for vesicles with 0.5% molar ratio <strong>of</strong> biot<strong>in</strong>. <strong>The</strong> vesicles with 2.0% and 0.05% molar ratios <strong>of</strong><br />
biot<strong>in</strong> showed similar l<strong>in</strong>ear correlations between scatter<strong>in</strong>g <strong>in</strong>tensity and sample concentration.<br />
5