The Secret Society: Descendants of Crypto-Jews in the San Antonio ...
The Secret Society: Descendants of Crypto-Jews in the San Antonio ...
The Secret Society: Descendants of Crypto-Jews in the San Antonio ...

Create successful ePaper yourself
Turn your PDF publications into a flip-book with our unique Google optimized e-Paper software.
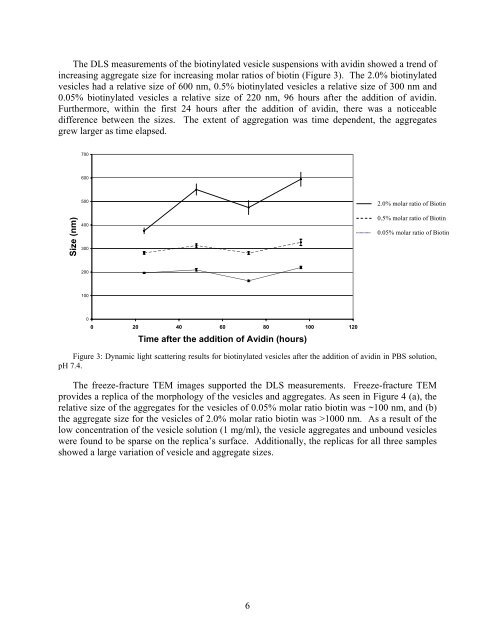
<strong>The</strong> DLS measurements <strong>of</strong> <strong>the</strong> biot<strong>in</strong>ylated vesicle suspensions with avid<strong>in</strong> showed a trend <strong>of</strong><br />
<strong>in</strong>creas<strong>in</strong>g aggregate size for <strong>in</strong>creas<strong>in</strong>g molar ratios <strong>of</strong> biot<strong>in</strong> (Figure 3). <strong>The</strong> 2.0% biot<strong>in</strong>ylated<br />
vesicles had a relative size <strong>of</strong> 600 nm, 0.5% biot<strong>in</strong>ylated vesicles a relative size <strong>of</strong> 300 nm and<br />
0.05% biot<strong>in</strong>ylated vesicles a relative size <strong>of</strong> 220 nm, 96 hours after <strong>the</strong> addition <strong>of</strong> avid<strong>in</strong>.<br />
Fur<strong>the</strong>rmore, with<strong>in</strong> <strong>the</strong> first 24 hours after <strong>the</strong> addition <strong>of</strong> avid<strong>in</strong>, <strong>the</strong>re was a noticeable<br />
difference between <strong>the</strong> sizes. <strong>The</strong> extent <strong>of</strong> aggregation was time dependent, <strong>the</strong> aggregates<br />
grew larger as time elapsed.<br />
700<br />
600<br />
Size (nm)<br />
500<br />
400<br />
300<br />
2.0% molar ratio <strong>of</strong> Biot<strong>in</strong><br />
0.5% molar ratio <strong>of</strong> Biot<strong>in</strong><br />
0.05% molar ratio <strong>of</strong> Biot<strong>in</strong><br />
200<br />
100<br />
0<br />
0 20 40 60 80 100<br />
Time after <strong>the</strong> addition <strong>of</strong> Avid<strong>in</strong> (hours)<br />
120<br />
Figure 3: Dynamic light scatter<strong>in</strong>g results for biot<strong>in</strong>ylated vesicles after <strong>the</strong> addition <strong>of</strong> avid<strong>in</strong> <strong>in</strong> PBS solution,<br />
pH 7.4.<br />
<strong>The</strong> freeze-fracture TEM images supported <strong>the</strong> DLS measurements. Freeze-fracture TEM<br />
provides a replica <strong>of</strong> <strong>the</strong> morphology <strong>of</strong> <strong>the</strong> vesicles and aggregates. As seen <strong>in</strong> Figure 4 (a), <strong>the</strong><br />
relative size <strong>of</strong> <strong>the</strong> aggregates for <strong>the</strong> vesicles <strong>of</strong> 0.05% molar ratio biot<strong>in</strong> was ~100 nm, and (b)<br />
<strong>the</strong> aggregate size for <strong>the</strong> vesicles <strong>of</strong> 2.0% molar ratio biot<strong>in</strong> was >1000 nm. As a result <strong>of</strong> <strong>the</strong><br />
low concentration <strong>of</strong> <strong>the</strong> vesicle solution (1 mg/ml), <strong>the</strong> vesicle aggregates and unbound vesicles<br />
were found to be sparse on <strong>the</strong> replica’s surface. Additionally, <strong>the</strong> replicas for all three samples<br />
showed a large variation <strong>of</strong> vesicle and aggregate sizes.<br />
6