IGCAR : Annual Report - Indira Gandhi Centre for Atomic Research
IGCAR : Annual Report - Indira Gandhi Centre for Atomic Research
IGCAR : Annual Report - Indira Gandhi Centre for Atomic Research

You also want an ePaper? Increase the reach of your titles
YUMPU automatically turns print PDFs into web optimized ePapers that Google loves.
“Actions today mould our tomorrows”
"…..we are convinced that if we are to<br />
play a meaningful role nationally, and in the<br />
community of nations, we must be second to none<br />
in the application of advanced technologies to the<br />
real problems of man and society."<br />
- Vikram Sarabhai
Editorial Committee<br />
Chairman<br />
Dr. P.R. Vasudeva Rao<br />
Members :<br />
Dr. Amarendra G<br />
Dr. Govindan Kutty K.V<br />
Shri Rajan M<br />
Dr. Sivaprasad P.V<br />
Shri. Somasekharan M<br />
Shri. Srinivasan G<br />
Shri. Subba Rao R.V<br />
Dr. Sundar C.S<br />
Address <strong>for</strong> Correspondence<br />
Dr. P.R. Vasudeva Rao<br />
Chairman, Editorial Committee,<br />
Director, Chemistry, Metallurgy and<br />
Materials Groups<br />
<strong>Indira</strong> <strong>Gandhi</strong> <strong>Centre</strong> <strong>for</strong> <strong>Atomic</strong> <strong>Research</strong>,<br />
Kalpakam - 603 102<br />
Phone: +91-44-27480229<br />
Fax: +91-44-27480065<br />
Email: vasu@igcar.gov.in<br />
Published by:<br />
Scientific In<strong>for</strong>mation & Resources Division<br />
<strong>Indira</strong> <strong>Gandhi</strong> <strong>Centre</strong> <strong>for</strong> <strong>Atomic</strong> <strong>Research</strong>,<br />
Kalpakkam - 603 102<br />
Website: www.igcar.gov.in<br />
February 2008<br />
Contents<br />
Foreword<br />
Editorial<br />
I. Fast Breeder Test Reactor 1<br />
II. Prototype Fast Breeder Reactor 11<br />
III. R&D <strong>for</strong> Fast Breeder Reactors 24<br />
IV. Fuel Cycle 81<br />
V. Enabling Technologies 116<br />
VI. Basic research 144<br />
VII. Infrastructure Facilities 173<br />
VIII. Awards, Publications, 184<br />
News & Events and<br />
Organisation<br />
Gamma-ray back scattering scanning facility<br />
Supercritical Fluid Extraction (SFE) facility in<br />
glove box<br />
Hardfacing of bottom plate of the grid plate by<br />
Plasma Transfer Arc (PTA) torch<br />
Fuel clad cross section of the central fuel pin<br />
with 154 GWd/t burn-up<br />
Sodium cleaning sytem <strong>for</strong> FBTR fuel sub<br />
assembly<br />
Machined iron thimbles<br />
Mixer-settler with rotated helical coils<br />
Wireless transmission from pulsating sensors<br />
Back Cover Legend<br />
Top : Second batch of Trainee Scientific Officers of Training School with Chief Guest Dr. Anil Kakodkar, Chairman, AEC,<br />
Prof. J.B. Joshi, Director, UCIT and other senior dignitaries<br />
Bottom : Students, Faculty Members and Organisers of Six week Summer Training Programme in Physics and Chemistry (STIPAC-07)
FOREWORD<br />
I am happy to release the <strong>Annual</strong> <strong>Report</strong> <strong>for</strong> the year 2007, highlighting<br />
various important achievements of the <strong>Centre</strong> in areas of fast reactor science,<br />
engineering and technology development.<br />
The FBTR has been successfully operated over the last one year, thus, realizing<br />
its objectives and in the process establishing new benchmarks. The<br />
current major mission of FBTR is to irradiate the fuel simulating PFBR fuel<br />
composition and towards this, the core has been expanded by adding two<br />
fresh Mark-I and eight fresh MOX subassemblies, after discharging one<br />
high burn-up (155 GWd/t) Mark-I subassembly <strong>for</strong> Post Irradiation<br />
Examination. Challenging campaigns have been planned in the areas of testing and evaluation of fuels,<br />
materials and components, achieving higher operating temperatures and safety per<strong>for</strong>mance.<br />
With regard to our committed mission of contributions to the design and construction of 500 MWe<br />
PFBR, we have been on the right path. The PFBR design review has continued, focusing on the issue of<br />
regulatory consent <strong>for</strong> "Erection of major equipment". Detailed analysis of thermal hydraulics and<br />
structural mechanics has been carried out <strong>for</strong> resolving the issues raised by Project Design Safety<br />
Committee, Civil Engineering Safety Committee and various specialist groups, constituted by <strong>Atomic</strong><br />
Energy Regulatory Board. With respect to manufacturing technology, the hard facing of grid plate on<br />
two annular tracks has been successfully achieved - a crucial milestone, paving the way <strong>for</strong> smooth<br />
progress of activities related to final manufacturing stage of grid plate <strong>for</strong> PFBR. The completion of the<br />
manufacture of safety vessel, one of the large diameter thin shell components of reactor assembly,<br />
con<strong>for</strong>ming to the tolerances higher than international nuclear standards is another significant milestone<br />
in our FBR programme. This has demonstrated indigenous manufacture capability and has<br />
given confidence towards successful completion of other important large sized vessels of PFBR<br />
Reactor Assembly. A sophisticated real time Decision Support System (DSS) comprising the most<br />
advanced meteorological <strong>for</strong>ecasting module and a dispersion and dose prediction module was developed<br />
and demonstrated <strong>for</strong> radiological emergency. We are committed to robust synergy with BHAVI-<br />
NI as well as industries to realize the PFBR with the design specifications on time, with a firm commitment<br />
to safety and economy.<br />
On materials front, we are working on modified D9I steels with active support from M/S MIDHANI.<br />
The base composition is similar to that of D9 SS with respect to all elements, except that titanium, silicon<br />
and phosphorous compositions have been optimized. Based on the synergy across various laboratories<br />
of our <strong>Centre</strong>, we are investigating various modified D9I heats with regard to mechanical<br />
properties and void-swelling behavior. We are utilizing atomistic experimental techniques to explain<br />
the observed trends. A new methodology based on ultrasonic C-scan presentation was identified to<br />
image the microstructure evolution during dynamic recrystallization of D9 alloy. Our <strong>Centre</strong> has also<br />
embarked on fabrication of metallic alloy fuel pins <strong>for</strong> test irradiations. The facility would be commissioned<br />
be<strong>for</strong>e the end of the year 2008.<br />
Reprocessing is a central and important issue in closing the fuel cycle. The success of fast breeder reactors<br />
depends on successful, cost-effective and robust closure of the fuel cycle. Enhanced research and<br />
development with large manpower <strong>for</strong> reprocessing activity is a priority <strong>for</strong> next few years. We have<br />
made significant progress by demonstrating reprocessing the high burn-up carbide fuel and necessary<br />
steps are being taken to improve the facilities to take on the reprocessing of the oxide fuels <strong>for</strong> PFBR.<br />
The plant layout <strong>for</strong> the Fast Reactor Fuel Cycle Facility (FRFCF) is taking good shape.<br />
Indigenous development of compact and reliable sensors has been an important programme of our<br />
<strong>Centre</strong>. It is a matter of pride that the electrochemical hydrogen meter developed in our <strong>Centre</strong> has<br />
been installed in the Phenix reactor in France <strong>for</strong> detection of steam leak into sodium. Innovations in<br />
electronics & instrumentation and sensor development have been the hallmark of our <strong>Centre</strong>,
widely acclaimed nationally and internationally. The operator in<strong>for</strong>mation system <strong>for</strong> Boron<br />
Enrichment Plant was installed and commissioned. The entire instrumentation package <strong>for</strong> oil level<br />
sensing, including the actual sensors <strong>for</strong> deployment in PFBR, were made in-house with remarkable<br />
per<strong>for</strong>mance. The service groups are doing commendable job in developing valuable infrastructure <strong>for</strong><br />
the <strong>Centre</strong> and gearing up to meet the large demands of XI plan targets.<br />
We have been believing and practicing the mantra of synergistic collaborations within the DAE as well<br />
as other academic institutes <strong>for</strong> innovative contributions in fast reactor science & technology. For<br />
example, the Kalman filter technique, developed in collaboration with BARC to confirm the dropping of<br />
the Diverse Safety Rods into the core of PFBR during a scram, has been tested and results indicate that<br />
the technique is suitable <strong>for</strong> practical implementation. Also, a laser triangulation system has been developed<br />
jointly by <strong>IGCAR</strong> and RRCAT, <strong>for</strong> planar surface profiling of Titanium dissolver vessel of reprocessing<br />
plants of fast reactors.<br />
The successes achieved by our Department are largely due to the development and management of<br />
quality manpower. On human resources development front, it is matter of great pride that we have<br />
made commendable progress. The Training School of Bhabha <strong>Atomic</strong> <strong>Research</strong> <strong>Centre</strong> (BARC) at <strong>IGCAR</strong><br />
campus has turned out its first batch officers in September 2007, which is a momentous occasion <strong>for</strong> the<br />
<strong>Centre</strong>. Further, we have now added two new disciplines <strong>for</strong> post-graduates in Physics and Chemistry<br />
viz., Nuclear Reactor Physics and Nuclear Fuel cycle chemistry. It is also heartening to realize the academic<br />
programmes of Homi Bhabha National Institute (HBNI), thus imparting multidisciplinary training<br />
courses both <strong>for</strong> employees and students. We have started University Grants Commission (UGC)-<br />
Department of <strong>Atomic</strong> Energy (DAE) Consortium <strong>for</strong> Scientific <strong>Research</strong> (CSR) Node, which will help to<br />
strengthen the quality and quantity of research in various Indian Universities in the areas of Physical,<br />
Chemical and Engineering Sciences. In its commitment to harness quality manpower <strong>for</strong> science and<br />
technology, the DAE continues to be imaginative and innovative.<br />
Over the last one year, we have shown high commitment to realize goals, strategic sectors, collaboration<br />
with academia and research institutes and industries. It has been a 360 progress experience <strong>for</strong><br />
the <strong>Centre</strong>. The year 2008 would see milestone achievements in basic science, FBTR campaigns towards<br />
valuable contributions to realize PFBR and future FBRs, robust reprocessing of oxide and metallic fuels.<br />
I am looking <strong>for</strong> more passion, higher quality, enhanced commitment to science, technology and mission-mode<br />
programmes, innovation and imagination, increased productivity and above all more happiness<br />
and fulfillments <strong>for</strong> you and your families in the year 2008. I would like to quote George Bernard<br />
Shaw - "Imagination is the beginning of creation. You imagine what you desire, you will what you imagine,<br />
and at last you create what you will...".<br />
Successful realization of the mission of the <strong>Centre</strong>, namely robust Sodium Cooled Fast Breeder Rector<br />
Science & Technology with Closed Fuel Cycle and the vision of the world leadership in this technology<br />
needs a good connecting bridge between the mission and the vision. Moreover, connecting bridge<br />
between the mission and the vision has to be short in span of time to reap the benefits. I am inspired<br />
by Albert Einstein's quotation - "I never think of the future. It comes soon enough". We would realize<br />
the mission and the vision of the <strong>Centre</strong> soon enough.<br />
IGC <strong>Annual</strong> <strong>Report</strong> is a remarkable example of steadily improving the standards in terms of technical<br />
content and readability of the significant work being carried out in the <strong>Centre</strong>. The credit of achieving<br />
this excellence is entirely due to Dr. P. R. Vasudeva Rao, Chairman, Editorial Committee and his competent<br />
colleagues.<br />
Baldev Raj<br />
Director
EDITORIAL<br />
It is with great pleasure that we present you the annual report of the <strong>Indira</strong> <strong>Gandhi</strong> <strong>Centre</strong> <strong>for</strong><br />
<strong>Atomic</strong> <strong>Research</strong> <strong>for</strong> the year 2007. During the year, the <strong>Centre</strong> has crossed many important<br />
milestones, and recorded many achievements, both with respect to the fast reactor programme<br />
and in the basic and applied research programmes. The continued successful operation of FBTR<br />
and the progress in construction of PFBR have been a source of inspiration <strong>for</strong> us and have given<br />
us the confidence that we are well on course to achieve the target of a robust and safe commercial<br />
fast reactor and associated fuel cycle within the next few years. As we continue to set targets<br />
such as higher burn-up and longer life of the fuel cycle plants, new issues in fuel cycle emerge and<br />
challenge the scientists. There is also the challenge to further reduce the unit energy cost of the<br />
future fast reactors, while simultaneously enhancing safety. Thus, R & D at <strong>IGCAR</strong> is continuously<br />
evolving to meet the challenges and this has kept the research atmosphere dynamic and<br />
vibrant. Strategies to meet such challenges expeditiously have to necessarily include commensurate<br />
human resource development in terms of training and induction of young minds and<br />
enhancement of collaborations with academic and research institutions. Both these aspects have<br />
received attention at <strong>IGCAR</strong>; this year saw the completion of the first year of the BARC training<br />
school at Kalpakkam, and introduction of courses on nuclear fuel cycle chemistry and reactor<br />
physics and safety <strong>for</strong> the second batch. The strengthening of the training programme would be<br />
an important step that would pay rich dividends <strong>for</strong> the fast reactor programme in the years to<br />
come.<br />
The present annual report amply illustrates the all round progress achieved at the <strong>Centre</strong>.<br />
Besides the mission oriented R & D projects, we also report the impressive achievements in basic<br />
research and the attention given to development of infrastructure and facilities, as well as the<br />
environment in and around the plant site and township.<br />
The Editorial Committee is grateful to Dr. Baldev Raj, Director <strong>for</strong> his constant encouragement<br />
and guidance in bringing out this report. We would also like to thank the authors <strong>for</strong> their valuable<br />
contributions, reflecting the major research and developments being carried out in the<br />
<strong>Centre</strong>. Overall, bringing this report has been a happy experience <strong>for</strong> the editorial team; our<br />
strength has been further augmented by the support provided by Sri Jayakumar from SIRD and<br />
Srri Harikumar from EID. The editorial committee would like to acknowledge Shri M.<br />
Somasekharan, Head, Scientific In<strong>for</strong>mation Resources Division and Shri M. Ganapathy <strong>for</strong> rendering<br />
necessary assistance in bringing out the report.<br />
We believe that the annual report of <strong>IGCAR</strong> has continued to maintain the high standards in line<br />
with the overall philosophy of the <strong>Centre</strong> to achieve excellence in every activity. We are at the<br />
same time, open to suggestions <strong>for</strong> further improvement. We have, in fact, received many messages<br />
from readers with valuable suggestions and we have tried to implement them in this issue.<br />
We have the confidence, there<strong>for</strong>e, that this issue will be a better reading material than the previous<br />
reports both in terms of quality of articles and presentation style, and we need all your<br />
inputs to either confirm or negate this conclusion !<br />
Wishing all the readers a Happy and Prosperous New Year 2008,<br />
(P.R.Vasudeva Rao)<br />
Chairman, Editorial Committee<br />
Director, Chemistry, Metallurgy & Materials Group<br />
<strong>IGCAR</strong>
Chapter -1<br />
FAST BREEDER TEST REACTOR<br />
I.1. Experiments in the 14 th Irradiation Campaign<br />
As a part of the programme to conduct a series of experiments in FBTR<br />
starting from the 14 th irradiation campaign (commenced on February 28,<br />
2007), several important experiments were completed. These are: validation of<br />
failed fuel detection system, measurement of flux at the grid plate location,<br />
accelerated irradiation of grid plate material as a part of its residual life<br />
assessment, and short-term irradiation of a single pin of PFBR fuel <strong>for</strong> studying<br />
the initial restructuring. Concurrently, long-term irradiation of SS 316 and D-9<br />
alloys has also been initiated. The core configuration is shown in Fig. 1.
IGC<br />
<strong>Annual</strong> <strong>Report</strong> 2007<br />
Experiment to validate failed<br />
fuel detection system<br />
This experiment was<br />
conducted with a special<br />
subassembly having 19<br />
per<strong>for</strong>ated pins (with a total<br />
exposure area of 112.8 cm 2 ) of<br />
natural uranium loaded<br />
successively at five different<br />
locations. The main objectives<br />
of the experiment were:<br />
To calibrate Delayed<br />
Neutron Detection (DND)<br />
system at different power<br />
levels, primary sodium flows<br />
and sodium inlet<br />
temperatures<br />
To establish the feasibility<br />
of localization of failed SA<br />
using DND system<br />
To check the response of<br />
Clad Rupture Detection<br />
(CRD) in argon system<br />
To validate the failed fuel<br />
localization setup.<br />
The results were satisfactory<br />
and validated the ability of the<br />
DND system not only to detect<br />
any clad breach, but also to<br />
broadly identify the zone of<br />
failure from the contrast ratios<br />
of the east & west DND signals.<br />
Failed fuel localisation system,<br />
intended to determine the age<br />
of the fuel per<strong>for</strong>med well in<br />
detecting the presence of Kr<br />
and Xe in cover gas argon.<br />
Residual life assessment of the<br />
grid plate<br />
Grid plate, which supports<br />
entire core, is one of the<br />
important components that limit<br />
the life of the reactor. The life<br />
limiting factors are residual<br />
ductility and swelling.<br />
Displacement per atom (DPA) is<br />
one of the parameters that is<br />
found to have good correlation<br />
with the radiation damage to<br />
the material. However, DPA<br />
cannot be directly measured.<br />
Fluxes above 0.1 MeV<br />
contribute maximum to the<br />
DPA. The fission reactions rates<br />
in 237 Np have good correlation<br />
with the DPA rate, as the crosssection<br />
threshold is around 400<br />
keV. Hence, Neptunium foils<br />
were used to measure the grid<br />
plate fluence. Standard<br />
irradiation experimental<br />
subassembly with a capsule was<br />
used. The special capsule is<br />
made of SS rod containing the<br />
foils at the guide sleeve and<br />
support plate of the grid plate<br />
and core mid plane. As the<br />
capsule is longer than the<br />
standard irradiation capsules,<br />
flow induced vibration test was<br />
carried out with a dummy<br />
subassembly at FRTG and the<br />
vibration found to be<br />
negligible. The subassembly<br />
was loaded in 4th ring of the<br />
core and the reactor operated<br />
at 15.6 MWt <strong>for</strong> about 14 days.<br />
The experimental carrier along<br />
with the capsule was<br />
discharged and sent to RML hot<br />
cell <strong>for</strong> retrieving the foils from<br />
the capsule and counting of<br />
fission product activities.<br />
Concurrently, test specimens of<br />
SS 316 used in the reactor are<br />
also being irradiated to<br />
simulate the damage. They will<br />
be retrieved at the end of the<br />
14 th campaign after 70 days of<br />
irradiation and measurements<br />
of residual ductility and swelling<br />
carried out. The results of both<br />
these experiments will provide<br />
the basis <strong>for</strong> the residual life<br />
assessment of the grid plate.<br />
Irradiation of PFBR test fuel pin<br />
<strong>for</strong> initial gap closure<br />
The peak Linear Heating Rate<br />
(LHR) <strong>for</strong> PFBR fuel is 450<br />
W/cm. From fabrication<br />
considerations, the fuel<br />
fabricator has asked <strong>for</strong><br />
relaxation of the tolerances on<br />
the pellet diameter. This will<br />
result in higher fuel-clad gap,<br />
and the fresh fuel will hence<br />
have to be operated at lower<br />
LHR till the gap closes by<br />
cracking and restructuring of<br />
the fuel. The duration of<br />
operation at low LHR has<br />
implications on the economics<br />
of power generation. To<br />
determine the time required <strong>for</strong><br />
the gap to close, a single pin of<br />
PFBR test fuel was irradiated in<br />
FBTR <strong>for</strong> 14 days. Mixed Oxide<br />
with 29% PuO 2 and rest UO 2<br />
enriched with about 53.5% U 233<br />
is used as fuel <strong>for</strong> this pin.<br />
2 FAST BREEDER TEST REACTOR
IGC<br />
<strong>Annual</strong> <strong>Report</strong> 2007<br />
Active fuel column length in this<br />
fuel pin is 240 mm. The<br />
subassembly with the single pin<br />
was loaded in the first ring, so<br />
that it will operate at a peak<br />
linear power of 400 W/cm<br />
when the Mark I SA in I ring is<br />
generating a peak power of<br />
297 W/cm. The reactor power<br />
was maintained at the<br />
corresponding value of 15.6<br />
MWt. The pin has been<br />
discharged <strong>for</strong> Post Irradiation<br />
Examination (PIE).<br />
Structural material irradiation<br />
To generate baseline<br />
irradiation per<strong>for</strong>mance data<br />
on the indigenously developed<br />
D9 alloy at low temperature,<br />
two subassemblies with<br />
pressurized capsules and tensile<br />
and swelling specimens were<br />
loaded in the fourth ring at the<br />
start of the 14 th campaign.<br />
Duration of irradiation will<br />
depend on the evolution of the<br />
core and the temperatures. The<br />
maximum damage attained will<br />
be about 24 dpa per Effective<br />
Full Power Year (EFPY). For the<br />
high values of dpa required<br />
(>70 dpa), the irradiation<br />
hence has to be continued <strong>for</strong><br />
at least three EFPY.<br />
full range.<br />
Testing of acoustic detector and<br />
Kalman reactivity filter<br />
Various methods are being<br />
contemplated to confirm the<br />
dropping of Divers Safety Rod<br />
Drive Mechanism (DSRDM) into<br />
the core during a scram. One<br />
of these is the Kalman reactivity<br />
meter and the other is acoustic<br />
technique. The Kalman filter<br />
technique was tested in FBTR in<br />
the shutdown state, and<br />
reactivity changes due to<br />
dropping of control rods were<br />
studied. The results were found<br />
promising. Two acoustic devices<br />
have been designed by FRTG<br />
and fabricated at CWD <strong>for</strong><br />
installation in the Experimental<br />
canals of FBTR. It will be used<br />
Mark-I<br />
06-22<br />
06-21<br />
06-20<br />
06-19<br />
06-18<br />
06-17<br />
06-23<br />
05-18<br />
05-17<br />
05-16<br />
05-15<br />
05-14<br />
05-13<br />
06-24<br />
05-19<br />
04-15<br />
04-14<br />
04-13<br />
04-12<br />
04-11<br />
06-25<br />
05-20<br />
04-16<br />
03-11<br />
03-10<br />
03-09<br />
03-08<br />
04-10<br />
06-26<br />
02-07<br />
05-21<br />
04-17<br />
03-12<br />
02-08<br />
02-06<br />
03-07<br />
06-27<br />
01-04<br />
04-18<br />
01-03<br />
02-05<br />
03-06<br />
05-22<br />
03-13<br />
06-28<br />
04-19<br />
03-14<br />
02-10<br />
01-05<br />
05-23<br />
00-00<br />
01-02<br />
02-04<br />
06-29<br />
05-24<br />
04-20<br />
03-15<br />
02-11<br />
01-06<br />
02-03<br />
06-30<br />
05-25<br />
04-21<br />
03-16<br />
02-12<br />
02-02<br />
03-03<br />
06-31<br />
05-26<br />
04-22<br />
03-17<br />
03-18<br />
03-02<br />
04-04<br />
to sense the dropping of control<br />
rods during shutdown state of<br />
the reactor. The procedures <strong>for</strong><br />
their handling and disposal<br />
have been reviewed by the Pile<br />
Handling Procedure Review<br />
Committee. Based on the<br />
review, modifications are being<br />
carried out on the devices.<br />
06-32<br />
05-27<br />
04-23<br />
04-01<br />
01-01 03-01<br />
05-01<br />
04-02<br />
06-33<br />
05-28<br />
05-29<br />
05-30<br />
05-02<br />
05-03<br />
06-34<br />
06-35<br />
06-36<br />
06-01<br />
06-02<br />
06-03<br />
Nickel Reflector<br />
Sb-Be source<br />
High Pu MOX<br />
Control rods<br />
Mark-II<br />
Testing of PFBR neutron<br />
06-16<br />
06-15<br />
05-12<br />
06-14<br />
05-11<br />
04-09<br />
05-10<br />
04-08<br />
04-07<br />
04-06<br />
04-05<br />
05-06<br />
05-05<br />
05-04<br />
06-06<br />
06-05<br />
06-04<br />
Power reactor test<br />
fuel<br />
detectors<br />
06-13<br />
06-12<br />
05-09<br />
05-08<br />
05-07<br />
06-08<br />
06-07<br />
The PFBR in-core neutron<br />
06-11<br />
06-10<br />
06-09<br />
Core as of Nov ‘07<br />
detectors developed by BARC<br />
were tested in the detector pits<br />
to check their response over the<br />
Fig.1 Core configuration <strong>for</strong> 14 th irradiation compaign<br />
FAST BREEDER TEST REACTOR 3
IGC<br />
<strong>Annual</strong> <strong>Report</strong> 2007<br />
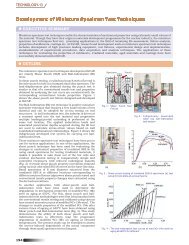
I.2. Metallographic Examination of the Mixed Carbide<br />
Fuel Pin which has seen 154 GWd/t burn up in FBTR<br />
Remote metallographic<br />
examination was carried out<br />
on a fuel pin which is<br />
proximate to the centre of the<br />
core. The fuel pin was cut<br />
using diamond wafer wheel<br />
to extract specimens from the<br />
centre and the end of fuel<br />
column. Sequential grinding<br />
and polishing of the molded<br />
specimens were carried out.<br />
Replicas of the polished<br />
surface of the specimens were<br />
taken and transferred out of<br />
the hot cell. They were<br />
observed under microscope<br />
after decontamination and<br />
gold sputter coating.<br />
Photo micrograph of fuel<br />
cross section at the centre of<br />
the fuel column (see Fig.1)<br />
revealed circumferential<br />
cracking of fuel and a distinct<br />
zone devoid of fuel porosities<br />
near the outer diameter.<br />
Favorable stress-temperature<br />
regime near the outer<br />
diameter of the pellet has led<br />
to hot compaction of the<br />
pellet thereby creating a<br />
dense zone. The porosity<br />
exhaustion is attributed to the<br />
creep of the fuel due to Fuel<br />
Clad Mechanical Interaction<br />
(FCMI). The micrographs<br />
revealed complete closure of<br />
the fuel-clad gap and<br />
circumferential cracking both<br />
at the centre and end of the<br />
fuel column indicating that<br />
the entire fuel column<br />
has entered the<br />
restrained swelling regime.<br />
Measurements on the<br />
micrographs further revealed<br />
that the outer and inner<br />
diameter of the clad has<br />
increased due to void<br />
swelling. The measured<br />
values were consistent with<br />
the diamteral changes<br />
measured using fuel pin<br />
profilometer.<br />
Fig.1 Photomicrograph of the fuel-clad cross section at the centre of the fuel column.<br />
4 FAST BREEDER TEST REACTOR
IGC<br />
<strong>Annual</strong> <strong>Report</strong> 2007<br />
I.3. Seismic Re-evaluation<br />
Seismic re-evaluation of FBTR<br />
is taken up as a joint research<br />
project with <strong>IGCAR</strong> and SRI,<br />
since the plant has not been<br />
seismically qualified at the<br />
design stage as per the present<br />
norms. In seismic evaluation of<br />
an existing plant, current<br />
seismic criteria is generally<br />
used to qualify a minimum set<br />
of Structures, Systems and<br />
Components (SSC) required to<br />
safely shutdown the reactor,<br />
maintain the plant in a safe<br />
condition and safely<br />
contain /confine radioactive<br />
inventory. The systems required<br />
to be qualified <strong>for</strong> achieving<br />
these functions should include<br />
one main path and one<br />
redundant<br />
path.<br />
The conditions postulated<br />
following a seismic event are:<br />
simultaneous off-site and plant<br />
generated power loss up to 72<br />
hours (other than the<br />
seismically qualified emergency<br />
LATITUDE<br />
LONGITUDE<br />
Fig.1 Seismic sources around site<br />
power) and no external supply<br />
of make-up water and other<br />
media <strong>for</strong> safety system<br />
operation (e.g. diesel oil) <strong>for</strong><br />
72 hours. Also, earthquake<br />
induced fires and floods and<br />
other seismic interactions<br />
affecting the safety functions<br />
shall be avoided.<br />
The seismic re-evaluation<br />
involves ten tasks, viz.<br />
Preparation of criteria<br />
document, Determination of<br />
Review Basis Ground Motion<br />
(RBGM), Safety analysis,<br />
Collection of as built data,<br />
Preparation of seismic SSC list,<br />
Plant<br />
walk-down,<br />
Determination of seismic<br />
response of SSCs, Capacity<br />
assessment of components,<br />
System model analysis and<br />
Capacity assessment of plant.<br />
The Criteria document was<br />
prepared based on IAEA Safety<br />
<strong>Report</strong> Series 28 (2003), and<br />
has been reviewed by AERB<br />
review committee.<br />
The RBGM was arrived at by<br />
Probabilistic Seismic Hazard<br />
Analysis. This was a pathbreaking<br />
exercise by the Task<br />
Force members from<br />
CSED/AERB. The geometries<br />
and spatial distribution of<br />
potential sources of seismic<br />
activity in the region around the<br />
plant site were determined from<br />
past data (Fig.1).<br />
Approximately 100 records of<br />
earthquake data <strong>for</strong> the site<br />
from 1807 to 2001 are<br />
available. The largest<br />
earthquake to have occurred in<br />
Peninsular India was the<br />
earthquake of February 8,<br />
1900, with a magnitude of 6.0,<br />
with epicenter at Coimbatore,<br />
at a distance of 400 km from<br />
the plant site. From these data,<br />
the hazard curve <strong>for</strong> the site<br />
was worked out and RBGM<br />
arrived at (Fig.2). The proposed<br />
RBGM has been approved by<br />
the AERB Review Committee.<br />
For safety analysis, seismically<br />
induced initiating events (IE)<br />
were identified based on<br />
extensive brain-storming<br />
sessions. For these IEs, frontline<br />
systems were identified. For<br />
each of these frontline systems,<br />
exhaustive fault trees (FT) were<br />
developed up to the component<br />
/ sensor level based on the asbuilt<br />
drawings and discussion<br />
with field personnel. The<br />
Seismic Structures, Systems,<br />
Components list (SSSCL) was<br />
obtained from the minimal cutsets<br />
of the fault trees <strong>for</strong> the<br />
accident sequences. About 400<br />
components are identified in<br />
the SSC list. The qualification of<br />
FAST BREEDER TEST REACTOR 5
IGC<br />
<strong>Annual</strong> <strong>Report</strong> 2007<br />
these SSCs has to be done by<br />
analysis, testing or from<br />
experience data base. The SSC<br />
list was further segregated<br />
based on qualification<br />
methodology. The document on<br />
safety analysis has been<br />
reviewed by AERB.<br />
The major structures to be<br />
analyzed are the Reactor<br />
Containment Building (RCB),<br />
Steam Generator Building<br />
(SGB), Service Building (SB)<br />
and Control Building (CB). The<br />
major systems to be qualified<br />
by analysis are the primary<br />
sodium system and secondary<br />
sodium system. Consultancy<br />
contract was awarded to M/s<br />
Engineering Mechanics and<br />
<strong>Research</strong> Company (M/s<br />
EMRC), Bangalore, <strong>for</strong> analysis<br />
of RCB, SB & SGB as well as the<br />
secondary sodium system.<br />
EMRC has completed the<br />
modeling and developed floor<br />
response spectra <strong>for</strong> all the<br />
buildings <strong>for</strong> the RBGM. The<br />
modeling of secondary sodium<br />
system has also been<br />
completed by EMRC, and<br />
analysis <strong>for</strong> the RBGM is in<br />
progress. CED, <strong>IGCAR</strong> carried<br />
out a parallel modeling of RCB<br />
<strong>for</strong> checking the EMRC results.<br />
The analysis of CB has been<br />
carried out by CSED, AERB. The<br />
modeling of the primary system<br />
has been completed by NEG,<br />
<strong>IGCAR</strong>, and analysis <strong>for</strong> the<br />
RBGM and floor response<br />
spectra thereof is in progress.<br />
The analysis will include not<br />
only structural integrity, but also<br />
scrammability of the control<br />
rods and pump non-seizure. In<br />
addition, CED, <strong>IGCAR</strong> has<br />
done the modeling of some<br />
support system structures,viz<br />
raw water pump house, cooling<br />
tower and maintenance<br />
building. Analysis of RCB<br />
ventilation ducting is being<br />
done by ROMG.<br />
Ten components have been<br />
identified <strong>for</strong> qualification by<br />
testing on shake-table. For<br />
these, the as-built drawings of<br />
the panels<br />
have been<br />
prepared.<br />
Testing will be<br />
taken up<br />
shortly.<br />
qualified from experience data<br />
base, subject to proper<br />
anchorages. Plant walk-down<br />
was carried out by a team of<br />
engineers & specialists from<br />
NPCIL, AERB & <strong>IGCAR</strong>. Seismic<br />
interactions and anchorages<br />
were studied. The findings of<br />
the walk-down have been<br />
reviewed by the AERB Review<br />
Committee. The walk-down<br />
revealed several areas where<br />
proper anchorages are<br />
required, and areas where<br />
seismic house-keeping is called<br />
<strong>for</strong> to avoid seismic interaction.<br />
Seismic house-keeping has<br />
been completed in zero level of<br />
RCB.<br />
The results of the analysis of<br />
the SSC and of the qualification<br />
tests of components in the<br />
shake table will be submitted to<br />
the Review Committee. Retrofitting<br />
measures, if required,<br />
will be taken up based on the<br />
recommendations of the Review<br />
Committee. The seismic<br />
anchorages will be modified<br />
wherever required, based on<br />
the findings of the plant walkdown<br />
and comments of the<br />
Review Committee. These are<br />
the minimum required <strong>for</strong> plant<br />
relicensing.<br />
Fig.2 Review basis ground motion<br />
Several<br />
components<br />
have been<br />
identified as<br />
g e t t i n g<br />
Finally, system modeling,<br />
capacity assessment of<br />
components and seismic<br />
margin of the plant will be<br />
assessed as a research activity.<br />
6 FAST BREEDER TEST REACTOR
IGC<br />
<strong>Annual</strong> <strong>Report</strong> 2007<br />
I.4. Validation of Failed Fuel Detection System<br />
An assessment of the<br />
sensitivity and localization<br />
capabilities of the DND system<br />
in FBTR was made by a<br />
series of delayed neutron<br />
measurements. Simulation of<br />
failed fuel pin was by a natural<br />
uranium fission product source<br />
in the <strong>for</strong>m of a special<br />
subassembly consisting of 19<br />
stainless steel cladded, natural<br />
uranium metal pins, each<br />
having a large exposed area in<br />
the <strong>for</strong>m of 189 small holes of<br />
2 mm diameter. The exposed<br />
area amounted to 112.8 cm 2 ,<br />
equivalent to 28.2 cm 2 of<br />
regular pin from fission product<br />
release point of view. Be<strong>for</strong>e<br />
starting measurements with<br />
the special subassembly,<br />
background measurements in<br />
the DND system <strong>for</strong> the current<br />
49-subassembly core<br />
configuration were carried out.<br />
Measurements were then taken<br />
with the special subassembly<br />
loaded in the central location<br />
(00/00) and in the locations<br />
02/04, 04/07, 02/10 &<br />
04/19. (The first number gives<br />
fuel SA ring number and<br />
second number gives the<br />
location number within the ring.<br />
The locations 02/04 and<br />
04/07 are on the west side and<br />
the locations 02/10 and 04/19<br />
are on the east side- Fig.1). At<br />
each location measurements<br />
were done at power levels<br />
starting from 0.35 MWt and<br />
going up to 10 MWt, with the<br />
reactor sodium inlet<br />
temperature ranging from 453<br />
to 613K.<br />
The delayed neutron signal<br />
shows an increase with core<br />
inlet temperature in all<br />
locations. The typical signal<br />
behaviour with temperature is<br />
shown in the Fig.2 when the<br />
special subassembly is in the<br />
central location. The sensitivity<br />
of the system is there<strong>for</strong>e high<br />
at higher core inlet sodium<br />
temperature.<br />
The observed behaviour of<br />
signal as a function of power is<br />
shown in Fig. 3, 4 & 5. An<br />
actual fuel failure would show a<br />
similar behaviour which makes<br />
it possible, using the contrast<br />
ratios, to localize fuel pin<br />
failure to the half sector and the<br />
ring in which it is located.<br />
Fig.1 DND subassembly locations<br />
The contrast ratios of the<br />
DND signals measured at 10<br />
MW <strong>for</strong> all the locations are<br />
given in Table 1, which shows a<br />
strong dependence of the ratio<br />
on the location of the special<br />
subassembly. These ratios are<br />
FAST BREEDER TEST REACTOR 7
IGC<br />
<strong>Annual</strong> <strong>Report</strong> 2007<br />
Fig.2 Temperature dependence of<br />
DND signals (SA at 00-00)<br />
<strong>for</strong> signals without background.<br />
Hence these values will prove<br />
useful in deciphering the<br />
location of an actual pin<br />
failure.<br />
The expected rise in signal<br />
over background per cm 2 of<br />
actual fuel failure is given in<br />
Table 2. Considering the<br />
counting statistics of the<br />
detectors used <strong>for</strong> display on<br />
the console, a measurability<br />
criterion of 3 σ background<br />
value implies a failure if the<br />
background counts exceed by<br />
6.7 % on the east and / or 4.8<br />
% on the west under conditions<br />
of sodium inlet temperature<br />
prevailing more than 573K.<br />
The analysis has brought out<br />
that the system is capable of<br />
detecting even fuel defects to<br />
an extent of 0.5 to 1 cm 2 .<br />
Using the measurability criteria<br />
and the pattern of increase of<br />
signal over background, it will<br />
be possible to determine the<br />
size of the clad opening and<br />
localize the defect to the half<br />
sector and the ring in which it is<br />
located.<br />
Fig.4 Response of the DND signal as<br />
function of power (DND SA in 02/04<br />
location)<br />
85m 87 88 135 138 88<br />
K r , K r , K r , X e , C s & R b .<br />
This confirms that cover gas<br />
activity will provide the first<br />
confirmation of an actual pin<br />
failure. General background<br />
Fig.3 Response of the DND signal as<br />
function of power (DND SA in 00/00<br />
location)<br />
The cover gas activity<br />
monitors located in the CRD<br />
circuit and common cover gas<br />
reject circuit also responded<br />
very well. Cover gas samples<br />
collected at higher powers<br />
41<br />
showed the presence of A r ,<br />
Fig.5 Response of the DND signal as<br />
function of power (DND SA in 04/07<br />
location)<br />
Table 1 : Ratios of signals emanating from special SA at 10 MWt<br />
Table 2 : Expected rise in signal (over background) per cm 2 of actual clad failure at 10 MWt<br />
8 FAST BREEDER TEST REACTOR
IGC<br />
<strong>Annual</strong> <strong>Report</strong> 2007<br />
radiation in RCB was 0.3 mR/h,<br />
with a maximum of 1.0 mR/h at<br />
specific locations. A PVC<br />
cocoon was spread over the<br />
pile and hoses provided to<br />
direct the leaking argon to the<br />
exhaust to reduce the activity<br />
inside RCB.<br />
During this experiment the<br />
cover gas was also sampled<br />
and analyzed using Fail Fuel<br />
Localization System (FFLS). The<br />
system per<strong>for</strong>med as per the<br />
design intent and in actual<br />
failure of fuel pin it is expected<br />
to give the age of the failed fuel<br />
pin. Making use of DND<br />
signals, East and West DND<br />
signal ratios and the age of the<br />
failed pin obtained from the<br />
cover gas analysis, the<br />
suspected failed fuel<br />
subassemblies can be short<br />
listed. Actual failed<br />
subassembly can be identified<br />
from this list by limited trial and<br />
error fuel handling and reactor<br />
operations.<br />
I.5. Modification of Trailing Cable System of FBTR to<br />
Minimise Failure of Cores of the Cable<br />
Fuel handling operations in<br />
FBTR are carried out in the<br />
shutdown state of the reactor.<br />
Fuel handling is done through<br />
a single fuel handling canal<br />
which gets aligned over 745<br />
positions of the reactor by<br />
relative rotation of two<br />
eccentrically mounted rotating<br />
plugs, viz. Small Rotating Plug<br />
(SRP) and Large Rotating Plug<br />
(LRP). Prior to plug rotation, the<br />
cables carrying the signals<br />
which are required <strong>for</strong> reactor<br />
operation, but not <strong>for</strong> fuel<br />
Fig.1 Original cable routing<br />
handling, are disconnected<br />
with the help of disconnectible<br />
connectors. However, signals<br />
which are essential <strong>for</strong> fuel<br />
handling are routed through a<br />
trailing cable system.<br />
The trailing cable system<br />
consists of four cables<br />
originating from SRP & LRP.<br />
During plug rotation, these<br />
cables wrap around the LRP<br />
and get wound and unwound in<br />
cable guide grooves on the LRP.<br />
To prevent the cables from<br />
slackening and<br />
to keep them taut<br />
d u r i n g<br />
unwinding, the<br />
other ends of the<br />
cables are<br />
terminated in a<br />
cable tower,<br />
which houses a<br />
set of fixed guide<br />
pulleys at the bottom and a set<br />
of mobile pulleys at the top.<br />
Counter-weights fixed to the<br />
mobile pulleys keep the cables<br />
taut. The pulleys in the cable<br />
tower are in the east-west<br />
plane. Hence, the cables are<br />
routed from the LRP through a<br />
tortuous path, with two acute<br />
turns - one as they come out of<br />
the LRP and the other when they<br />
turn to the east towards the<br />
cable tower (see Fig.1).<br />
Due to the tortuous path with<br />
several turns, the cables were<br />
getting subjected to tensile and<br />
compressive stresses during the<br />
winding and unwinding cycles<br />
respectively. This cyclic loading<br />
was resulting in frequent failure<br />
of cores of cables during fuel<br />
handling. Most of the failures<br />
were taking place when the LRP<br />
positioning angle was between<br />
FAST BREEDER TEST REACTOR 9
IGC<br />
<strong>Annual</strong> <strong>Report</strong> 2007<br />
Fig.2 Modified cable routing<br />
160° & 180°. To minimise the<br />
failures, the plugs were rotated<br />
manually instead of through the<br />
six metre tall cable tower which<br />
was supported on floor support<br />
beams and anchored at two<br />
motor while crossing this points at top on Reactor<br />
region. Despite this, cable core<br />
failures were found to be very<br />
Containment Building wall. The<br />
tower is not accessible by<br />
frequent and this was crane. No vertical lifting of<br />
hampering fuel handling tower was possible due to<br />
operations, delaying the plant routing of a massive air<br />
schedule and warranting conditioning duct over the<br />
replacement of the cable when<br />
the spare cores are exhausted.<br />
tower without any clearance.<br />
The tower was supported on<br />
temporary structures and<br />
In order to address the above<br />
causes <strong>for</strong> cable failure, it was<br />
decided to modify the layout by<br />
rotating the cable tower by 90o<br />
so that the pulleys in the cable<br />
tower are in the north-south<br />
plane, and to route the cables<br />
directly from LRP to cable tower<br />
eliminating two sharp bends<br />
measures were taken to prevent<br />
its tilting during rotation. The<br />
tower could be rotated in-situ in<br />
a safe way and was anchored<br />
by modifying its supports. The<br />
cable trays were modified <strong>for</strong><br />
the new layout Fig.3. With this<br />
modification, the total length of<br />
the cable got reduced by 7 m<br />
(Fig.2). This required the and the total number of cable<br />
permanent removal of one of<br />
the two Fresh Fuel Transfer<br />
Chambers (FFTC), which was<br />
guide pulleys got reduced from<br />
156 to 76. The required pretension<br />
could be achieved with<br />
approved by the Station reduced counterweights of 110<br />
Operations Review Committee. kgf <strong>for</strong> indigenous cable and<br />
80 kgf <strong>for</strong> the imported cables<br />
The most difficult part of the<br />
modification was rotation of the<br />
as against the earlier values of<br />
162 & 120 kgf respectively.<br />
During plug rotation trials, the<br />
cable movement to and from<br />
the tower was observed to be<br />
very smooth and consistent,<br />
without slackening. The<br />
reduction in the pre-tension<br />
loads and elimination of the<br />
two sharp bends in the layout<br />
have cumulatively contributed<br />
to significant reduction in the<br />
cyclic stresses on the cable.<br />
Two fuel handling campaigns<br />
have been completed without<br />
any core failure. It is expected<br />
that this modification will<br />
significantly reduce cable core<br />
failures and minimise the<br />
replacement of trailing cables<br />
in future. The reactor<br />
availability will also get<br />
improved considerably.<br />
Fig.3 Trailing cable tower and<br />
cable routing after modification<br />
10 FAST BREEDER TEST REACTOR
Chapter -2<br />
PROTOTYPE FAST<br />
BREEDER REACTOR<br />
II.1. Construction Status of PFBR<br />
The Government of India had accorded administrative approval and<br />
financial sanction <strong>for</strong> construction of the 500 MWe Prototype Fast<br />
Breeder Reactor (PFBR) at Kalpakkam in September 2003. Bharatiya<br />
Nabhikiya Vidyut Nigam (BHAVINI) Limited a public sector company<br />
under DAE, is responsible <strong>for</strong> construction and operation of PFBR.<br />
<strong>IGCAR</strong> is responsible <strong>for</strong> design, associated R&D and manufacturing<br />
technology, and getting consent from regulatory bodies <strong>for</strong> construction<br />
of reactor. The <strong>for</strong>mation of task <strong>for</strong>ce with members drawn from<br />
<strong>IGCAR</strong> and BHAVINI has greatly helped in resolving the technical issues<br />
in manufacturing in a timely manner.
IGC<br />
<strong>Annual</strong> <strong>Report</strong> 2007<br />
The construction of PFBR has<br />
progressed very well (Fig.1-3).<br />
The manufacturing of safety<br />
vessel with thermal insulation,<br />
large diameter main sodium<br />
and argon tanks, and thermal<br />
baffles has been completed.<br />
Manufacturing of long delivery<br />
mechanical components of<br />
Nuclear Steam Supply System<br />
(NSSS), viz grid plate,<br />
shutdown mechanisms, core<br />
support structure, top shields,<br />
IHX, sodium pumps, steam<br />
generators, inclined fuel<br />
Fig.1 Overall view of the reactor site<br />
transfer machine and decay<br />
heat removal heat exchangers<br />
are in different stages of<br />
progress in Indian industries.<br />
Manufacturing of main vessel<br />
and inner vessel is in advanced<br />
stage at site assembly shop.<br />
Construction of 8 numbers of<br />
Nuclear Island Connected<br />
Buildings, diesel generator<br />
buildings, service building,<br />
service water pump house and<br />
ventilation stack is in progress<br />
at various elevations. The<br />
Fig.2 Reactor vessel<br />
Fig.3 Safety vessel<br />
contracts <strong>for</strong> construction of<br />
turbine building, sea-water<br />
intake structure and sea-water<br />
outfall channel have been<br />
awarded.<br />
Purchase orders have been<br />
placed <strong>for</strong> main plant<br />
turbo generator package,<br />
instrumentation and control<br />
package, 6.6 kV switchgear,<br />
diesel generators, switchyard<br />
and main cranes. Overall, the<br />
project is on schedule and the<br />
reactor is expected to be<br />
commissioned by September<br />
2010.<br />
II.2. Design and Development of<br />
Thermal Insulation <strong>for</strong> Safety Vessel<br />
In PFBR, which is a 500 MWe<br />
sodium cooled pool type<br />
reactor, all reactor internals<br />
including core and primary<br />
coolant (sodium) are contained<br />
in a single vessel called main<br />
vessel surrounded by safety<br />
vessel, which serves the<br />
purpose of containing sodium<br />
and ensuring minimum sodium<br />
level to facilitate core cooling<br />
in the unlikely event of leak in<br />
main vessel. The load from<br />
these vessels is transferred to<br />
concrete structure known as<br />
reactor vault. To limit the heat<br />
flux to reactor vault concrete<br />
and thereby ensuring the<br />
integrity of the same, stainless<br />
steel plate type thermal<br />
insulation which can withstand<br />
high gamma radiation is<br />
provided on outer surface of<br />
the safety vessel.<br />
Design<br />
Thermal insulation on safety<br />
12 PROTOTYPE FAST BREEDER REACTOR
IGC<br />
<strong>Annual</strong> <strong>Report</strong> 2007<br />
Fig.1 Thermal insulation arrangement<br />
over safety vessel<br />
vessel limits the heat transfer<br />
from safety vessel to the reactor<br />
vault concrete (Fig.1) in order<br />
to maintain the temperature of<br />
the concrete within the<br />
permissible design limit of 338<br />
K under normal operation.<br />
The SS plate type insulation is<br />
designed in the <strong>for</strong>m of panels,<br />
each measuring ~1m x 1m<br />
(Fig.2). Each panel consists of<br />
two slabs and interconnected<br />
through studs. In each slab, 17<br />
plates of 0.1mm thick mirror<br />
polished sheets are encased in<br />
a box of 1mm thick whose<br />
surfaces are also mirror<br />
polished. As the heat<br />
transferred through radiation<br />
Fig.2 Schematic view of a panel of<br />
SS plate typeinsulation<br />
mode depends on the surface<br />
emissivity (Fig.3), mirror polish<br />
has been specified <strong>for</strong> these<br />
sheets which give a surface<br />
emissivity of as low as 0.05.<br />
Multiple panels are secured all<br />
over the outer surface of safety<br />
vessel through studs welded on<br />
outer surface of safety vessel.<br />
The thickness of insulation<br />
panels and the number of<br />
insulation sheets in each panel<br />
are based on optimisation study<br />
carried out towards restricting<br />
the heat flux to reactor vault<br />
concrete. Based on the study<br />
with respect to the number of<br />
sheets, emissivity of sheets and<br />
thickness of panel, the number<br />
of sheets is selected to be 34<br />
with total thickness of panel to<br />
be 150mm.<br />
Development lessons<br />
As the polished sheets are<br />
very thin and flimsy,<br />
maintaining the spacing<br />
between them was a crucial<br />
task. A gap of 4.26 mm was<br />
specified in the design and<br />
dimples were provided to<br />
achieve the required spacing.<br />
As the initial trials with 100 mm<br />
dimple spacing did not yield<br />
desired results, the same was<br />
optimised to 50 mm with which<br />
the desired results were<br />
obtained.<br />
During the course of trials,<br />
another major challenge was<br />
faced in the <strong>for</strong>ming of dimples.<br />
Initial dimpling trials with the<br />
imported material of higher<br />
hardness was giving good finish<br />
but tearing occurred at<br />
dimples. To overcome this<br />
problem, the dimple radius and<br />
fillet radius between the dimple<br />
and the sheet was increased.<br />
Further trials with these<br />
changes improved the dimple<br />
<strong>for</strong>ming and problem of dimple<br />
cracking was resolved.<br />
The other challenge was with<br />
respect to stacking of the sheets<br />
one over the other. Due to self<br />
weight as well weight of sheets<br />
supported over it, total height<br />
of the stack was not achieved.<br />
Towards this, a novel spacing<br />
arrangement with multiple<br />
spacers was designed and<br />
incorporated (Fig.4).<br />
Validation<br />
As direct correlation between<br />
surface roughness and the<br />
emissivity could not be found in<br />
literature, experiments were<br />
Fig.3 Thermal conductivity of<br />
insulation panel as a function of<br />
temperature and emissivity of the<br />
sheets<br />
PROTOTYPE FAST BREEDER REACTOR 13
IGC<br />
<strong>Annual</strong> <strong>Report</strong> 2007<br />
insulation panels and the<br />
results have rein<strong>for</strong>ced the<br />
theoretically calculated values<br />
enhancing the confidence in<br />
design.<br />
Fig.4 One typical panel with sheet<br />
spacing arrangement<br />
carried out to evaluate the<br />
emissivity of the plates polished<br />
and the same has indicated that<br />
the mean emissivity to be 0.047<br />
against the design value of<br />
0.05 (Fig.5).<br />
Further, experiments were<br />
carried out in an experimental<br />
set-up, at <strong>IGCAR</strong>, to assess the<br />
heat transferred through the<br />
Fixing of panels over safety<br />
vessel was under taken and the<br />
same has been successfully<br />
carried out (Fig.6).<br />
The safety vessel thermal<br />
insulation panels have been<br />
fabricated as per the technical<br />
Fig.5 Results of emissivity<br />
measurements <strong>for</strong> the polished<br />
sheets<br />
Fig.6 View of safety vessel with<br />
thermal insulation<br />
specification meeting all the<br />
design intents. Experiments<br />
conducted to measure<br />
emissivity and heat transfer<br />
have rein<strong>for</strong>ced the design<br />
calculations. Fixing of panels<br />
over safety vessel has been<br />
successfully carried out<br />
concluding the successful<br />
design, development and<br />
manufacture of thermal<br />
insulation panels <strong>for</strong> FBR <strong>for</strong> the<br />
first time within the country.<br />
II.3. Thermal Hydraulic Design of<br />
PFBR Reactor Vault Cooling System<br />
In PFBR, the main vessel<br />
houses the entire primary circuit<br />
including primary sodium and<br />
core. It is supported over a<br />
huge cylindrical concrete<br />
Reactor Vault (RV) as shown in<br />
Fig. 1. The safety vessel<br />
surrounding the main vessel is<br />
also supported on RV. During<br />
normal operation, the<br />
temperature of main and safety<br />
vessels is ~ 693K. During<br />
decay heat removal (DHR)<br />
conditions, this temperature<br />
increases to ~848K. Due to<br />
these high operating<br />
temperatures of the vessels, RV<br />
gets heated. From design<br />
considerations, the temperature<br />
of RV has to be less than 338K<br />
during normal operation and<br />
less than 363K during DHR<br />
condition. To achieve these<br />
temperature limits, RV is cooled<br />
by DM water by a dedicated<br />
cooling system. Square section<br />
cooling pipes are chosen <strong>for</strong><br />
this purpose, which are welded<br />
to the RV liner. The cooling<br />
tubes are segregated into two<br />
loops with alternate pipes<br />
connected to one loop. This<br />
ensures that in case of leakage<br />
in any one of the loops, the<br />
other loop is available. At the<br />
design stage, it was assumed<br />
14 PROTOTYPE FAST BREEDER REACTOR
IGC<br />
<strong>Annual</strong> <strong>Report</strong> 2007<br />
Fig.1 Schematic of the RV cooling system<br />
emerges out of the insulation.<br />
To mitigate this hot spot, it was<br />
essential to increase the<br />
circumferential conductance in<br />
the RV liner. This is achieved by<br />
interconnecting the cooling<br />
pipes by 10 mm thick carbon<br />
steel plates <strong>for</strong> a height of 1.2<br />
m, as shown in Fig. 1. Also, the<br />
water flow rate has to be<br />
doubled <strong>for</strong> the lower lateral<br />
shield region of RV. The number<br />
of cooling tubes and the water<br />
flow rate in the additional<br />
cooling loop of SVSE have been<br />
determined to be 288 and 60<br />
m 3 /h respectively. The<br />
temperature distribution in RV<br />
with these modifications is<br />
depicted in Fig. 2.<br />
Fig.2 Temperature distribution in reactor vault around SVSE embedment during<br />
normal and SGDHR conditions<br />
that the cooling pipes are<br />
welded to the liner (through<br />
out) the length. But, near the<br />
safety vessel support<br />
embedment, the cooling pipes<br />
cannot penetrate the support<br />
flanges. Hence, a part of<br />
concrete trapped inside the<br />
flanges remains un-cooled.<br />
Further, from the point of view<br />
of avoiding use of sharp bends<br />
in the pipes, the cooling pipes<br />
have to be re-routed during<br />
construction. The effects of<br />
these changes on the concrete<br />
temperature around the safety<br />
vessel support embedment<br />
(SVSE) have been assessed by a<br />
comprehensive Computational<br />
Fluid Dynamic (CFD) analysis<br />
and suitable design provisions<br />
have been identified and<br />
implemented at the<br />
construction site.<br />
As a part of the analysis,<br />
many parametric studies (12<br />
configurations) have been<br />
carried out and the need of<br />
additional cooling loop in the<br />
SVSE zone is identified. Also, it<br />
is seen that there is a local<br />
hotspot in RV where the conical<br />
support of the safety vessel<br />
From limitations in space<br />
around SVSE, the number of<br />
headers that can be connected<br />
to the SVSE cooling loop and<br />
the size of headers are to be as<br />
minimum as possible. However,<br />
from heat removal<br />
considerations, the flow rate<br />
that is required to be sent<br />
through each and every cooling<br />
pipe should be more than a<br />
Fig.3 Header with "end-in & end-out"<br />
configuration <strong>for</strong> SVSE cooling<br />
PROTOTYPE FAST BREEDER REACTOR 15
IGC<br />
<strong>Annual</strong> <strong>Report</strong> 2007<br />
minimum value. Detailed 3-D<br />
hydraulic investigations have<br />
been carried out to arrive at a<br />
compact layout <strong>for</strong> the supply<br />
and discharge headers of the<br />
SVSE cooling circuit satisfying<br />
the design and layout<br />
requirements. With the<br />
acceptable number of headers<br />
(4) and header size (40 NB),<br />
there are 36 tubes connected<br />
to each header. The flow<br />
distribution was highly nonuni<strong>for</strong>m<br />
in the "end-in & endout"<br />
configuration. In the<br />
"central-in & central-out"<br />
configuration, with orifices in<br />
the tubes and 20 % extra flow<br />
in the circuit, the required flow<br />
could be achieved with<br />
minimum pressure drop in the<br />
system. The "end-in & end-out"<br />
header configuration and the<br />
flow distribution in the modified<br />
configuration are depicted in<br />
Fig. 3 and 4 respectively.<br />
Fig. 4 Flow distribution in the SVSE<br />
cooling loop<br />
II.4. Structural Integrity of Grid Plate under Accidental Fall<br />
of Subassembly with Transfer Arm<br />
PFBR core consists of 1758<br />
subassembiles (SAs) including<br />
181 fuel subassemblies (FSA),<br />
120 blanket subassemblies<br />
(BSA), 9 control subassemblies<br />
(CSA), 156 storage<br />
subassemblies (SSA) and the<br />
remaining<br />
shielding<br />
subsassemblies. Each SA has a<br />
circular foot at the bottom, that<br />
is inserted in to the respective<br />
sleeve and thus the core SAs<br />
are free standing on the grid<br />
plate, behaving like a cantilever<br />
beam. Grid plate(GP), apart<br />
from supporting the SAs, acts<br />
as a plenum to distribute the<br />
required amount of sodium<br />
coolant to the SAs. Thus, the<br />
grid plate does the important<br />
safety function in the reactor<br />
and hence, it is designed<br />
respecting the RCC-MR class 1<br />
component rules. As per the<br />
design criteria, the structural<br />
integrity is ensured under all the<br />
operating conditions including<br />
postulated accident scenarios.<br />
Analysis had been carried out<br />
to demonstrate the structural<br />
integrity of grid plate under<br />
impact <strong>for</strong>ce developed due to<br />
the free fall of a single SA<br />
along with gripper of transfer<br />
arm (TA), during the handling<br />
operation.<br />
Impact scenario<br />
Within the reactor assembly, the<br />
SAs are handled by transfer arm<br />
(TA) <strong>for</strong> the three major<br />
operations: (1) introduction of<br />
fresh SA in to the respective<br />
location in grid plate after<br />
removing from the transfer pot<br />
(TP), (2) transfer of spent fuel<br />
Fig.1 Schematic of gripper<br />
assembly and SA<br />
16 PROTOTYPE FAST BREEDER REACTOR
IGC<br />
<strong>Annual</strong> <strong>Report</strong> 2007<br />
Fig.2 Finite element mesh of structure<br />
SA to the respective storage<br />
locations in the grid plate and<br />
(3) transfer the spent fuel SA<br />
from the storage locations to<br />
the TP. For carrying out these<br />
operations, the guide tube of<br />
TA is lowered by 4.5 m within<br />
which the gripper assembly is<br />
guided vertically either during<br />
lifting the SA or during<br />
introduction of the SA. In each<br />
operation, the gripper assembly<br />
is translated to the maximum<br />
distance of about 4.5 m in the<br />
vertical direction to cover the<br />
entire SA, during the withdrawal<br />
of say, spent fuel SA from the<br />
GP. In the subsequent operation<br />
to introduce the same in to the<br />
respective storage location in<br />
the grid plate, the gripper<br />
assembly along with the SA, is<br />
lowered. The raising / lowering<br />
operations of gripper assembly<br />
is executed carefully through<br />
double wire rope system with<br />
safety brakes, to rule out any<br />
possibility of a high impact of<br />
gripper assembly along with the<br />
SA on the grid plate. With the<br />
presence of safety brakes at<br />
very 200 mm distance, a<br />
maximum free fall of 200 mm is<br />
only possible, in case of failure<br />
of wire ropes. Fig.1 shows the<br />
schematic sketch of the gripper<br />
assembly and SA during a<br />
typical handling operation.<br />
The impact scenario is defined<br />
as: 'the free fall of gripper<br />
assembly along with SA on the<br />
grid plate over the distance of<br />
200 mm during the last stage<br />
of accidental drop due to the<br />
failure of wire rope'. The total<br />
mass of the gripper assembly<br />
(700 kg) and SA (250 kg) is<br />
950 kg. Thus the kinetic energy<br />
that is transmitted to GP at the<br />
respective sleeve location is<br />
950 x g (10m/s 2 )x 0.2 = 19 00<br />
J. The maximum damage to the<br />
GP is expected when the impact<br />
occurs at the central sleeve<br />
location. Accordingly, an<br />
impact with the energy potential<br />
of 1900 J is postulated at the<br />
central location of grid plate<br />
and analysed <strong>for</strong> checking the<br />
structural integrity of grid plate.<br />
Finite element modelling<br />
The core is supported on the<br />
GP and GP is supported on the<br />
Core Support Structure (CSS).<br />
The CSS is attached with the<br />
main vessel bottom at the triple<br />
point. Accordingly, the finite<br />
models are generated <strong>for</strong> core<br />
SAs, GP and CSS. SAs and<br />
sleeves in the GP are modeled<br />
with beam elements and plates<br />
Fig.3 A few typical vibration modes, relevant to impact analysis of GP<br />
PROTOTYPE FAST BREEDER REACTOR 17
IGC<br />
<strong>Annual</strong> <strong>Report</strong> 2007<br />
Fig.4 Peak de<strong>for</strong>mations of grid plate<br />
and stiffeners, top and bottom<br />
plates and intermediate shells<br />
of GP and CSS are modeled<br />
with plate / shell elements. The<br />
finite element mesh generated<br />
with CAST3M code, issued by<br />
CEA France is shown in Fig.2.<br />
Free vibration analysis<br />
Natural frequencies and<br />
mode shapes should be known<br />
to simulate the de<strong>for</strong>mations<br />
correctly in the subsequent<br />
impact analysis, which are<br />
determined by free vibration<br />
analysis. For this CAST3m, is<br />
used. A few important mode<br />
shapes are depicted in Fig.3.<br />
Since, upon impact, the nature<br />
of de<strong>for</strong>mation is bending of<br />
top plate, the mode depicting<br />
the bowing of top plate that<br />
occurs at 20 Hz, is the critical<br />
mode as far as impact is<br />
concerned.<br />
Impact analysis<br />
With the understanding of<br />
natural vibration behaviour and<br />
energy balance, the duration<br />
of impact and subsequently,<br />
peak <strong>for</strong>ce are defined as a<br />
triangular pulse in a classical<br />
way as follows:<br />
Velocity at time of impact<br />
vmax<br />
= √2.g.h<br />
= 2 m/s<br />
Impulse at time of impact (mv)<br />
= 1900 N-s<br />
The duration of impulse (t)<br />
= 0.025 s<br />
Peak <strong>for</strong>ce (Fmax)<br />
= 76 k N<br />
Dynamic analysis of grid plate<br />
along with core and core<br />
support structure was carried<br />
out using CAST3M code and<br />
peak de<strong>for</strong>mations and stresses<br />
are extracted. Fig.4 shows the<br />
de<strong>for</strong>mation patters at a critical<br />
instant and peak value is found<br />
to be ~ 0.1 mm and the<br />
associated Von Mises stress is<br />
found to be 20 MPa, which is<br />
local in nature. These values<br />
are found to be insignificant<br />
from the structural integrity<br />
considerations.<br />
II.5. Hardfacing of Bottom Plate of Grid Plate Assembly<br />
Grid plate of PFBR is a<br />
massive structure consisting of<br />
a two plates (top and bottom of<br />
~6.5m in diameter and large<br />
number of sleeves in which foot<br />
of the sub assemblies rest. This<br />
support structure also acts as<br />
boundary between cold and hot<br />
sodium in the reactors. Both the<br />
grid plate assembly and the<br />
core support structure are<br />
made of 316LN stainless steel<br />
and immersed in flowing<br />
sodium. Hence, there should<br />
not be any self welding between<br />
these components at their<br />
contact location. Hardfacing<br />
using Ni base hardfacing alloy<br />
(AWS Ni-Cr-B alloy) is<br />
proposed on two annular<br />
grooves machined on the<br />
bottom plate of the grid plate.<br />
These grooves are located<br />
towards the periphery of the<br />
grid plate and hence, diameters<br />
of these grroves are close to<br />
that of the grid plate itself and<br />
total length (circumference) of<br />
single harfaced deposit was<br />
close to 21 m. The component<br />
is designed in such a way that<br />
area of contact between grid<br />
plate and the core support<br />
structure is confined to these<br />
hardfaced grooves in the<br />
bottom plate.<br />
As the Ni base hardfacing<br />
alloys are highly prone to<br />
18 PROTOTYPE FAST BREEDER REACTOR
IGC<br />
<strong>Annual</strong> <strong>Report</strong> 2007<br />
Fig.1 Grid plate mounted on<br />
the furnace<br />
cracking, hardfacing such a<br />
massive component was not<br />
very easy. The process chosen<br />
<strong>for</strong> deposition is plasma<br />
transferred arc welding (PTAW)<br />
which uses hardfacing alloy<br />
powder as the consumable.<br />
During<br />
technology<br />
development of the grid plate<br />
(using plates of the similar<br />
dimensions as that of the actual<br />
PFBR grid plate), extensive<br />
cracking of the deposit was<br />
observed when deposition was<br />
carried out as per the<br />
procedure finalized initially<br />
based on trials carried out on<br />
80 mm thick 1000 mm<br />
diameter plate. Subsequently a<br />
detailed review of the design of<br />
the groove, welding process,<br />
procedure, heat treatment etc.<br />
was taken up in which<br />
designers, materials engineers,<br />
hardfacing agency and<br />
manufacturer of the grid plate<br />
participated. The groove width<br />
was reduced from 45 to 20 mm<br />
and the groove angle increased<br />
from 30 to 60 . This enabled to<br />
carry out hardfacing in single<br />
layer and single pass of<br />
deposition.<br />
Preheat<br />
temperature <strong>for</strong> deposition<br />
increased from 773 to 923 K<br />
and furnace <strong>for</strong> preheating and<br />
stress relieving heat treatment<br />
was modified to ensure that the<br />
temperature variation across<br />
the component during heating<br />
or cooling is reduced<br />
considerably. Insulation was<br />
improved to reduce the heat<br />
losses. It was also decided to<br />
carry out hardfacing<br />
continuously using four PTAW<br />
machines position on a circular<br />
track which is placed concentric<br />
to the bottom plate. Machine<br />
controls were suitably modified<br />
to have smooth deposition<br />
between starting and ending<br />
location of the deposits, which<br />
are found to be more prone to<br />
cracking than the other location<br />
so the deposit. New trials were<br />
taken up during technology<br />
development <strong>for</strong> hardfacing of<br />
the grid plate and cracking of<br />
the deposits reduced<br />
considerably in these attempts.<br />
The process was further refined<br />
and it was demonstrated on the<br />
grid plate <strong>for</strong> technology<br />
development that crack free<br />
deposits that meet all the<br />
design requirement could be<br />
made using this improved<br />
procedure.<br />
After<br />
successfully<br />
demonstrating the procedure<br />
on the technology development<br />
grid plate, hardfacing of PFBR<br />
grid plate was taken up.<br />
Because of prior experience, it<br />
was possible to achieve much<br />
better control over temperature<br />
during heating and the heat<br />
treatment stages. Deposition<br />
was carried out simultaneously<br />
using four PTAW machines<br />
mounted on the track at 90<br />
apart. After bottom plate<br />
reached preheat temperature<br />
the entire operation of<br />
hardfacing two grooves of<br />
~6.5 m dia took only a few<br />
hours. Fig. 1 shows the grid<br />
plate mounted on the furnace<br />
with hardfacing operation in<br />
progress. Fig. 2 shows a close<br />
up of the deposit and the torch.<br />
Neither cracks, nor debonding<br />
nor surface porosities were<br />
observed on the deposits. There<br />
was no need to carry out any<br />
repair though a procedure <strong>for</strong><br />
repair had been finalized. The<br />
deposits made on the PFBR grid<br />
plate are certainly better than<br />
deposits made during<br />
technology development. This<br />
was possible only because of<br />
the dedicated ef<strong>for</strong>ts of<br />
designer, engineers, hardfacing<br />
agency and the manufacturer<br />
of the components.<br />
Fig.2 Close-up a PTA torch and<br />
hardfaced deposit as hardfacing<br />
is in progress<br />
PROTOTYPE FAST BREEDER REACTOR 19
IGC<br />
<strong>Annual</strong> <strong>Report</strong> 2007<br />
II.6. Acceptable End Plug Weld Repairs <strong>for</strong><br />
PFBR Fuel Pins<br />
In PFBR, heat is generated<br />
mainly in 181 fuel<br />
subassemblies. Each fuel<br />
subassembly has 217 fuel pins<br />
which contain MOX fuel. The<br />
manufacturing of fuel pins is<br />
the most challenging activity, in<br />
particular, the welding of end<br />
plug after inserting the fuel<br />
pellets and other structural<br />
elements within the clad. Some<br />
repair welds are unavoidable.<br />
Strategy of rejection of pins<br />
with repaired welds should be<br />
adopted carefully to maximize<br />
recovery during manufacture.<br />
The fuel pin is made of 20%<br />
cold worked D9 material (15 %<br />
Cr-15 % Ni - Ti alloy) and end<br />
plug is made of SS 316 LN. A<br />
schematic of a typical weld<br />
configuration is shown in Fig.1<br />
along with dimensions. The<br />
temperature in the region of the<br />
end plug is decided by the core<br />
outlet temperature (833 K)<br />
under steady state operation<br />
and the maximum fission gas<br />
pressure accumulated at the<br />
end of 100 GWd/t burnup can<br />
be 6 MPa. Under this<br />
environment, the thermal creep<br />
damage is the main governing<br />
failure mode <strong>for</strong> this weld.<br />
Since, there is no established<br />
analysis tools available to<br />
qualify the repair welds,<br />
experimental route is followed<br />
to recommend the acceptable<br />
number of weld repairs <strong>for</strong> the<br />
end plug.<br />
Experimental methodology<br />
Fuel pin end plug welds <strong>for</strong><br />
PFBR are carried out at<br />
Advance Fuel Fabrication<br />
Facility (AFFF), Tarapur. A few<br />
numbers of welds with no<br />
repair, 3 repairs and 4 repairs<br />
were selected from the<br />
production samples <strong>for</strong> the test<br />
purpose. A dedicated test setup<br />
has been made at Structural<br />
Mechanics Laboratory in which<br />
a set of 6 tubes can be tested<br />
simultaneously. The fuel pins<br />
with end plug welds were<br />
tested at 973 K to accelerate<br />
the damage under an internal<br />
pressure of 20 MPa to account<br />
<strong>for</strong> possible higher burnup<br />
targets as well as uncertainties<br />
in the fission gas release<br />
phenomenon. The test setup is<br />
shown in Fig.2. The<br />
application of correct pressure<br />
is ensured, by measuring the<br />
hoop and longitudinal strains in<br />
the vicinity of end plug welds<br />
<strong>for</strong> a few typical pins. Fig.3<br />
shows the measured strain <strong>for</strong><br />
various pressures. The pins are<br />
subjected to simulated pressure<br />
and temperature conditions in<br />
Fig.1 Geometrical details of<br />
end plug weld<br />
Fig.2 Test setup <strong>for</strong> simulating creep<br />
damage in FBR fuel pins<br />
20 PROTOTYPE FAST BREEDER REACTOR
IGC<br />
<strong>Annual</strong> <strong>Report</strong> 2007<br />
Fig.3 Measured strains vs fission gas pressure<br />
weld is derived from the<br />
definition of creep damage by<br />
time fraction rule: W = t / t r ;<br />
where t is actual duration of<br />
operation (2 y) and t r is the<br />
minimum time to rupture under<br />
the imposed stress and<br />
temperature. Accordingly, t r ,<br />
the minimum rupture life to be<br />
ensured and demonstrated by<br />
tests under similar conditions is<br />
2 / 0.025, equal to 80 y.<br />
Fig.4 Bulging of pins at the time of development of cracks<br />
the furnace, and the leak is<br />
monitored continuously. A leak<br />
Basis of accelerated tests<br />
The life of fuel pin in the<br />
in the pin is the indication reactor is 2 y. The permissible<br />
of failure, that is detected by cumulative creep damage<br />
a fall in the steady state under maximum fission gas<br />
pressure in the chamber. pressure (12 MPa) at a<br />
Fig.4 depicts a set of six typical<br />
leaked pins showing bulging at<br />
the time of crack detection.<br />
Totally 12 pins were tested: 2<br />
pins without repair, 5 pins with<br />
3 repairs and 5 pins with 4<br />
repair. The observed cracks<br />
were investigated thoroughly by<br />
temperature of 833 K is 0.25.<br />
Under actual environment with<br />
the presence of fuel and fission<br />
gas, it is reported that creep<br />
damage is accelerated, which<br />
is accounted by a factor called<br />
'fuel adjacency factor'. The<br />
pessimistic value reported <strong>for</strong><br />
image processing analysis. this effect is 10. This implies<br />
Fig.5 shows that the crack is<br />
longitudinal in nature, than can<br />
be caused by the hoop stress<br />
and is observed just below the<br />
weld joint.<br />
that allowable creep damage<br />
without considering the fuel<br />
adjacency effect (W) should be<br />
limited to 0.025. Minimum<br />
rupture life required <strong>for</strong> the<br />
To accelerate the creep<br />
damage, a higher temperature<br />
of 973 K is chosen as an<br />
optimum parameter to<br />
complete the tests within a<br />
reasonable shorter time,<br />
without affecting the creep<br />
damage mechanism to be<br />
simulated. Under this higher<br />
temperature, the minimum<br />
rupture time to be ensured is<br />
calculated by the application of<br />
Larson-Miller Parameter (LMP),<br />
defined as: Tx(20+log t r ),<br />
which is considered to be<br />
constant under same stress. For<br />
the required life of pins 80 y<br />
which gives the value of t r = 80<br />
x 365 x 24 = 700800 h and T<br />
= 833, the LMP is<br />
833x(20+log 700800) =<br />
21.529. For the accelerated<br />
temperature of 973 K, the<br />
minimum rupture life should be<br />
21.529/(973x(20 +log t r )),<br />
which is equal to 134 h (~5.6<br />
d). The minimum rupture time<br />
to be ensured is 5.6 d. With<br />
this target, tests are conducted.<br />
PROTOTYPE FAST BREEDER REACTOR 21
IGC<br />
<strong>Annual</strong> <strong>Report</strong> 2007<br />
Table 1 : Measured rupture lives of end plug welds with and without weld repairs (days)<br />
Test results<br />
The rupture lives measured<br />
<strong>for</strong> the various test cases are<br />
given in Table-1 and same have<br />
been depicted in Fig.6, which<br />
indicated that, the minimum<br />
rupture time required (5.6 d)<br />
are ensured even <strong>for</strong> the welds<br />
with 4 repairs.<br />
In view of a limited number of<br />
tests that have been completed,<br />
it is recommended to restrict<br />
the weld repair to 2 at this<br />
stage of manufacturing.<br />
However, tests are being<br />
continued to get more<br />
confidence in accepting 3 or 4<br />
repair welds.<br />
Fig.5 Longitudinal cracks seen in the<br />
fuel pins at the welding zone<br />
Fig.6 Measured rupture lives of pins tested<br />
II.7. Qualification of Back up Seals<br />
To seal the annular gap between rotating and<br />
stationary parts of the rotatable plug support<br />
arrangement, elastomeric seals are provided.<br />
This comprises of two numbers of inflatable seals<br />
and one back-up seal. During reactor operation,<br />
the annular gap is sealed by one of the inflatable<br />
seals along with a back-up seal. Be<strong>for</strong>e starting<br />
plug rotation, the second inflatable seal is<br />
inflated and the back-up seal is disengaged and<br />
kept in raised condition.<br />
The back-up seal is a static seal with sealing<br />
achieved by the compression of the seal. A<br />
trapezoidal shape seal has been selected and to<br />
reduce the compression load required to seal the<br />
surfaces, special geometrical features are<br />
included. The seal is fixed to a seal holder and to<br />
apply required compression load uni<strong>for</strong>mly over<br />
the seal surface, load applying arrangement is<br />
provided. The seal bridges two annular surfaces<br />
at the top, one rotating and the other stationary.<br />
22 PROTOTYPE FAST BREEDER REACTOR
IGC<br />
<strong>Annual</strong> <strong>Report</strong> 2007<br />
As the diameter of the sealing<br />
surfaces is very large, mismatch<br />
in the elevation of the two<br />
sealing surfaces is expected<br />
and also there can be wide<br />
variation in the flatness of the<br />
two surfaces. This mismatch<br />
between the elevation of<br />
Fig.2 Details of the seal geometry<br />
Fig.3 Seal holder with seal<br />
Fig.1 Details of backup seal test facility<br />
surfaces has been considered<br />
in the design. To validate the<br />
design, it was decided to test a<br />
sample prototype seal.<br />
Fig.1 gives the details of the<br />
seal test rig and Fig.2 gives the<br />
details of the seal geometry.<br />
The rig consists of two test<br />
plates 1 & 2, machined with<br />
outer and inner sealing<br />
surfaces, respectively. Eight<br />
number of support brackets are<br />
bolted in a uni<strong>for</strong>m spacing<br />
along the circumference of the<br />
sealing surfaces to mount the<br />
clamping mechanisms. It<br />
consists of a trapezoidal<br />
threaded loading shaft, thrust<br />
bearing to reduce the torque<br />
while applying required load,<br />
and compression type load cell<br />
to measure the load applied,<br />
Belleville washers to avoid<br />
sudden relaxation of the load<br />
under small displacement of the<br />
mechanism due to vibrations.<br />
Fig.3 gives photographic<br />
illustration of the seal holder<br />
with seal. Test sample of one<br />
meter diameter with 1:1 cross<br />
section as per reactor seal has<br />
been chosen <strong>for</strong> the testing.<br />
Considering symmetric loading<br />
and a clamping pitch nearer to<br />
actual condition, eight numbers<br />
of clamping points are<br />
selected.<br />
The effectiveness of sealing<br />
(allowed leakrate ≤ 0.001 cc/s)<br />
per meter length of seal was<br />
checked <strong>for</strong> clamping loads of<br />
500N, 1000N and 1400N per<br />
each clamping point. Leak rate<br />
measurements done <strong>for</strong> an inter<br />
seal pressure of 250mbar with<br />
level differences upto 2 mm<br />
showed the leak-tightness of<br />
the seal to be less<br />
than 10 -3 stdcc/s. Hence<br />
the per<strong>for</strong>mance of the seal<br />
has been demonstrated<br />
successfully.<br />
PROTOTYPE FAST BREEDER REACTOR 23
Chapter -3<br />
R&D FOR FBRs<br />
III.A. Modeling and Simulation Experiments<br />
III.A.1. Effects of Interconnection of Reactor Vault with Nuclear Island<br />
Connected Buildings on Seismic Behaviour of an FBR<br />
In a pool type sodium cooled fast breeder reactor, the entire radioactive primary circuit is<br />
housed in a single vessel called main vessel, which is the most critical component of the<br />
reactor assembly system. The main vessel transmits about 2500 t to the top shield,<br />
contributed by core mass, self weights of main vessel and reactor internals and 1150 t of<br />
primary sodium. The weight of top shield along with the components supported by it is about<br />
1200 t. With all these, the reactor assembly weighing about 3700 t is supported at the top.<br />
The dynamic <strong>for</strong>ces that are developed by a seismic event cause a great concern to structural<br />
integrity of thin shell structures, core subassemblies, etc.
IGC<br />
<strong>Annual</strong> <strong>Report</strong> 2007<br />
Fig.1 PFBR plant layout of NICB<br />
The magnitudes of<br />
displacements and stresses<br />
developed in the structural<br />
systems depend strongly on the<br />
seismic support excitations,<br />
more precisely the floor<br />
response spectra at the support<br />
points (FRS). The dynamic<br />
characteristics of primary<br />
systems, mainly civil structures,<br />
decide the FRS. Adopting the<br />
concept of connected buildings<br />
is one of the means of<br />
mitigating<br />
seismic<br />
amplifications. Accordingly,<br />
the main buildings of nuclear<br />
island viz. reactor containment<br />
building (RCB), steam<br />
generator buildings, fuel<br />
building, control building,<br />
electrical buildings and<br />
radwaste building are<br />
connected carefully giving due<br />
considerations to safety,<br />
economy, operation and<br />
maintenance aspects. RCB<br />
houses the reactor vault which<br />
supports the reactor assembly<br />
and this apart, it contains many<br />
cells at various levels. In the<br />
connected building layout<br />
concept, the connection of<br />
reactor vault with the adjacent<br />
buildings has to be seen<br />
critically. By way of connecting<br />
the reactor vault with the<br />
adjacent cells within RCB, the<br />
reactor vault along with the<br />
reactor assembly gets<br />
connected automatically to the<br />
entire nuclear island connected<br />
buildings (NICB). NICB layout<br />
is shown in Fig.1. With this<br />
connection, the adjacent cells<br />
get support from reactor vault<br />
without calling <strong>for</strong> additional<br />
structures which helps in<br />
achieving further economy.<br />
However, the adjacent<br />
buildings can influence the<br />
seismic responses of reactor<br />
assembly components<br />
significantly.<br />
In this article, the seismic<br />
responses of reactor assembly<br />
components are quantified<br />
under the two assumptions: (1)<br />
the reactor vault is connected<br />
to the adjacent buildings of<br />
NICB through floor slabs at<br />
three levels as in PFBR (Fig.2a)<br />
and (2) the reactor vault along<br />
with reactor assembly is an<br />
isolated structural system<br />
constructed from base raft<br />
without any connection with the<br />
adjacent buildings within NICB<br />
(Fig.2b). The analysis was<br />
carried out using CAST3M, a<br />
computer code issued by CEA<br />
France.<br />
Effects on connected and<br />
isolated reactor vault<br />
The floor response spectra<br />
(FRS) generated at the reactor<br />
assembly support with and<br />
without connection are<br />
2(a) Connected<br />
2(b) Inter-connected<br />
Fig.2 Reactor assembly mounted on connected and inter-connected reactor vault<br />
R&D FOR FBRs 25
IGC<br />
<strong>Annual</strong> <strong>Report</strong> 2007<br />
depicted in Fig.3. The FRS <strong>for</strong><br />
isolated reactor vault shows<br />
only two dominant peaks<br />
representing the swaying mode<br />
of main vessel (5.1 Hz) and<br />
reactor vault (14.2 Hz). Once<br />
the reactor vault is connected<br />
with the NICB, reactor vault is<br />
mastered by various buildings<br />
in the NICB, due to which the<br />
vault has many coupled<br />
vibration modes. This imposes<br />
many constraints to ensure that<br />
the natural frequencies of<br />
reactor internal are not lying in<br />
the resonance ranges. The<br />
significant effect is the<br />
influence of fundamental<br />
frequency of about 3 Hz which<br />
corresponds to the swaying<br />
mode of the buildings as seen<br />
in Fig.3. In view of the natural<br />
frequencies of core & control<br />
subassemblies and absorber<br />
rod drive mechanisms lying<br />
around 3 Hz, the dynamic<br />
Table 1 : Displacements of absorber rods and control plug<br />
Table 2 : Primary stress intensities<br />
Table 3 : Strain energy generated in the vessels<br />
amplifications become number of analysis / tests<br />
significant and critical from required <strong>for</strong> the seismic<br />
reactor shutdown point of view. qualification studies.<br />
Further, while the FRS are<br />
nearly the same in the X and Y Apart from FRS, other<br />
excitations in the case of<br />
isolated reactor vault, they are<br />
quite different in the X and Y<br />
important effects are presented<br />
in Table 1, Table 2 and Table-<br />
3, from which it is clear that<br />
directions in the case of there are increases of: (1)<br />
connected vault. This increases radial and axial displacements<br />
15<br />
15<br />
X direction<br />
Y direction<br />
Acceleration - m/s 2<br />
12<br />
9<br />
6<br />
connected<br />
isolated<br />
Acceleration - m/s 2<br />
12<br />
9<br />
6<br />
connected<br />
isolated<br />
3<br />
3<br />
0<br />
0 10 20 30<br />
0<br />
0 10 20 30<br />
Frequency - Hz<br />
Frequency - Hz<br />
Fig.3 Floor response spectra at reactor assembly support <strong>for</strong> safe shutdown earthquake<br />
26 R&D FOR FBRs
IGC<br />
<strong>Annual</strong> <strong>Report</strong> 2007<br />
of core top and absorber rods<br />
and vertical accelerations of<br />
core subassemblies which are<br />
of concern to reactor safety<br />
(Table 1), (2) primary<br />
membrane stress intensities <strong>for</strong><br />
the main vessel and inner<br />
vessel (Table 2) and (3)<br />
generation of high strain<br />
energies at the critical portions<br />
which can enhance the<br />
buckling risks of main<br />
vessel and inner vessel<br />
(Table 3).<br />
In view of increased<br />
displacements, stresses and<br />
strain energies at critical<br />
locations when the reactor vault<br />
is connected with the<br />
remaining structures of NICB,<br />
it is preferable to isolate the<br />
reactor vault, by directly<br />
constructing it from the base<br />
raft without inter-connecting it<br />
with the adjacent buildings of<br />
NICB, from the seismic loading<br />
considerations. This also<br />
provides some flexibility to<br />
design and analyse the reactor<br />
assembly components<br />
independently without linking to<br />
the finalisation of design of rest<br />
of the civil structures. This can<br />
be adopted <strong>for</strong> future FBRs.<br />
III.A.2. Modal Analysis of PFBR Fuel Subassembly<br />
PFBR Fuel subassembly (FSA)<br />
consists of 217 fuel pins held<br />
vertically in the <strong>for</strong>m of a<br />
bundle within a hexagonal<br />
wrapper tube. Flow induced<br />
vibrations (FIV) in FSA is a<br />
potential cause <strong>for</strong> fatigue,<br />
wear and vibration induced<br />
fretting in the subassembly<br />
parts which can lead to<br />
reactivity noise and premature<br />
failure of fuel pins and other SA<br />
parts. The coolant flow in SA is<br />
in highly turbulent regime and<br />
it can cause flow-induced<br />
vibration of fuel pins and FSA<br />
as a whole. The overall<br />
subassembly vibration will be in<br />
its cantilever mode. The SA<br />
vibration will also depends<br />
upon the sodium exit velocity,<br />
restraints at the supports in the<br />
grid plate and the buttons and<br />
the interaction of the discharge<br />
coolant jets with control plug<br />
parts positioned above the<br />
subassembly as well as with<br />
surrounding subassembly jets.<br />
As part of the FIV<br />
experimental program on FSA,<br />
modal measurements were<br />
carried out on SA in water to<br />
estimate the modal parameters.<br />
Theoretical modelling of FSA<br />
was also done using ANSYS<br />
FEM software to extract the<br />
natural frequencies and mode<br />
Table 1 : Modal frequencies in water<br />
Mode<br />
Case-1<br />
(Hz)<br />
shapes. Beam element was<br />
assigned to discretize the<br />
model and the full SA is divided<br />
in into six sections. In the<br />
analytical modelling, two cases<br />
were taken as support<br />
boundary conditions <strong>for</strong> FSA.<br />
Case 1. Hinged support at<br />
the location where FSA rests on<br />
the sleeve top and simply<br />
supported at the discriminator<br />
location.<br />
Case-2<br />
(Hz)<br />
1 3.7 3.9<br />
2 22.2 24.0<br />
3 64.6 66.2<br />
4 126.0 128.1<br />
5 147.9 149.0<br />
R&D FOR FBRs 27
IGC<br />
<strong>Annual</strong> <strong>Report</strong> 2007<br />
Case 2. Hinged support at<br />
the location where FSA rests on<br />
the sleeve top and fixed support<br />
at the discriminator location.<br />
Natural frequencies in water<br />
obtained from analytical<br />
prediction are given in Table 1<br />
. It is observed that almost<br />
similar values <strong>for</strong> natural<br />
frequencies are obtained in<br />
both SA support conditions.<br />
The SA was erected in the<br />
sleeve fixed in the Grid Box<br />
assembly, which in turn was<br />
supported on a vibration<br />
isolated test structure.<br />
Experimental modal analysis<br />
DUMMY FSA<br />
Fig.1 Experimental setup <strong>for</strong><br />
vibration measurement in water<br />
was carried out by exciting the<br />
SA laterally using a 50N <strong>for</strong>ce<br />
electro-dynamic exciter<br />
suspended from a top support<br />
structure. Fig.1 shows the<br />
experimental setup.<br />
Sine-Random signal<br />
generator is used to give input<br />
to the power amplifier through<br />
which the exciter is actuated.<br />
The response of the SA is<br />
measured using accelerometers<br />
installed at various locations<br />
along the length of the<br />
subassembly. Output of the<br />
<strong>for</strong>ce transducer and response<br />
accelerometers are recorded in<br />
FFT analyzer to estimate<br />
Frequency Response Function<br />
(FRF) up to 100 Hz. Modal<br />
frequencies above 100 Hz do<br />
not have much influence on the<br />
overall SA response due to FIV<br />
mechanisms. Hence modal<br />
measurement and analysis <strong>for</strong><br />
the present study was carried<br />
out in the frequency range upto<br />
100 Hz. The FRF at various<br />
measurement locations are<br />
transferred to modal analysis<br />
software to find out the modal<br />
parameters using polynomial<br />
curve fit method. Experiment<br />
was repeated by changing the<br />
excitation point. Fig. 2 shows a<br />
typical FRF measured in water<br />
and the first three natural<br />
frequencies are 3.5, 21.3 and<br />
56.5 Hz.<br />
Hence it is confirmed that the<br />
experimental values are<br />
matching with analytical<br />
prediction. To confirm the<br />
natural frequencies obtained<br />
from the random test, SA was<br />
excited with sinusoidal<br />
excitation at 3.5 Hz. It was<br />
observed that subassembly was<br />
vibrating with more than 10<br />
mm displacement at the top<br />
end. Results from this<br />
investigation will be employed<br />
<strong>for</strong> interpreting vibration<br />
signatures obtained from FIV<br />
studies on subassemblies.<br />
100m<br />
80m<br />
Magnitude, g / N<br />
60m<br />
40m<br />
20m<br />
3.5Hz<br />
21.3 Hz<br />
50 Hz electrical<br />
56.5Hz<br />
0<br />
20 40 60 80 100<br />
Hz<br />
Fig.2 Frequency response function [Accelerometer 2730 mm from top of SA]<br />
28 R&D FOR FBRs
IGC<br />
<strong>Annual</strong> <strong>Report</strong> 2007<br />
III.A.3. Investigation of Devices <strong>for</strong> Gas Entrainment<br />
Mitigation in Hot Sodium Pool<br />
In Fast Breeder Reactor pools,<br />
the sodium free surfaces are<br />
blanketed by inert argon cover<br />
gas. The free surfaces of<br />
sodium pools are not static and<br />
are associated with significant<br />
vertical and horizontal<br />
velocities. These velocities lead<br />
to free level fluctuations and<br />
<strong>for</strong>mation of vortices, which are<br />
potential sources <strong>for</strong> gas<br />
entrainment in the sodium<br />
pools. Various mechanisms of<br />
gas entrainment, transportation<br />
of gas to grid plate through<br />
heat exchangers (IHX) and<br />
pumps, agglomeration of gas<br />
inside the grid plate and its<br />
final passage through the core<br />
(Fig. 1) need to be understood<br />
well. This is an important safety<br />
problem as passage of argon<br />
gas through core leads to<br />
positive reactivity. To<br />
understand the various<br />
mechanisms responsible <strong>for</strong> gas<br />
entrainment, experiments had<br />
been carried out at IIT-Madras.<br />
This problem has been studied<br />
through multi-dimensional<br />
Computational Fluid Dynamic<br />
(CFD) analysis. The CFD results<br />
have been validated against<br />
experiments on 1/4 th scale<br />
water model. Design solutions<br />
to mitigate gas entrainment<br />
have been proposed.<br />
The core flow enters the hot<br />
pool as a horizontal jet (also<br />
called core jet) in between the<br />
control plug skirt and<br />
subassembly top. It induces<br />
a large anti-clockwise<br />
circulation zone, which<br />
occupies almost the entire hot<br />
pool (Fig. 2a). The maximum<br />
horizontal velocity with which<br />
the jet enters the hot pool is 3<br />
m/s and as a result of this, the<br />
maximum horizontal velocity on<br />
the free surface is seen to be<br />
1.0 m/s (Fig. 2b). The reason<br />
<strong>for</strong> this high free surface<br />
velocity is the presence of skirt.<br />
By keeping the free surface<br />
velocity low, sodium free level<br />
can be made quiescent and<br />
possibility of gas entrainment<br />
can be avoided. To avoid gas<br />
entrainment, the free surface<br />
velocity of sodium has to be<br />
less than 0.5 m/s. Reduction of<br />
free surface velocity is possible<br />
by altering the hot pool flow<br />
pattern such that the influence<br />
of core jet is minimized near the<br />
free surface.<br />
Detailed 3-D thermal<br />
hydraulic studies were carried<br />
out to see the efficacy of using<br />
baffles fitted to inner vessel<br />
upper shell, redan and control<br />
plug in reducing free level<br />
velocity. The effect of<br />
1-Inner vessel<br />
2-Main vessel<br />
3-Safety vessel<br />
Argon gas<br />
Fig.1 Transport path of entrained argon gas in FBR<br />
R&D FOR FBRs 29
IGC<br />
<strong>Annual</strong> <strong>Report</strong> 2007<br />
Control plug<br />
HOT POOL<br />
IHX<br />
CORE<br />
PUMP<br />
CORE<br />
Fig.2a Flow distribution in a<br />
vertical plane (reference design)<br />
Fig.2b Velocity distribution at free<br />
surface of sodium (reference design)<br />
Fig.3 Flow distribution with 3<br />
baffles baffles (option-a)<br />
Baffle<br />
HANGING<br />
SHELL<br />
HANGING<br />
SHELL<br />
CORE<br />
Fig.4 Flow distribution with 2 m<br />
width baffle (option-b)<br />
Fig.5a Details of hanging shell<br />
with cut-outs (option-c)<br />
Fig.5b Flow distribution with<br />
hanging shell and baffle (option-c)<br />
modifications in the control<br />
plug skirt, in the <strong>for</strong>m of<br />
providing circumferential slots<br />
either in the top or in the<br />
middle of the skirt was also<br />
studied. These studies were<br />
carried out with the objective of<br />
finding the lowest possible free<br />
level velocity.<br />
The following are the<br />
conclusions of the study:<br />
(a) Inverted L baffle on redan<br />
along with horizontal baffles on<br />
control plug and upper shell of<br />
inner vessel, was seen to be<br />
very effective in mitigating free<br />
surface velocity to 0.18 m/s<br />
(Fig. 3).<br />
(b) By using a single annular<br />
plate of 2 m width above IHX<br />
inlet, the velocities on the free<br />
surface can be kept within<br />
0.25 m/s (Fig. 4).<br />
These devices are judged to<br />
be un-practical considering the<br />
advanced stage of manufacture<br />
of inner vessel and control<br />
plug.<br />
(c) By having a horizontal<br />
baffle of 0.5 m width attached<br />
to the upper shell of inner<br />
vessel and lowering the roof<br />
slab inner shell upto IHX inlet,<br />
the free surface velocity could<br />
be reduced to 0.40 m/s (Fig.<br />
5a and 5b).<br />
Considering the ease of<br />
construction, option (c) has<br />
been selected.<br />
30 R&D FOR FBRs
IGC<br />
<strong>Annual</strong> <strong>Report</strong> 2007<br />
III.A.4. Flow Induced Vibration Studies on<br />
FBTR Special Subassembly<br />
An experiment is planned in<br />
FBTR to measure the fast flux<br />
using special foils in the grid<br />
plate area under power<br />
operation to assess its integrity.<br />
The foils are fixed on carrier<br />
capsules and are loaded in<br />
reactor core (4th ring) using a<br />
special subassembly (SA). Flow<br />
Induced Vibration (FIV) of this<br />
special subassembly has been<br />
studied in water, be<strong>for</strong>e loading<br />
it into the reactor core.<br />
The SA has 15.5 mm hole<br />
throughout the length. The<br />
Fig.1 Strain gauges<br />
Micro<br />
strain<br />
(RMS)<br />
40 Hz<br />
89 Hz<br />
Frequency (Hz)<br />
capsule carrier is made of 12<br />
mm dia SS rod and its over all<br />
length is 1661.5 mm. The test<br />
section was erected on a<br />
vibration isolated foundation in<br />
Hall-II. The subassembly was<br />
held vertically in the grid box<br />
and the support conditions and<br />
flow path to the subassembly<br />
was simulated as in the reactor.<br />
Two foil type strain gages<br />
were installed at 900 on the<br />
carrier capsule. Under- water<br />
accelerometers and strain<br />
gauges (~100 mm from grid<br />
plate support) were also<br />
installed on hexcan (Fig.1). The<br />
water flow through the SA was<br />
arrived at based on Burgreen<br />
correlation. The loop flow rate<br />
was measured using volume<br />
collection method.<br />
The vibration spectra were<br />
Overall RMS: 7.7 microstrain<br />
Fig.2 Vibration spectra of carrier capsule at nominal flow<br />
recorded using Dewetron data<br />
acquisition system. At nominal<br />
flow (4.83 m 3 /h), measured<br />
vibration level of carrier<br />
capsule is ~7.7 micro-strain<br />
(which corresponds to a stress<br />
level of 1.3 MPa). Fig.2 shows<br />
the vibration spectra of carrier<br />
capsule <strong>for</strong> nominal flow. The<br />
measured vibration level on<br />
subassembly hexcan is<br />
~1.84 micro-strain (which<br />
corresponds to a stress level of<br />
0.28 MPa).<br />
Vibration stress levels<br />
measured on both carrier<br />
capsule and on the hexcan are<br />
well below the permissible<br />
alternating stress limit of 16.1<br />
MPa at operating temperature.<br />
Hence the special subassembly<br />
was found to be safe against<br />
FIV phenomenon.<br />
R&D FOR FBRs 31
IGC<br />
<strong>Annual</strong> <strong>Report</strong> 2007<br />
III.A.5. Investigation of Thermal Striping at the<br />
Bottom of the Control Plug<br />
When non-isothermal fluid<br />
streams mix adjacent to a<br />
structure, the surface of the<br />
structure experiences<br />
temperature fluctuations and<br />
can develop cracks due to<br />
thermal fatigue. This<br />
phenomenon is called thermal<br />
striping. In fast breeder<br />
reactors, the coolant coming<br />
out from the fuel subassemblies<br />
is hotter than the coolant<br />
coming out of the blanket and<br />
absorber rod subassemblies.<br />
The improper mixing of the jets<br />
issuing out from these<br />
subassemblies results in<br />
temperature fluctuations in the<br />
fluid. This may lead to the<br />
structural damage of control<br />
plug components like shroud<br />
tubes, lattice plate, skirt etc.<br />
An experiment has been<br />
carried out in SAMRAT model to<br />
understand the mixing<br />
behaviour and to determine the<br />
extent of thermal striping in the<br />
above core area of PFBR.<br />
SAMRAT is a 1/4 scale model<br />
of PFBR primary circuit. Demineralized<br />
water is used as<br />
simulant in this model.<br />
It has been established by the<br />
earlier researchers that air or<br />
water can be used to simulate<br />
thermal striping phenomenon<br />
in sodium if Reynolds (Re)<br />
number and Peclet (Pe) number<br />
are sufficiently large (Re ><br />
20,000 and Pe > 600) both in<br />
prototype and model. The fluid<br />
thermal fluctuations as<br />
measured using the simulant<br />
fluid, can be transposed to the<br />
prototype condition if<br />
temperature is measured<br />
outside the thermal boundary<br />
layer. The attenuation of<br />
temperature fluctuations within<br />
the boundary layer can be<br />
determined accurately using<br />
sodium experiments.<br />
In the present work mixing in<br />
the fuel-blanket interface<br />
region was studied. Hot water<br />
at 343 K was sent through the<br />
fuel zone and cold water at 308<br />
K was sent through blanket<br />
zone. To measure the fluid<br />
thermal fluctuations, fast<br />
response thermocouples (time<br />
constant better than 15 ms)<br />
were used.<br />
Temperature (C)<br />
70<br />
60<br />
50<br />
40<br />
30<br />
20<br />
Temperature_mixing zone<br />
Temperature_cold water<br />
Temperature_hot water<br />
0 2 4 6 8 10<br />
Time<br />
Fig.1 Time series plot of temperature<br />
at mixing region<br />
Fig.1 shows a typical time series<br />
plot of the temperature as<br />
measured in the mixing zone.<br />
From the statistical analysis of<br />
data the mean temperature as<br />
seen by each thermocouple was<br />
estimated. These temperature<br />
data are presented in a<br />
normalized <strong>for</strong>m to transpose<br />
the result into reactor case by<br />
substituting the prototype<br />
parameters. The normalization<br />
is done in the following<br />
manner.<br />
where,<br />
T = Mean temperature<br />
of the fluid as measured by the<br />
thermocouple mounted in CP<br />
T h = Mean temperature<br />
of the hot inlet fluid<br />
(Thermocouple mounted at the<br />
SA exit)<br />
T c = Mean temperature<br />
of the cold inlet fluid<br />
(Thermocouple mounted at the<br />
SA exit)<br />
∆Trms = Root mean<br />
square of temperature<br />
fluctuations.<br />
32 R&D FOR FBRs
IGC<br />
<strong>Annual</strong> <strong>Report</strong> 2007<br />
T*<br />
1,00<br />
0,80<br />
0,60<br />
0,40<br />
SKIRT<br />
Set 1<br />
Set 2<br />
Set 3<br />
100 150 200 250 300<br />
Elevation from core top (mm) (model)<br />
The normalized mean<br />
temperature ( ) and the<br />
fluctuations are plotted<br />
against the elevation of the skirt<br />
above core top <strong>for</strong> various<br />
experimental conditions. The<br />
result is presented Fig.2. The<br />
ratio of Re between fuel and<br />
blanket zone was kept same as<br />
that of prototype. Different<br />
T*rms<br />
0.060<br />
0.050<br />
0.040<br />
0.030<br />
0.020<br />
0.010<br />
0.000<br />
Set 1<br />
Set 2<br />
Set 3<br />
100 150 200 250 300<br />
Elevation from core top (mm)<br />
(model)<br />
Fig.2 Characteristics of thermal fluctuation along the skirt height<br />
experimental conditions<br />
represent different Re of the fuel<br />
zone. It can be seen from the<br />
above figure that normalized<br />
mean temperature is initially<br />
decreasing along the elevation<br />
of the skirt due to the mixing by<br />
blanket flow but again it sees<br />
the hot water temperature at<br />
higher elevation. This is<br />
because of the fact that the<br />
blanket flow is covered by the<br />
fuel zone flow due to the<br />
flowering and bending of the<br />
jets. The maximum nondimensional<br />
temperature<br />
fluctuation ( ) max )<br />
as estimated from the<br />
experimental measurement is<br />
0.054. This value is useful to<br />
estimate the maximum fluid<br />
temperature fluctuation in the<br />
vicinity of the skirt at prototype<br />
condition. The maximum<br />
temperature fluctuation is<br />
estimated <strong>for</strong> the above<br />
mentioned component at<br />
prototype condition is ± 16.2 K<br />
(with 95% confidence level)<br />
which is well below the<br />
acceptable thermal striping<br />
limit (± 30 K in fluid).<br />
III.A.6. Investigations of Flow Reversal in the<br />
U-Tubes of Decay Heat Exchanger<br />
Unlike fossil fuel power<br />
plants, a nuclear reactor<br />
generates heat even after it is<br />
shut down. This decay heat is to<br />
be removed successfully to<br />
keep system temperatures<br />
within acceptable limits. To<br />
accomplish this task, natural<br />
convection driven Safety Grade<br />
Decay Heat Removal System<br />
(SGDHRS) has been provided,<br />
which has redundant and<br />
independent circuit as shown in<br />
Fig. 1. Each circuit of SGDHRS<br />
consists of a sodium to sodium<br />
heat exchanger (DHX) and a<br />
sodium to air heat exchanger<br />
(AHX) linked by an intermediate<br />
sodium loop.<br />
One design of DHX, has 'U'<br />
tubes with two-passes. There<br />
are 90 tubes which are<br />
arranged to have 5 inner rows<br />
and 2 outer rows and are<br />
supported by anti-vibration<br />
plates along the length.<br />
Intermediate sodium enters the<br />
Fig.1 Safety grade decay heat<br />
removal circuit<br />
R&D FOR FBRs 33
IGC<br />
<strong>Annual</strong> <strong>Report</strong> 2007<br />
Hot Pool Sodium Inlet<br />
Intermediate Sodium<br />
Inlet<br />
Outlet<br />
distributions of intermediate<br />
sodium in the tubes and<br />
primary sodium on the shell<br />
side have been solved as a<br />
conjugate problem, using the<br />
CFD code STAR-CD.<br />
Baffle<br />
Hot Pool Sodium Outlet<br />
Hot Pool<br />
Fig.2 Computational model<br />
Outlet<br />
Inlet<br />
inner rows of tubes from the the present study.<br />
top, picks up heat from the<br />
primary sodium and leaves<br />
from the outer rows at the top.<br />
Primary sodium in the hot pool<br />
In the present investigations,<br />
a 3-D 60° sector model of DHX<br />
comprising of 15 tubes and hot<br />
enters the DHX in radial pool has been considered (Fig.<br />
direction through a per<strong>for</strong>ated<br />
outer shell, exchanges heat with<br />
the intermediate sodium, gets<br />
cooled and leaves back to the<br />
2). The intermediate sodium<br />
flow rate (32 kg/s) and its inlet<br />
temperature (539 K) to DHX<br />
have been estimated from a<br />
pool through the bottom coupled 1-D model of the<br />
window. To enable connectivity<br />
between the 5 inner rows and 2<br />
outer rows through U bends,<br />
entire circuit. The resistances<br />
offered by fine scale structures<br />
viz. the porous shell, antivibration<br />
the lengths of U-tubes are<br />
plates etc. are<br />
made unequal. Also, the tubes accounted by additional<br />
see varying primary sodium sources added to the<br />
temperature. Due to these momentum equations. High<br />
reasons, there is a risk of flow Reynolds number k-∈<br />
reversal in some tubes. The<br />
flow reversal adversely affects<br />
turbulence model has been<br />
used <strong>for</strong> modeling turbulence.<br />
the heat removal capacity of About 4 lakhs structured<br />
the SGDHRS and hence, it is<br />
essential to investigate the<br />
possibility of flow reversal in the<br />
hexahedral mesh have been<br />
used <strong>for</strong> the computational<br />
fluid dynamic (CFD) simulation.<br />
tubes, which is the objective of The flow and temperature<br />
The temperature of primary<br />
and intermediate sodium in the<br />
DHX at various elevations is<br />
depicted in Fig. 3. The antivibration<br />
plates cover the inner<br />
leg of U-tubes and hence it<br />
divert the primary sodium from<br />
the inner leg to the outer leg,<br />
thereby increasing the heat<br />
transfer in the outer leg. The<br />
intermediate sodium<br />
temperature distribution along<br />
the length of the tube centerline<br />
<strong>for</strong> all the 15 tubes is shown in<br />
the Fig. 4. The mean<br />
temperature of the intermediate<br />
sodium at the outlet is 723 K.<br />
In the co-current direction (i.e.,<br />
inner leg), the heat absorbed is<br />
the least by the inner-most row<br />
(i.e. Tube-1) and it increases as<br />
one moves outwards. It is the<br />
maximum in Row-5 (Tubes 11-<br />
15). At the bottom end, the<br />
maximum temperature<br />
difference is 71 K. This large<br />
difference in temperature is<br />
compensated in the countercurrent<br />
direction (outer leg),<br />
leading to a marginal<br />
temperature difference of 17 K<br />
at intermediate sodium outlet.<br />
This is due to the favorable<br />
(larger) driving temperature<br />
gradient between the<br />
34 R&D FOR FBRs
IGC<br />
<strong>Annual</strong> <strong>Report</strong> 2007<br />
intermediate and primary<br />
sodium <strong>for</strong> the outer row. Fig. 5<br />
shows the mass flow rate of<br />
intermediate sodium from inlet<br />
Hot pool top<br />
DHX bottom<br />
Fig. 3 Temperature distribution of<br />
sodium at various elevations<br />
plenum to the U-tubes. The<br />
average flow rate of sodium is<br />
0.36 kg/s/tube. However, due<br />
to flow non-uni<strong>for</strong>mity it can be<br />
seen that the minimum flow rate<br />
is 0.31 kg/s and the maximum<br />
flow rate is 0.38 kg/s. In<br />
general, the flow rate is higher<br />
in the outermost row which is<br />
connected to three inner rows.<br />
That is, the flow rate is more in<br />
the tubes where the heat<br />
transfer is more in the upward<br />
leg. The differences in the flow<br />
rates among the tubes are only<br />
marginal (-13 % to + 5 %) and<br />
there is no flow reversal in any<br />
of the tubes. Thus, through this<br />
CFD study, it has been<br />
established that there is no risk<br />
<strong>for</strong> flow reversal in the SGDHRS<br />
of PFBR.<br />
Height, m<br />
4<br />
3.5<br />
3<br />
2.5<br />
2<br />
1.5<br />
1<br />
0.5<br />
0<br />
Inlet<br />
Tube - 1<br />
Tube - 2<br />
Tube - 3<br />
Tube - 4<br />
Tube - 5<br />
Tube - 6<br />
Tube - 7<br />
Tube - 8<br />
Tube - 9<br />
Tube - 10<br />
Tube - 11<br />
Tube - 12<br />
Tube - 13<br />
Tube - 14<br />
Tube - 15<br />
Row-1<br />
Row-2<br />
Row-3<br />
Row-4<br />
Row-5<br />
Baffles<br />
Outlet<br />
500 550 600 650 700 750<br />
Temperature of intermediate sodium in u-tubes, K<br />
Fig. 4 Central line temperature of<br />
intermediate sodium inside U-tubes<br />
along the length<br />
11 0.31<br />
7 0.35<br />
4 0.37 12 0.34<br />
2 0.37 8 0.36<br />
1 0.36 5 0.37 13 0.35<br />
3 0.37 9 0.37<br />
6 0.37 14 0.34<br />
10 0.36<br />
15 0.32<br />
7 0.35<br />
11 0.31<br />
3 0.37<br />
8 0.36<br />
12 0.34<br />
4 0.37<br />
1 0.36<br />
13 0.35<br />
9 0.37<br />
14 0.34<br />
2 0.37<br />
10 0.36<br />
5 0.37<br />
15 0.32<br />
6 0.37<br />
g. 5 Mass flow rates (in kg/s) of intermediate sodium through the<br />
Fig. 5 Mass flow rates (in kg/s) of<br />
intermediate sodium through the<br />
tubes<br />
III.A.7. Gas Entrainment - Effect of Ring Baffle Geometry<br />
There is a large sodium free<br />
surface in the hot pool of PFBR.<br />
Argon, which is an inert gas, is<br />
provided above the free surface<br />
of hot pool to accommodate<br />
volumetric expansion of sodium<br />
and to prevent any contact<br />
between sodium and<br />
atmosphere. Presence of high<br />
free surface velocity and<br />
immersed components<br />
produces surface vortices which<br />
in turn entrain the cover gas<br />
into the hot pool. This<br />
entrainment of cover gas can<br />
attract<br />
unfavourable<br />
Table 1 : Numerical results <strong>for</strong> free surface velocities <strong>for</strong><br />
different baffle plate configurations<br />
R&D FOR FBRs 35
IGC<br />
<strong>Annual</strong> <strong>Report</strong> 2007<br />
operational problems of the<br />
reactor.<br />
Hence, it is important to<br />
mitigate the gas entrainment at<br />
the free surface of the hot pool.<br />
Making free surface quiescent<br />
is one of the means to mitigate<br />
gas entrainment from free<br />
surface. The numerical and<br />
experimental studies carried out<br />
in a large scale model showed<br />
that inclusion of ring type baffle<br />
plate below the free surface<br />
was very effective to reduce the<br />
free surface velocity. With the<br />
employment of such simple<br />
baffle plate the free surface<br />
velocity was reduced to half of<br />
its original value. No surface<br />
vortices were also seen at the<br />
free surface. However, it was<br />
found from the experiment that<br />
approximately a margin of 100<br />
mm on the nominal free level<br />
height is available in PFBR at<br />
nominal flow rate be<strong>for</strong>e the<br />
onset of vortex activated gas<br />
entrainment from free surface.<br />
With the objective to improve<br />
this margin, improvements on<br />
the baffle plate design are<br />
necessary so that free surface<br />
velocity can be reduced further.<br />
In the present work, the effect<br />
of various baffle plate geometry<br />
on the hydraulics of the<br />
SAMRAT model hot pool was<br />
investigated numerically using<br />
PHOENICS code.<br />
A 90 0 sector model of hot pool<br />
in cylindrical coordinate system<br />
Baffle Plate<br />
Fig.1 Flow pattern in hot pool with simple ring type baffle plate<br />
with one IHX and half pump<br />
was considered <strong>for</strong> analysis to<br />
as steps. The IHX is modelled as<br />
hollow cylinder.<br />
reduce the computational time.<br />
The computational domain is<br />
subdivided with a grid structure<br />
of 69 X 77 X 74 (total 3,<br />
93,162) cells to achieve fairly<br />
accurate results independent of<br />
grid. Fixed mass flow rate is<br />
provided as the inlet boundary<br />
condition at Fuel, Blanket,<br />
Experiment was carried out<br />
with simple ring type baffle<br />
plate geometry. The numerical<br />
results were compared with<br />
these experimental results and<br />
a fair agreement was observed.<br />
Fig.1 shows the flow pattern in<br />
hot pool with ring type baffle<br />
Storage and Cavity zone. The plate geometry(without any<br />
skirt is modelled as porous porosity).The numerical results<br />
plate. Flow through Control <strong>for</strong> different baffle plate<br />
Plug based on experimental<br />
measurement is modelled by<br />
specifying mass sink at the<br />
bottom of the CP and flow is<br />
considered to enter the hot<br />
configurations analysed are<br />
presented in Table 1. The<br />
results show that there is little<br />
incentive in adopting a complex<br />
geometry of baffle plate as the<br />
pool uni<strong>for</strong>mly at different reduction in free surface<br />
levels of the CP. All the velocity is minimal. This may be<br />
structural components in hot<br />
pool are modelled by blocking<br />
due to the fact that the minor<br />
variations in the baffle plate<br />
the cells at corresponding geometry do not have<br />
locations. The conical portion<br />
of the inner vessel is modelled<br />
dominant influence on the<br />
global flow patterns.<br />
36 R&D FOR FBRs
IGC<br />
<strong>Annual</strong> <strong>Report</strong> 2007<br />
III.A.8. Assessment of Dynamic Instability in Once Through<br />
Steam Generator<br />
Hydrodynamic flow instability in<br />
Once Through Steam<br />
Generators (OTSG) is one of<br />
the important problems in the<br />
design and operation of Liquid<br />
Metal Fast Breeder Reactors.<br />
Under certain operating<br />
conditions, water flow in OTSG<br />
is susceptible to instability due<br />
to the close coupling between<br />
the thermal and hydraulic<br />
processes. Sustained flow<br />
oscillations due to instability<br />
are undesirable since they<br />
result in flow mal-distribution<br />
among the tubes or in SG<br />
modules resulting in thermal<br />
stress, mechanical vibrations<br />
and system control problems.<br />
Many types of dynamic<br />
instabilities can occur in SG,<br />
but the cause of the main type<br />
of instability important <strong>for</strong> the<br />
Special Thermowell<br />
Fig.1 SGTF steam generator<br />
design of SGs is the<br />
propagation of density waves.<br />
This type of low frequency<br />
instability is referred to as<br />
density wave oscillations. This<br />
occurs because of the phase<br />
mismatch between the primary<br />
perturbation (water flow) and<br />
the response to this<br />
perturbation (pressure drop). As<br />
many tubes are operating<br />
under essentially constant<br />
pressure heads, this mismatch<br />
can lead to sustained/diverging<br />
oscillations. For example, when<br />
water flow is reduced, or<br />
sodium flow is increased,<br />
vapour generation rate and<br />
pressure drop change. Time<br />
delays between these processes<br />
can, under certain operating<br />
conditions, cause sustained<br />
oscillations, leading to the<br />
onset of dynamic instability.<br />
Water flow oscillation in tubes<br />
manifests as oscillations in the<br />
steam temperature at the tube<br />
outlet/pressure fluctuations.<br />
However it is difficult to<br />
instrument individual tubes in<br />
SG <strong>for</strong> such measurement in an<br />
operating plant. If the flow<br />
oscillation in the tube manifests<br />
itself in the overall module flow,<br />
then fluctuation in the overall<br />
flow/flow noise could be<br />
utilized <strong>for</strong> on-line stability<br />
measurements. Towards this<br />
experiments were conducted in<br />
the sodium heated once<br />
through steam generator in<br />
SGTF (Fig.1). To confirm the<br />
extent of oscillation in the<br />
steam temperature and in inlet<br />
water flow, 3 tubes out of 19,<br />
were monitored besides overall<br />
module flow.<br />
Main objective of the present<br />
study was to assess the<br />
occurrence of dynamic<br />
instability in SG through<br />
module inlet flow perturbations,<br />
confirmed by ∆P measurements<br />
across the orifice at entry to the<br />
tubes and steam temperature<br />
fluctuation measurement at the<br />
outlet of tubes. Flow Instability<br />
measurement was carried out<br />
at 20% power level (1.1 MWt).<br />
By decreasing the SG outlet<br />
pressure, instability regime was<br />
approached. Fluctuations in the<br />
steam outlet temperature and in<br />
the inlet flow were monitored<br />
continuously to detect the onset<br />
of instability phenomenon.<br />
During the operation in the<br />
unstable region, the mean<br />
outlet temperature in all the<br />
tubes was found to be<br />
decreased and very large<br />
R&D FOR FBRs 37
IGC<br />
<strong>Annual</strong> <strong>Report</strong> 2007<br />
510 0 C –<br />
Tube Flow fluctuation<br />
Steam Temperature fluctuation at tube outlet<br />
460 0 C – 0 bar<br />
Steam outlet Pressure fluctuation<br />
SG inlet flow fluctuation<br />
Fig.2 Instability build-up<br />
fluctuations (10-20 K) in observed at the output of the<br />
temperature readings are differential pressure transmitters<br />
observed (Fig.2). Fluctuations, connected across the orifices<br />
periodic in nature were during the instability<br />
phenomenon.<br />
Fig.2 also shows the variation<br />
of both the thermocouple<br />
output and the differential<br />
pressure transmitter output <strong>for</strong><br />
a tube. Similar pattern of<br />
oscillation is observed in other<br />
tubes also. Oscillations<br />
observed in flow, in tubes were<br />
found to be in the same phase.<br />
A similar trend is also observed<br />
in the module feed water inlet<br />
flow to SG during instability.<br />
The above has indicated the<br />
feasibility of an instrumentation<br />
scheme <strong>for</strong> on-line<br />
measurement of dynamic<br />
instability in once through<br />
Steam Generator in an<br />
operating plant through flow<br />
fluctuation in overall module<br />
flow.<br />
III.B. Sodium Technology<br />
III.B.1. Sodium Cleaning of FBTR Dummy Subassembly by Steam-Nitrogen<br />
Process Using In-house Developed Hydrogen Sensor (PEMHS)<br />
Sodium cleaning method based<br />
on steam-nitrogen is a simple<br />
and effective process. Residual<br />
sodium sticking to the fuel sub<br />
assemblies (FSA) received at<br />
Head End Facility (HEF) from<br />
FBTR and its reaction products<br />
with air are likely to interfere<br />
with chopping process. Hence<br />
the residual sodium has to be<br />
removed. Sodium cleaning is<br />
carried out in HEF by<br />
steam/nitrogen process. To<br />
gain experience in sodium<br />
cleaning of FSA by<br />
steam/nitrogen process and to<br />
optimize the process<br />
parameters, the mock-up<br />
sodium cleaning experiment<br />
was carried out in an in-house<br />
developed system.<br />
The sodium cleaning process<br />
involves following steps.<br />
1. Steam cleaning: Removal of<br />
adhering sodium by reaction<br />
with steam carried by nitrogen.<br />
38 R&D FOR FBRs
IGC<br />
<strong>Annual</strong> <strong>Report</strong> 2007<br />
2. Water wash: Washing FSA<br />
with demineralised water.<br />
During the reaction of sodium<br />
with steam, sodium hydroxide<br />
and hydrogen are produced.<br />
Hydrogen <strong>for</strong>ms an explosive<br />
mixture with air beyond its<br />
threshold limit of 4% (v/v) when<br />
released to the atmosphere.<br />
For safe operation of the<br />
cleaning process, hydrogen<br />
concentration is required to be<br />
monitored online and<br />
preferably maintained below<br />
safe limit of 2% (v/v) of<br />
hydrogen. Nitrogen is used as<br />
the carrier gas <strong>for</strong> steam and<br />
also to keep the hydrogen<br />
concentration low at the safe<br />
level. After completion of the<br />
sodium cleaning by steam<br />
nitrogen process, the adherent<br />
sodium hydroxide is washed<br />
with dematerialized water.<br />
Hydrogen release occurs during<br />
water washing also and has to<br />
FIG.1 Sodium cleaning system<br />
<strong>for</strong> FBTR SA<br />
be monitored. The completion<br />
of the steam cleaning and<br />
water wash of sodium is<br />
indicated by the hydrogen<br />
concentration reducing to near<br />
background value.<br />
Proton exchange membrane<br />
based hydrogen sensor<br />
(PEMHS) was used <strong>for</strong> online<br />
monitoring of hydrogen evolved<br />
during sodium cleaning of FBTR<br />
mock subassembly. The sensor<br />
is an amperometric device<br />
based on NAFION which is a<br />
Proton Exchange Membrane<br />
(PEM). Platinum is used as both<br />
anode and cathode. The<br />
amount of sodium removed<br />
during the cleaning process can<br />
also be estimated from the total<br />
hydrogen released. Prior to its<br />
application <strong>for</strong> sodium<br />
cleaning, mock experiments<br />
were carried out at the site of<br />
sodium cleaning.<br />
Schematic of the set-up used<br />
<strong>for</strong> sodium cleaning is shown in<br />
Fig.1. It consists of an inner<br />
chamber and an outer<br />
chamber. the inner chamber is<br />
<strong>for</strong> positioning of FSA and the<br />
outer chamber is <strong>for</strong> preheating<br />
of the FSA. Testpot-1 of<br />
SILVERINA loop at engineering<br />
Hall-1 was used <strong>for</strong> sodium<br />
wetting of mock-up FSA. The<br />
same was loaded into the leak<br />
tight stainless steel cleaning<br />
chamber under nitrogen<br />
atmosphere using the crane.<br />
Steam cleaning<br />
FSA was lowered, positioned in<br />
the cleaning chamber and<br />
once-through circulation of<br />
nitrogen was maintained in the<br />
chamber with a flow rate of 10<br />
Lpm. Nitrogen gas from the<br />
chamber was tapped at a flow<br />
rate of 200 Std. CC/min and<br />
let into the proton exchange<br />
membrane based hydrogen<br />
sensor (PEMHS). Hydrogen<br />
concentration was monitored<br />
online via data acquisition<br />
system.<br />
Hydrogen<br />
concentration value was also<br />
displayed prominently. Steam<br />
from the electrical boiler, at<br />
403 K and 1.1kg/cm 2 , was<br />
admitted to the cleaning<br />
chamber. Increase in hydrogen<br />
concentration was reduced by<br />
enhancing the nitrogen flow<br />
rate and reducing the steam<br />
supply to maintain the<br />
hydrogen concentration below<br />
2%. Reduced amount of steam<br />
slows the sodium water reaction<br />
and hence hydrogen<br />
generation. Higher nitrogen<br />
flow-rate (20 Lpm) diluted the<br />
hydrogen present in the<br />
chamber and hence reduces<br />
the concentration of hydrogen.<br />
Any increase in pressure in the<br />
cleaning chamber beyond<br />
1.5kg/cm 2 could be released<br />
using the safety valve. The<br />
steam condensate was<br />
collected in drain cooler during<br />
the cleaning process. Once the<br />
hydrogen release reduced to<br />
near back ground value, steam<br />
cleaning was stopped and the<br />
steam condensate collected.<br />
R&D FOR FBRs 39
IGC<br />
<strong>Annual</strong> <strong>Report</strong> 2007<br />
The variation in concentration<br />
of Hydrogen in nitrogen during<br />
steam wash is shown in Fig.2.<br />
Be<strong>for</strong>e the introduction of<br />
steam, hydrogen was observed<br />
in the concentration range of<br />
0.05% in the nitrogen stream<br />
(region A of Fig.2.). This can be<br />
attributed to the reaction<br />
between sodium and residual<br />
moisture in the nitrogen gas.<br />
Abrupt increase in hydrogen<br />
concentration was observed at<br />
region C and steam supply was<br />
cut off to reduce further<br />
reaction. Nitrogen flow rate<br />
was increased to reduce the<br />
hydrogen concentration to safe<br />
limit of 2%. This sharp increase<br />
of hydrogen concentration may<br />
be due to condensation of<br />
steam in the chamber and may<br />
be prevented by preheating of<br />
the system. Once the hydrogen<br />
concentration reached less than<br />
1%, steam was let in (region D).<br />
The steam supply should be<br />
regulated with respect to the<br />
hydrogen concentration<br />
H 2<br />
conc. (%)<br />
4.0<br />
3.5<br />
3.0<br />
2.5<br />
2.0<br />
1.5<br />
1.0<br />
0.5<br />
0.0<br />
Steam cut off<br />
N 2<br />
20 (l /min)<br />
steam let in<br />
N 2<br />
10 (l /min)<br />
FSA in<br />
chamber<br />
A<br />
B<br />
C<br />
0 20 40 60 80 100 120 140 160 180 200 220 240 260<br />
D<br />
Time(min)<br />
steam let in<br />
N 2<br />
20 (l /min)<br />
steam cut off<br />
N 2<br />
20 (l /min)<br />
Fig.2 Hydrogen released during<br />
steam cleaning of FBTR FSA by<br />
steam-nitrogen process<br />
E<br />
monitored with the sensor, and<br />
the nitrogen flow rate has to be<br />
adjusted to control the<br />
concentration of steam and<br />
hydrogen. In addition to<br />
hydrogen concentration, the<br />
rate of rise of hydrogen signal<br />
has to be considered while<br />
regulating the nitrogen flow<br />
rate and steam supply. It is<br />
recommended to have an<br />
automated system which<br />
receives the hydrogen<br />
concentration signal from the<br />
sensor and adjust the flow rate<br />
of nitrogen and supply of steam<br />
to the chamber.<br />
Water-wash<br />
In order to remove any unreacted<br />
sodium and sodium<br />
hydroxide sticking on the<br />
subassembly, water washing<br />
was carried out by filling and<br />
circulating DM water from a<br />
reservoir using a pump. Water<br />
level in the chamber was raised<br />
slowly by letting in water from<br />
the bottom. Hydrogen was<br />
continuously monitored and<br />
whenever it exceeds 2%, water<br />
was dumped immediately from<br />
the cleaning chamber to<br />
prevent hydrogen build-up. The<br />
process was continued by<br />
maintaining the hydrogen<br />
concentration within safe limit<br />
till the whole of FSA was<br />
submerged in water. Once the<br />
hydrogen concentration<br />
reached near background<br />
value, it was presumed that the<br />
Fig.3 View of FSA<br />
after cleaning<br />
cleaning operation was<br />
completed. The water in the<br />
chamber was circulated to<br />
ensure the complete removal of<br />
sodium hydroxide. The wash<br />
water was quantitatively<br />
collected <strong>for</strong> sodium<br />
estimation. The FSA was lifted<br />
using EOT crane, visually<br />
examined, dried and stored.<br />
The FSA after the cleaning<br />
process is shown in Fig. 3.<br />
The entire operation has<br />
given enough confidence over<br />
the design and operation of the<br />
cleaning system and the<br />
hydrogen sensor developed at<br />
chemical group. The campaign<br />
also demonstrated the technical<br />
feasibility of safe transfer of<br />
sodium wetted FSA to the<br />
cleaning chamber in ambient<br />
atmosphere. The parameters<br />
critical in the cleaning process<br />
were identified.<br />
40 R&D FOR FBRs
IGC<br />
<strong>Annual</strong> <strong>Report</strong> 2007<br />
III.B.2. Studies on Thermochemical Aspects of<br />
Sodium-Alcohol Reaction and Characteristics of the Product<br />
In sodium cooled fast<br />
reactors, a thin layer of sodium<br />
gets deposited on the surface of<br />
steel components that are in<br />
physical contact with liquid<br />
sodium. Some of these<br />
components need to be taken<br />
out <strong>for</strong> periodic maintenance or<br />
replacement. Exposure of these<br />
components to ambient air<br />
poses fire hazard and possible<br />
hydrogen explosion due to<br />
vigorous reaction of sodium<br />
with moisture present in air. To<br />
avoid this, sodium needs to be<br />
removed from the component<br />
surface prior to maintenance<br />
work. Alcohols are generally<br />
employed world wide <strong>for</strong><br />
cleaning sodium from small<br />
and delicate components. Ethyl<br />
carbitol used <strong>for</strong> cleaning<br />
sodium storage tanks which<br />
contains a few kilogram of<br />
sodium has been reported to<br />
cause run-away reactions<br />
leading to accidents in France<br />
and Germany. For clear<br />
understanding of the chemistry<br />
of sodium-alcohol reactions,<br />
data on thermochemical<br />
properties like enthalpies of<br />
reaction, enthalpies of solution,<br />
enthalpies of <strong>for</strong>mation and<br />
heat capacity of the<br />
constituents and reaction<br />
products in sodium-alcohol<br />
system are essential. Owing to<br />
limited or non-availability of<br />
such data, studies have been<br />
taken up in this system.<br />
Enthalpies of solution, reaction<br />
and <strong>for</strong>mation<br />
Molar enthalpies of solution<br />
of sodium in methanol, ethanol<br />
and n-propanol and of sodium<br />
alkoxides in their<br />
corresponding alcohols were<br />
measured at 298.15 K using an<br />
isoperibol solution calorimeter.<br />
The measured molar enthalpies<br />
of solution of sodium in the<br />
above alcohols are<br />
∆ sol H 0 m(Na/ROH)= -204.0±1.1, -<br />
190.4±1.3 and -180.9±0.8<br />
kJ mol -1 , respectively. The<br />
measured molar enthalpies of<br />
solution of sodium alkoxides in<br />
its corresponding alcohols are<br />
∆ sol H 0 m(RONa/ROH) = -76.8±0.3,<br />
-54.8±0.4 and -41.9±0.7 kJ<br />
mol -1 , respectively. The molar<br />
enthalpies of reaction of<br />
sodium with methanol,<br />
ethanol and n propanol<br />
were measured and<br />
found to be ∆ r H 0 m(Na/ROH)=<br />
127.11±1.34, -135.59±1.40<br />
and -138.97±1.07 kJ mol -1 ,<br />
respectively. From these results<br />
and other data, the standard<br />
molar enthalpies of <strong>for</strong>mation,<br />
∆ f H 0 m(RONa) of sodium<br />
methoxide, sodium ethoxide<br />
and sodium n propoxide were<br />
calculated and found to be<br />
366.3±1.3, 413.3 1.4 and<br />
441.6±1.2 kJ mol -1 ,<br />
respectively. Fig. 1 shows the<br />
variation of ∆ f H 0 m(NaOR)) vs<br />
∆ f H 0 m(ROH measured in the<br />
present study and compared<br />
with literature data (Leal and<br />
NBS). A linear correlation has<br />
been found between<br />
∆ f H 0 m(NaOR) and ∆ f H 0 m(ROH) as<br />
given in Eqn. (1), which is<br />
useful to predict the enthalpies<br />
of <strong>for</strong>mation of higher sodium<br />
alkoxides.<br />
∆H (RONa, cr) =<br />
f<br />
( 1.19 ± 0.02) ∆H<br />
<br />
(ROH,l) − ( 82.10 ± 6.15)<br />
f<br />
(1)<br />
In a similar fashion,<br />
enthalpies of solution of<br />
sodium and sodium alkoxides<br />
in respective alcohols were<br />
plotted against enthalpies of<br />
<strong>for</strong>mation of corresponding<br />
alcohols and shown in Fig. 2.<br />
The linear correlations<br />
obtained from Fig. 2 are given<br />
in Eqns. (2) and (3),<br />
respectively. These correlations<br />
may be used to estimate the<br />
enthalpy of solutions of higher<br />
n-alkyl derivatives of sodium<br />
alkoxides.<br />
R&D FOR FBRs 41
IGC<br />
<strong>Annual</strong> <strong>Report</strong> 2007<br />
(2)<br />
(3)<br />
Heat capacity<br />
Heat capacity of sodium<br />
methoxide, sodium ethoxide,<br />
sodium n-propoxide and<br />
sodium iso-propoxide were<br />
measured using DSC technique<br />
in the temperature range 240<br />
550 K. Fig.3 shows the<br />
variation of heat capacity<br />
values of sodium alkoxides as a<br />
function of temperature. The<br />
values were fitted to a<br />
polynomial by least-squares<br />
method and the expressions<br />
obtained are given above.<br />
Using theses values, other<br />
thermodynamic functions such<br />
as enthalpy increments,<br />
entropies and Gibbs energy<br />
functions were derived.<br />
The variation in ∆Cp,m as a<br />
function of temperature <strong>for</strong><br />
addition of one -CH 2 - group<br />
from sodium methoxide to<br />
sodium ethoxide and ethoxide<br />
to n-propoxide was computed.<br />
It can be inferred that Cp,m <strong>for</strong><br />
addition of one -CH 2 - group<br />
can be considered to be same<br />
<strong>for</strong> both the alkoxides. It is thus<br />
established in this study that the<br />
heat capacity values of higher<br />
alkoxides such as sodium n-<br />
butoxide, sodium n-pentoxide<br />
can be estimated from data on<br />
that of the lower alkoxides.<br />
∆H f [RONa,cr] (kJ mol -1 )<br />
-360 Leal<br />
NBS table<br />
Present work<br />
-380<br />
-400<br />
-420<br />
-440<br />
-460<br />
∆H sol [Na / ROH] (kJ mol -1 )<br />
-170<br />
-180<br />
-190<br />
-200<br />
Na/ROH<br />
RoNa/ROH<br />
Fitted data<br />
-30<br />
-40<br />
-50<br />
-60<br />
-70<br />
-80<br />
∆H sol [RONa / ROH] (kJ . mol -1 )<br />
C p,m<br />
/ J K -1 mol -1<br />
200<br />
150<br />
100<br />
50<br />
C p,m MeONa; G. Grenter & E.F. Westrum<br />
C p,m MeONa measured This work<br />
C p,m EtONa measured "<br />
C p,m n-PONa measured "<br />
C p,m iso-PONa measured "<br />
Fit<br />
-480<br />
-340 -320 -300 -280 -260 -240 -220<br />
∆H f [ROH,l] (kJ mol -1 )<br />
-210<br />
-90<br />
-320 -300 -280 -260 -240 -220<br />
∆H f<br />
[ROH, l] (kJ mol -1 )<br />
0<br />
0 100 200 300 400 500 600<br />
T / K<br />
Fig.1 Variation of enthalpy of sodium<br />
alkoxides versus enthalpy of<br />
<strong>for</strong>mation of the corresponding<br />
alcohol<br />
Fig.2 Variation of enthalpy of<br />
solution of Na/ROH and RONa/ROH<br />
versus enthalpy of the corresponding<br />
alcohol<br />
Fig.3 Variation of heat capacity as a<br />
function of temperature of sodium<br />
alkoxides<br />
42 R&D FOR FBRs
IGC<br />
<strong>Annual</strong> <strong>Report</strong> 2007<br />
III.B.3. Electron Microscopy Investigation on a<br />
Failed Bellow Sealed Valve in Sodium Circuits<br />
in Large Component Test Rig<br />
The Bellows sealed valves are<br />
used in the sodium circuits to<br />
achieve leak tightness. The<br />
outer surface is in contact with<br />
molten liquid sodium and the<br />
inner surface with air or<br />
oxygen. The valve in service <strong>for</strong><br />
nearly 40,000 hours in the<br />
temperature range of 150-<br />
550 o C at the Large Component<br />
Test Rig (LCTR) failed during an<br />
operation at 300-350 o C. The<br />
failure manifested as<br />
per<strong>for</strong>ations at highly stressed<br />
regions on the outer ply.<br />
Further, wall thinning and<br />
dissolution of the material was<br />
observed on the inner ply. A<br />
detailed metallurgical<br />
investigation was carried out to<br />
identify the cause of failure.<br />
Examination of the material<br />
showed that it is Ti modified<br />
316 austenitic stainless steel.<br />
The outer and inner ply showed<br />
fine pits on the surface. The<br />
grain boundaries of the outer<br />
ply showed signatures of<br />
sensitization as seen in Fig.1.<br />
Detailed electron microscopy<br />
investigations showed the<br />
presence of large number of<br />
fine de<strong>for</strong>mation twins (Fig.2).<br />
The observation of fine twins is<br />
a signature of de<strong>for</strong>mation at<br />
high strain rates, since it is well<br />
known that f.c.c metals<br />
undergo de<strong>for</strong>mation twinning<br />
only under high strain rates.<br />
This could have been<br />
introduced during the <strong>for</strong>ming<br />
and fabrication processes or<br />
thermal cycling during service.<br />
X-ray diffraction analysis<br />
showed the presence of α-Fe<br />
along with γ-Fe. The specimen<br />
was also magnetic. A high<br />
value of hardness (360VHN)<br />
was observed. These<br />
observations suggest the<br />
presence of a martensite phase.<br />
TEM observations also showed<br />
the presence of martensite laths<br />
in matrix. No reversion of<br />
martensite was observed, which<br />
can be understood since<br />
martensite<br />
reversion<br />
temperatures in 304 and<br />
316SS are reported to be<br />
higher than 773 K. The service<br />
temperature of 573-623 K,<br />
precludes <strong>for</strong>mation of<br />
martensite. This confirms that<br />
the martensite observed in the<br />
bellows is strain induced<br />
martensite, <strong>for</strong>med during<br />
fabrication. This can be<br />
understood since after<br />
fabrication the bellows are not<br />
stress relieved to impart better<br />
fatigue resistance. The<br />
presence of strain induced<br />
martensite is reported to cause<br />
low temperature sensitization at<br />
long durations. This explains<br />
the cause of sensitized<br />
microstructure in the present<br />
case.<br />
Based on the observations it<br />
is inferred that prolonged<br />
exposure of a sensitized<br />
microstructure with pinholes to<br />
flowing sodium has led to<br />
caustic corrosion resulting in<br />
wall thinning and dissolution of<br />
the material causing failure of<br />
the bellows. Hence, it is<br />
recommended that the bellows<br />
should be stress relieved prior<br />
to service to avoid strain<br />
induced martensite which<br />
causes low temperature<br />
sensitization.<br />
Fig. 1 Sensitized microstructure in<br />
the outer ply<br />
Fig. 2 Microstructure with fine<br />
de<strong>for</strong>mation twins in the inner ply<br />
R&D FOR FBRs 43
IGC<br />
<strong>Annual</strong> <strong>Report</strong> 2007<br />
III.C. Core and Structural Materials<br />
III.C.1. Effect of Titanium on Creep Properties of 14Cr-15Ni -Ti<br />
Stabilised Austenitic Stainless Steel<br />
For the initial core of PFBR,<br />
the structural material chosen<br />
<strong>for</strong> clad and wrapper tubes is a<br />
20% cold worked 14Cr-15Ni-Ti<br />
stabilised austenitic stainless<br />
steel (SS). The target burn-up of<br />
fuel is 100,000 MWd/t. For<br />
future cores of PFBR, it is<br />
envisaged to use a material of<br />
lower swelling so that fuel burnup<br />
of about 150,000 MWd/t<br />
can be achieved. Towards this,<br />
a modified composition of<br />
14Cr-15Ni-Ti stabilised SS<br />
(designated as D9I) is being<br />
developed by adjusting the<br />
amounts of the minor elements<br />
such as titanium, silicon and<br />
phosphorous. These elements<br />
have a strong influence on void<br />
swelling of austenitic SS. Since<br />
void swelling and thermal creep<br />
are the most important<br />
considerations <strong>for</strong> core<br />
structural materials <strong>for</strong> FBRs,<br />
the influence of these elements<br />
on the thermal creep properties<br />
has been systematically studied<br />
by varying titanium in the range<br />
of 0.16 to 0.30 wt%, silicon in<br />
the range 0.75 and 0.95 wt %<br />
and phosphorous in the range<br />
of 0.025 to 0.04 wt%. The<br />
amount of carbon in these<br />
heats was kept unchanged at a<br />
level of about 0.04 wt% and<br />
this corresponded to Ti/C ratio<br />
in the range of 3.8 to 8.6 <strong>for</strong><br />
the whole range of titanium<br />
content. Fifteen laboratory<br />
heats of D9I SS were prepared<br />
by vacuum induction melting of<br />
high purity electrolytic grade<br />
raw materials, followed by<br />
vacuum arc remelting (VAR)<br />
process. The VAR ingots were<br />
hot <strong>for</strong>ged and then hot rolled<br />
into plates of 12 mm thickness,<br />
subsequently solution annealed<br />
in the temperature range of<br />
1323-1423 K, pickled and<br />
passivated. The average grain<br />
size of the material was 40±7<br />
microns. The chemical<br />
composition of the four heats<br />
and the specifications <strong>for</strong> D9I<br />
SS is given in Table 1.<br />
Creep properties<br />
The influence of titanium<br />
content on creep properties has<br />
been studied at 973 K at<br />
different stress levels in the<br />
range of 150 to 250 MPa. Fig.<br />
1 is a comparison of the creep<br />
curves of the four heats with<br />
various titanium contents.<br />
Maximum rupture life was<br />
obtained <strong>for</strong> titanium content in<br />
the range of 0.22 to 0.24 wt%;<br />
rupture life decreased by<br />
increasing or decreasing the<br />
amount of titanium from 0.23<br />
wt%. The peak in rupture life<br />
was more pronounced at lower<br />
creep stresses as shown in<br />
Fig.2. The silicon content was<br />
Table 1: Chemical composition and titanium to carbon ratio (Ti/C)<br />
of D9I SS heats.<br />
0.75 wt% and phosphorous<br />
content was 0.025 wt% in all<br />
these heats. The element<br />
titanium is a strong carbide<br />
<strong>for</strong>mer (TiC). Since carbide<br />
precipitate has a strong<br />
influence on creep properties,<br />
Creep strain, %<br />
12<br />
10<br />
8<br />
6<br />
4<br />
2<br />
0<br />
Ti=0.18<br />
Ti=0.23<br />
Ti=0.25<br />
Ti=0.36<br />
973 K/ 175 MPa<br />
1000 2000 3000 4000 5000 6000<br />
Time, h<br />
Fig.1 Influence of titanium on creep<br />
curves of D9 I SS.<br />
44 R&D FOR FBRs
IGC<br />
<strong>Annual</strong> <strong>Report</strong> 2007<br />
Rupture life,h<br />
1000<br />
Ti/C<br />
4 5 6 7 8 9 10<br />
973 K<br />
100<br />
0.16 0.20 0.24 0.28 0.32 0.36 0.40<br />
Titanium, wt%<br />
250 MPa<br />
200 MPa<br />
175 MPa<br />
Fig.2 Influence of titanium on creep<br />
rupture life of D9I SS (phosphorous =<br />
0.025 wt%, silicon = 0.75 wt% and<br />
carbon = 0.04 wt %).<br />
Ti/C ratio is considered an<br />
important parameter to assess<br />
the influence of titanium. From<br />
Fig. 2, it is seen that Ti/C ratio<br />
of 5.5 to 6 provides maximum<br />
creep strength in D9I SS<br />
containing 0.025 wt%<br />
phosphorous and 0.75 wt%<br />
silicon. The variation of<br />
minimum creep rate with<br />
titanium content also showed a<br />
minimum value corresponding<br />
to 0.22 to 0.24 wt% titanium<br />
(Fig. 3). Creep rupture ductility<br />
generally decreased with<br />
increase in titanium content.<br />
Minimum creep rate, s-1<br />
250 MPa<br />
200 MPa<br />
175 MPa<br />
10 -8 973 K<br />
10 -9<br />
10 -10<br />
0.20 0.25 0.30 0.35 0.40<br />
Titanium, wt%<br />
(b)<br />
Fig.3 Influence of titanium on<br />
minimum creep rate of D9I SS<br />
(phosphorous = 0.025 wt%, silicon =<br />
0.75 wt% and carbon = 0.04 wt %).<br />
III.C.2. Effect of Titanium on the Void Swelling<br />
Behavior in (15Ni-14Cr)-Ti Modified Austenitic Steels<br />
Studied by Ion Beam Simulation - Step Height and<br />
Positron Lifetime Studies<br />
One of the important property<br />
changes caused by irradiation<br />
in the fast reactor structural<br />
materials is void swelling. The<br />
dimensional changes<br />
introduced by void swelling<br />
limits the lifetime of structural<br />
components used in a reactor.<br />
There<strong>for</strong>e, resistance to void<br />
swelling is a major<br />
consideration in the choice of<br />
materials <strong>for</strong> the core<br />
components. The titanium<br />
modified steels exhibit greatly<br />
improved swelling resistance<br />
under breeder reactor<br />
conditions and consequently,<br />
have become a prime<br />
candidates <strong>for</strong> structural<br />
applications. Titanium modified<br />
(15Ni, 14Cr) steel and its<br />
improved versions with<br />
phosphorous additions<br />
(designated as D9 and D9I) are<br />
envisaged <strong>for</strong> use as fuel<br />
cladding and wrapper materials<br />
in Indian fast breeder reactor<br />
(FBR) programme. Accelerated<br />
heavy ions which have the<br />
inherent advantage of<br />
producing high displacement<br />
rates have been used <strong>for</strong><br />
evaluating the effect of minor<br />
alloying elements.<br />
The void swelling behavior of<br />
two steels: (A) (15Ni-14Cr)-<br />
0.25Ti and (B) (15Ni-14Cr)-<br />
0.15Ti were studied using<br />
heavy ion irradiation <strong>for</strong><br />
understanding the influence of<br />
titanium in the void swelling<br />
resistance of the alloys .The<br />
cold worked samples were preimplanted<br />
with a uni<strong>for</strong>m<br />
helium concentration of 30<br />
appm. This was followed by a 5<br />
MeV nickel ion irradiation to<br />
create a peak damage of ~<br />
100 dpa at damage rate of 7<br />
x10 -3 dpa/s at various<br />
irradiation temperatures<br />
between 700 and 970 K. The<br />
gross swelling in the specimen<br />
R&D FOR FBRs 45
IGC<br />
<strong>Annual</strong> <strong>Report</strong> 2007<br />
was determined by step height<br />
measurements. Figure 1 shows<br />
the void swelling in the two<br />
alloys as a function of the<br />
irradiation temperature. It is<br />
found that the peak swelling<br />
temperatures and the<br />
magnitude of swelling <strong>for</strong> the<br />
two alloys are different.<br />
Whereas the alloy with 0.15%<br />
Ti displayed a swelling of<br />
~15% at the peak swelling<br />
temperature of 923 K, the alloy<br />
with 0.25% Ti has a swelling<br />
maximum of ~ 4% at 823 K.<br />
With similar thermomechanical<br />
treatment effected<br />
on both the alloys the<br />
difference in void swelling<br />
behavior is solely due to the<br />
effect of chemical composition.<br />
In order understand the<br />
drastically different behaviour<br />
of the two alloys with regard to<br />
void swelling, the TiC<br />
precipitate <strong>for</strong>mation in these<br />
two alloys was studied by<br />
positron lifetime measurements.<br />
The un-irradiated alloys were<br />
subjected to isochronal<br />
annealing and the positron life<br />
time was measured after each<br />
annealing. These alloys show<br />
different TiC precipitate<br />
<strong>for</strong>mation behavior (Fig.2). The<br />
observed variation of lifetime τ<br />
displays distinct stages viz., a<br />
monotonic decrease in τ from<br />
the initial cold worked state<br />
upto ~900 K in alloy B and ~<br />
800 K in alloy A. This is<br />
followed by a stage where there<br />
is an increase in lifetime to<br />
saturation, followed by a<br />
decrease in lifetime. The first<br />
stage corresponds to point<br />
defect recovery arising out of<br />
the migration of vacancies to<br />
sinks such as dislocations .The<br />
subsequent stage where there is<br />
an increase in lifetime τ is the<br />
result of positron trapping by<br />
the TiC precipitate which <strong>for</strong>ms<br />
during the heat treatment. The<br />
increase in average lifetime of<br />
positrons in this stage <strong>for</strong> alloy<br />
A in comparison to alloy B is<br />
due to the higher number<br />
density of TiC precipitates in the<br />
<strong>for</strong>mer. The observed lower<br />
void swelling in alloy A can be<br />
attributed to the higher number<br />
density of TiC precipitates .It is<br />
further seen (Fig.2) that there is<br />
a difference in the onset of TiC<br />
precipitation by 100K between<br />
the two alloys. The Shift in the<br />
peaking swelling temperature<br />
can be attributed to the<br />
difference in the onset<br />
temperature <strong>for</strong> TiC<br />
precipitation <strong>for</strong> the two alloys.<br />
Thus, positron lifetime<br />
measurements helps to<br />
rationalize the different swelling<br />
behavior in alloys with different<br />
Ti concentrations.<br />
Fig.1 Temperature dependence of void swelling measured<br />
by surface profilometry <strong>for</strong> the D9alloys with different<br />
titanium concentration<br />
Fig.2 Variation of positron life time with annealing<br />
temperature <strong>for</strong> the cold -worked D9 alloys with<br />
different titanium concentration, alloy A (Ti / C = 6) and<br />
alloy B (Ti /C = 4)<br />
46 R&D FOR FBRs
IGC<br />
<strong>Annual</strong> <strong>Report</strong> 2007<br />
III.C.3. Improvement of Mechanical Properties of<br />
Modified 9Cr-1Mo Steel by Heat Treatment<br />
Modified 9Cr-1Mo steel is<br />
ferritic steel, used extensively in<br />
the standard normalized and<br />
tempered condition (20-30µm<br />
grain size) in fossil power<br />
plants, steam generator of<br />
PFBR, petrochemical industries<br />
and many other heat transport<br />
systems due to its good<br />
mechanical properties up to<br />
823 K and physical properties.<br />
However, the weldments of<br />
these steels are susceptible to<br />
Type IV cracking during service<br />
due to its low creep strength of<br />
the inter-critical heat affected<br />
zone (ICHAZ). Improvement of<br />
Type IV cracking resistance of<br />
these steels by alloying<br />
additions has been suggested<br />
by many authors. In the present<br />
work, it has been shown that<br />
increase in prior austenite grain<br />
size of the modified 9Cr-1Mo<br />
steel by heat treatment<br />
increases the room temperature<br />
and higher temperature yield<br />
strength (Fig. 1) by ~25%<br />
without significantly effecting<br />
the tensile ductility. Increase in<br />
heat treatment temperature<br />
results in increase in grain size<br />
of the material and supersaturated<br />
solid solution of<br />
carbon and alloying elements.<br />
This could be the reason <strong>for</strong><br />
increase in strength of the<br />
material in the higher<br />
normalization temperature and<br />
tempering condition. It is<br />
interesting to observe that yield<br />
strength of the weld joints made<br />
with these large prior austenite<br />
grain size materials also<br />
increases (Fig. 2) in same<br />
magnitude at room<br />
temperature and high<br />
temperature.<br />
The increase in yield and<br />
tensile strength of the weld<br />
joints can be correlated with<br />
increase in hardness of the<br />
ICHAZs in the higher grain size<br />
material. It can be mentioned<br />
here that hardness of the<br />
ICHAZ in weld joint, which was<br />
made with 120µm grain size<br />
base metal is increased by 20<br />
VHN 200g . The microstructure<br />
observation shows that<br />
presence of martensite in this<br />
zone could be the reason <strong>for</strong><br />
increase in hardness of this<br />
zone. This is further reflected in<br />
the tensile tested weld joints.<br />
The radial profile of tensile<br />
tested specimen shows two<br />
necking (Fig. 3) when the weld<br />
joint was made with 20-30 µm<br />
grain size material, which was<br />
absent when it was made with<br />
120µm grain size material. This<br />
clearly showed that larger grain<br />
sizes can affect the de<strong>for</strong>mation<br />
behavior of cross weld tensile<br />
specimen. The hardness profile<br />
taken from one side of the<br />
tensile tested specimen to the<br />
other side of the specimen<br />
shows that hardness increases<br />
in the broken side of the<br />
specimen when weld joint was<br />
made with 120 µm grain size<br />
material but it decreases when<br />
it was made with 20-30 µm<br />
grain size material (Fig.4),<br />
clearly indicating <strong>for</strong>mer<br />
780<br />
770<br />
760<br />
750<br />
740<br />
730<br />
720<br />
710<br />
700<br />
690<br />
680<br />
670<br />
660<br />
650<br />
640<br />
630<br />
620<br />
1340 1360 1380 1400 1420 1440 1460 1480<br />
Yield Strength, MPa<br />
Yield Strength<br />
UTS<br />
Normalising temperature, K<br />
Fig.1 Change of tensile strength of<br />
base metal with normalizing<br />
temperature in the 1033K/3h<br />
tempered condition (UTS: ultimate<br />
tensile strength)<br />
600<br />
500<br />
400<br />
300<br />
200<br />
100<br />
0<br />
RT<br />
550 0 C<br />
20-30µm<br />
120µm<br />
140µm<br />
Weld Joint<br />
Fig.2 Change of tensile strength of<br />
weld joints with normalizing<br />
temperature in the 1033K/3h<br />
tempered condition<br />
R&D FOR FBRs 47
IGC<br />
<strong>Annual</strong> <strong>Report</strong> 2007<br />
Radius profile, mm<br />
3.0<br />
2.8<br />
2.6<br />
2.4<br />
2.2<br />
2.0<br />
1.8<br />
1.6<br />
1.4<br />
20-30µm<br />
120µm<br />
0 5 10 15 20 25<br />
Distance along the specimen gauge length, mm<br />
Fig.3 Radial profile from the<br />
un-broken side of tensile tested<br />
specimen to un-broken side<br />
Hardness, VHN 200 g<br />
330<br />
320<br />
20-30µm<br />
310<br />
120µm<br />
300<br />
290<br />
280<br />
270<br />
260<br />
250<br />
240<br />
230<br />
220<br />
-2 0 2 4 6 8 10 12 14 16 18 20 22<br />
Distance from un-broken to broken location, mm<br />
Fig.4 Hardness profile from<br />
un-broken to broken side of tensile<br />
tested specimen<br />
material is undergoing<br />
hardening and latter material is<br />
undergoing softening with<br />
microstructure modification.<br />
The present result clearly<br />
shows that increase in prior<br />
austenite grain size has<br />
significant effect on mechanical<br />
properties of the material and<br />
its weld joints.<br />
III.C.4. Verification of the Applicability of the<br />
Invariant Shape Master Curve Hypothesis under Dynamic<br />
Loading Condition at the Ductile-Brittle Transition<br />
Temperature Regime of 9Cr-1Mo Steel<br />
The fracture toughness of<br />
ferritic steels in the ductilebrittle<br />
transition temperature<br />
(DBTT) regime is subjected to<br />
inherent scatter as the<br />
associated cleavage fracture<br />
initiation is predominated by<br />
randomly distributed brittle<br />
precipitates, inclusions, weak<br />
lath boundaries etc., generally<br />
referred to as 'weakest links', in<br />
the region of highest stress<br />
buildup. A schematic of this<br />
mechanism is shown in Fig. 1.<br />
To take into account this<br />
scatter in predicting a DBTT of<br />
engineering sense, a 3-<br />
parameter Weibull distribution<br />
model, as given in Eqn.1, is<br />
used in ASTM E 1921 to define<br />
a term called 'Reference<br />
Temperature (T 0 )' at which the<br />
median fracture toughness<br />
(median: cumulative probability<br />
P ƒ = 0.5) is 100 MPa.m 0.5 <strong>for</strong> a<br />
specimen of one inch<br />
equivalent thickness.<br />
P f =1-exp{-[(K JC -K min )/(K 0 -<br />
K min )] b }<br />
……..(1)<br />
T 0<br />
is a material specific<br />
parameter and used in indexing<br />
the Master Curve, claiming to<br />
follow an invariant shape in<br />
describing the fracture<br />
toughness variation of all the<br />
BCC metals in their DBTT<br />
regime. The Master Curve<br />
equation, as given in ASTM E<br />
1921 is shown in Eqn. 2.<br />
KJC(median)=30+70exp(0.019<br />
(T-T 0 ))<br />
……..(2)<br />
The invariant shape Master<br />
Curve hypothesis has been<br />
found to hold good <strong>for</strong> quasi<br />
static condition of loading.<br />
However under dynamic<br />
loading condition, along with<br />
the extra inertial component<br />
towards crack initiation, the<br />
rate-sensitive material flow<br />
properties elevate the crack<br />
front stresses, suppress<br />
Cleavage Cracking Mechanism<br />
Fatigue<br />
Crack<br />
Front<br />
Z<br />
σnom<br />
σYd<br />
l*<br />
Y<br />
σ f*<br />
Profile of σyy<br />
cleavage lines<br />
randomly distributed carbides on cracking plane<br />
Fig.1 Schematic representation of<br />
the mechanism of cleavage<br />
cracking in DBTT regime<br />
X<br />
48 R&D FOR FBRs
IGC<br />
<strong>Annual</strong> <strong>Report</strong> 2007<br />
K Jd<br />
, MPa.m 0.5<br />
350<br />
300<br />
250<br />
200<br />
150<br />
100<br />
50<br />
9Cr-1Mo Base Metal<br />
K Jd<br />
from Inst. PCVN testing at 1.12 m/s<br />
Master Curve plotted with T 0 dy = -45 O C<br />
[ASTM E-1921(05)]<br />
Validity Limit Line<br />
0<br />
215.5 218 220.5 223 225.5 228 230.5<br />
plasticity, increase constraint<br />
and thus reduce fracture<br />
toughness. This combined<br />
effect has raised speculation<br />
regarding the adoption of the<br />
quasi static Master Curve shape<br />
even in dynamic situation and it<br />
needs to be experimentally<br />
resolved. Experimental<br />
verification of this aspect has<br />
been carried out with plain<br />
9Cr-1Mo steel. It may be noted<br />
that the 9Cr-1Mo steel is one of<br />
the candidate materials <strong>for</strong><br />
wrapper in future Fast Breeder<br />
Reactors aiming a burn up<br />
>200,000 MWD/t. To this end,<br />
predicting dynamic fracture<br />
toughness based reference<br />
dy<br />
temperature (T 0 ) is important<br />
<strong>for</strong> ensuring the integrity of<br />
critical component under<br />
accidental/dynamic loading<br />
scenario.<br />
Dynamic fracture toughness<br />
(K Jd ) of plain 9Cr-1Mo steel has<br />
Temperature, K<br />
p f<br />
=0.98<br />
p f<br />
=0.5<br />
p f<br />
=0.02<br />
Fig.2 Dynamic fracture toughness results of 9Cr-1Mo steel with respect to the<br />
ASTM E 1921 master curve<br />
been determined from<br />
instrumented impact testing<br />
with pre-crackled Charpy<br />
specimens. The dynamic<br />
loading gives rise to inertial<br />
oscillations in the specimen<br />
originating from interactions of<br />
<strong>for</strong>ward and reflected stress<br />
waves. Towards getting a load<br />
signal with minimum oscillation<br />
effects, testing has been<br />
conducted at a reduced<br />
loading rate (~1.12 m/s). The<br />
calculated stress intensity factor<br />
has been ~10 6 Mpa.m 0.5 /s,<br />
which is well regarded as a<br />
dynamic situation. It has been<br />
noticed that increase in loading<br />
rate up to 5.12 m/s, the<br />
maximum capacity of the<br />
available Charpy machine,<br />
affects the stress intensity factor<br />
rate only marginally.<br />
At temperatures of 213, 218,<br />
220.5, 223, 225.5, 228 and -<br />
dy<br />
233 K, T 0 have been<br />
determined to be 225.85,<br />
227.25, 210.91, 208.87 and<br />
209.53 K respectively. If the<br />
same invariance of the Master<br />
Curve holds good even in this<br />
high loading rate then<br />
dy<br />
theoretically, the T 0 results<br />
obtained from all the test<br />
temperatures within the DBTT<br />
regime would show the same<br />
dy<br />
values. Apparently, the T 0<br />
values show differences in the<br />
present campaign. However,<br />
taking into account the<br />
experimental uncertainties<br />
involved in a dynamic fracture<br />
toughness evaluation<br />
procedure, it is reasonable to<br />
dy<br />
say that the T 0 remains<br />
practically unchanged (±10 K)<br />
within the DBTT regime. The<br />
dy<br />
lower T 0 values at the higher<br />
test temperatures can be<br />
attributed to the loss of<br />
constraints at the crack tip.<br />
Thus, it is proposed that the<br />
same invariant shape of the<br />
Master Curve describing the<br />
fracture toughness variation<br />
under quasi-static condition<br />
also can be applied in the high<br />
dy<br />
strain rate loading. The T 0 of<br />
the 9Cr-1Mo steel is<br />
conservatively predicted as of -<br />
228 K and the same has been<br />
chosen to index the Master<br />
Curve, as shown in Fig. 2.<br />
Except a few, the individual<br />
dynamic fracture toughness<br />
data has been seen to lie well<br />
within the 98% and 2%<br />
confidence limit.<br />
R&D FOR FBRs 49
IGC<br />
<strong>Annual</strong> <strong>Report</strong> 2007<br />
III.C.5. Low Cycle Fatigue Behaviour of 316<br />
SS Weld Metal and Modified 9Cr-1Mo Weld Joints<br />
The effect of thermal ageing<br />
(823 K / 10000h and 873 K /<br />
10000h) on strain controlled<br />
fatigue behaviour of 316 SS<br />
weldmetal was investigated at<br />
823 and 873 K. The aged weld<br />
metal showed lower fatigue life<br />
compared to unaged weld<br />
Plastic strain amplitude, ∆ε p<br />
/2<br />
10 -2 316SS Weld metal<br />
Temperature : 873 K<br />
Strain rate : 3 x 10 -3 s -1<br />
10 -3<br />
316 weld metal (unaged)<br />
316 weld metal (aged)<br />
10 3 10 4<br />
Number of reversals to failure, 2N f<br />
Fig.1 Comparison of fatigue life of<br />
aged and unaged 316weld<br />
metal, 873 K.<br />
metal in the temperature range<br />
823-873 K, Fig. 1.<br />
The use of liquid sodium as a<br />
heat transfer medium in fast<br />
breeder reactors necessitates<br />
the assessment of the creep,<br />
low cycle fatigue and creepfatigue<br />
interaction properties of<br />
structural materials in flowing<br />
sodium. The fatigue life of<br />
indigenous modified 9Cr-1Mo<br />
steel weld joints tested in<br />
flowing sodium were compared<br />
with that in air at 823 and 873<br />
K. Fig. 2 shows the fatigue life<br />
of Mod.9Cr-1Mo steel weld<br />
joint in high purity sodium (less<br />
than 2 ppm of oxygen)<br />
compared with that in air at<br />
823 K. Fatigue life in sodium<br />
environment was significantly<br />
higher compared to that<br />
obtained in air at both the<br />
temperatures. The lack of<br />
oxidation in sodium<br />
environment is considered to be<br />
responsible <strong>for</strong> delayed fatigue<br />
crack initiation and<br />
propagation with associated<br />
increase in fatigue life.<br />
Total Strain Amplitude<br />
0.01<br />
Flowing Sodium<br />
Air<br />
Mod. 9Cr-1Mo Weld Joint<br />
Strain Rate : 3 x 10 -3 s -1<br />
Temperature : 823 K<br />
100 1000 10000<br />
Number of Reversals to failure, 2N f<br />
Fig.2 Strain-life plots at 823 K <strong>for</strong><br />
Modified 9Cr-1Mo weld joint in air<br />
and flowing sodium<br />
III.C.6. Mechanical Properties and<br />
Microstructural Studies on Irradiated SS316 Wrapper<br />
The irradiation experience<br />
worldwide has proved that the<br />
main factor affecting high fuel<br />
burn-up in fast reactors is<br />
related to the irradiation<br />
damage of the structural<br />
materials. To understand the<br />
irradiation per<strong>for</strong>mance of the<br />
Stainless Steel SS316 in FBTR at<br />
various levels of displacement<br />
damage (dpa- displacement<br />
per atom), mechanical testing<br />
and TEM (Transmission Electron<br />
Microscopy) studies have been<br />
carried out.<br />
The mechanical properties of<br />
irradiated SS 316 cladding are<br />
evaluated by conventional<br />
tensile testing carried out<br />
remotely in the hot cells of<br />
Radio Metallurgy Laboratory<br />
(RML). For evaluating the<br />
mechanical property changes in<br />
50 R&D FOR FBRs
IGC<br />
<strong>Annual</strong> <strong>Report</strong> 2007<br />
8mm diameter<br />
1 mm thick<br />
Hollow<br />
end mill tool<br />
Fig.1 Specimen Extraction Inside hot cells<br />
irradiated wrapper, small<br />
specimen test techniques have<br />
been evolved. The small<br />
specimen test techniques<br />
enable the characterization of<br />
mechanical behaviour using<br />
extremely small volume of the<br />
material. By using small<br />
specimens <strong>for</strong> testing irradiated<br />
materials, the radiation dose<br />
levels drastically decrease in<br />
proportion to its volume and it<br />
becomes possible to take them<br />
out of the hot cells and conduct<br />
mechanical testing in<br />
comparatively simple shielded<br />
enclosures with reduced<br />
radiological hazards.<br />
The Shear punch (ShP) testing<br />
is a small specimen testing<br />
technique, in which a<br />
cylindrical punch with a flat end<br />
is <strong>for</strong>ced to punch a hole in a<br />
clamped small disk specimen of<br />
1 mm thick and 8 mm<br />
diameter. The loaddisplacement<br />
curve obtained<br />
during the ShP test is similar to<br />
that of the conventional tensile<br />
test and is analyzed to evaluate<br />
the uniaxial tensile properties<br />
like yield strength (YS), Ultimate<br />
Tensile Strength (UTS) and %<br />
elongation. The shear punch<br />
tests were standardized <strong>for</strong><br />
SS316 wrapper material using<br />
different cold rolled<br />
microstructures (30%, 35%, 40<br />
%, 50% & 60% cold worked)<br />
and a solution annealed<br />
microstructure of the virgin<br />
material. By carrying out both<br />
tensile and shear punch on<br />
generated microstructural<br />
conditions, tensile-shear punch<br />
correlation equations <strong>for</strong><br />
strength and ductility<br />
parameters have been<br />
determined.<br />
For estimating the tensile<br />
properties of the irradiated<br />
SS316 wrapper, small<br />
specimens of 8 mm diameter<br />
and 1 mm thick were extracted<br />
using a specially designed<br />
hollow end mill tool at different<br />
locations along the length of<br />
the irradiated wrapper<br />
corresponding to dpa<br />
(displacement per atom)<br />
varying from 2 to 56 (Fig.1).<br />
Shear punch test was carried<br />
out on these highly irradiated<br />
small specimens in mechanical<br />
test machines outside the hot<br />
cells with local lead shielding<br />
surrounding them and the<br />
conventional tensile properties<br />
were estimated using the<br />
derived correlations (Fig. 2).<br />
Disc specimens of 3 mm<br />
diameter obtained after shear<br />
punch testing were used <strong>for</strong><br />
preparing TEM specimens <strong>for</strong><br />
structure-property correlation<br />
R&D FOR FBRs 51
IGC<br />
<strong>Annual</strong> <strong>Report</strong> 2007<br />
Fig.2 Shear punch testing of irradiated SS316 specimens (a) test setup (b) load-displacement<br />
plots showing increase in the maximum load with increasing dpa<br />
studies. Prior to preparation of<br />
irradiated specimens, extensive<br />
trials were carried out with<br />
unirradiated specimens to<br />
optimize the pre-thinning and<br />
electrolytic<br />
thinning<br />
parameters. TEM specimens<br />
were prepared using special<br />
fixtures developed <strong>for</strong> handling<br />
irradiated specimens.<br />
Irradiated specimens which had<br />
undergone displacement<br />
damage from 2 dpa to 56 dpa<br />
have been examined using 200<br />
keV Analytical TEM.<br />
A considerable increase in<br />
the strength and decrease in<br />
the ductility of the wrapper with<br />
increasing displacement per<br />
atom (dpa) have been observed<br />
from the small specimen<br />
mechanical tests. The<br />
transmission electron<br />
microscopic studies revealed<br />
the presence of voids and<br />
precipitates in the matrix (Fig<br />
3). Precipitates were identified<br />
to be of M23C6 type and<br />
precipitation of second phases<br />
corroborates the hardening<br />
observed on the wrapper.<br />
Precipitates<br />
Voids<br />
Fig.3 TEM image of the irradiated SS316 at a displacement damage of 40 dpa<br />
52 R&D FOR FBRs
IGC<br />
<strong>Annual</strong> <strong>Report</strong> 2007<br />
III.C.7. High Temperature Fretting Wear Studies on<br />
Stainless Steel Type AISI 316LN<br />
In Fast Breeder Reactor,<br />
stainless steel tubes supported<br />
on stainless steel rollers are<br />
being used in the primary heat<br />
exchanger <strong>for</strong> transferring heat<br />
from radioactive sodium to<br />
sodium in the secondary circuit.<br />
Because of the flow induced<br />
vibration as a result of the flow<br />
of sodium the tubes and roller<br />
joints undergo fretting wear,<br />
which is a serious concern<br />
because of the presence of<br />
radioactive sodium in the heat<br />
exchanger. The role of<br />
environment especially that of<br />
temperature and the frequency<br />
of fretting wear of stainless steel<br />
is not well understood in the<br />
literature. Hence an in-depth<br />
study was takenup to<br />
characterise the fretting wear<br />
behaviour of stainless steel and<br />
stainless steel pairs. The fretting<br />
wear studies of stainless steel<br />
type AISI 316LN against<br />
Stainless steel type AISI 316LN<br />
23.2 o<br />
were conducted under various<br />
operating conditions such as<br />
load (10 N and 50N),<br />
frequency (25 Hz, 75 Hz and<br />
125 Hz) and temperature (623,<br />
783 and 823 K). Temperature<br />
was the main variable input<br />
parameter while coefficient of<br />
friction (µ) and wear were the<br />
output parameters. It was<br />
observed that µ did not depend<br />
appreciably on load, frequency<br />
or temperature while wear rate<br />
showed high dependency on<br />
these parameters. Influence of<br />
temperature on wear depended<br />
on the frequency selected. For<br />
higher frequency of oscillation<br />
(125 Hz and 75 Hz), wear rate<br />
reduced with increase in<br />
temperature from 623 to<br />
823 K. For 25 Hz, however, it<br />
increased with temperature<br />
possibly because of fretting<br />
fatigue. The wear rate was<br />
observed to be maximum at<br />
75Hz. On other hand, wear<br />
30.83 N/mm 2<br />
24.7 o<br />
13.56 N/mm 2<br />
Maximum Shear Plane<br />
Fig.1 Microstructure of the sample tested at 823 K, 125 Hz and 70 N load<br />
shows the evidence of crack because of shear de<strong>for</strong>mation<br />
rate decreased as load<br />
increased.<br />
Further,<br />
microstructural examinations<br />
were conducted on the worn<br />
samples to analyze the wear<br />
behaviour and to understand<br />
the wear mechanisms. The<br />
microstructural examinations at<br />
SEM level revealed that the<br />
failure (i.e., the cracking and<br />
thus removal of material) on<br />
stainless steel 316LN is due to<br />
fatigue at lower frequencies.<br />
The interesting new observation<br />
is that adiabatic shear<br />
de<strong>for</strong>mation (Fig. 1) and<br />
crushing are responsible <strong>for</strong> the<br />
failure at higher loads and<br />
higher frequencies.<br />
A typical microstructure is<br />
given in Fig. 2(a) and the crack<br />
propagates perpendicular to<br />
the shear bands and the<br />
material fractures. Fig. 2(b)<br />
shows the fractured grain in<br />
which the fracture is<br />
perpendicular to the shear<br />
bands. These shear bands are<br />
observed to be perpendicular<br />
to the motion of the pin. The<br />
above observations revealed<br />
that at low 623 K and at 25 Hz<br />
the material failure is due to<br />
fatigue. The microstructure of<br />
the sample tested at 25 Hz and<br />
350 Hz under a load of 100N<br />
R&D FOR FBRs 53
IGC<br />
<strong>Annual</strong> <strong>Report</strong> 2007<br />
(a)<br />
(c)<br />
Fig.2 Microstructure of the sample tested at 623 K (a) and (b) at 25 Hz and 50N<br />
load showing the presence of fatigue cracks. (a) Initiation of fracture in a grain<br />
containing the shear bands. (b) Fractured grain in which the fracture has<br />
occurred perpendicular to the shear bands. (c) At 25 Hz and at 100L and (d) (d)<br />
623 K, 125 Hz and 50N<br />
(a)<br />
(c)<br />
Fig.3 (a) and (b) Microstructures of the sample tested at 823 K, 125 Hz and<br />
100 N load showing the presence of oxide particles in the scar and (c)<br />
Topography of the scar measured using 3-D profilometer showing a layer of<br />
material of about 2 mm thickness on the scar<br />
(b)<br />
(d)<br />
(b)<br />
is given in Fig. 2 (c), which<br />
indicates shear bands and<br />
cracks perpendicular to shear<br />
bands. Hence at temperature<br />
623 K and at 25 Hz the failure<br />
of the material is by fatigue.<br />
Fig.2(d) presents the<br />
microstructure of the scar of the<br />
sample tested at 623 K, 125 Hz<br />
at 50N. The above figure<br />
indicates presence of oxide<br />
particle and glazed surface and<br />
absence of fatigue cracks. The<br />
particles and cracks in Fig. 2(d)<br />
could be due to the crushing<br />
failure of oxide particles.<br />
Another interesting<br />
observation is that the wear<br />
rate at 823 K is higher at 75 Hz<br />
than at 25 Hz and 125 Hz.<br />
During de<strong>for</strong>mation the work<br />
hardening tendency is high <strong>for</strong><br />
316LN material and it<br />
undergoes dynamic recovery at<br />
temperatures<br />
above<br />
973 K at strain rates lower than<br />
0.1 s -1 . At 25 Hz the<br />
micrograph exhibits severe<br />
plastic de<strong>for</strong>mation. The lower<br />
speed of de<strong>for</strong>mation (~5 s -1 )<br />
helps the material to recover,<br />
which reduces the degree of<br />
strengthening due to work<br />
hardening and results in softer<br />
material that accommodates<br />
plastic de<strong>for</strong>mation. Since the<br />
material is ductile and<br />
plastically de<strong>for</strong>m without<br />
fracture at 25 Hz the wear rate<br />
is observed to be low. As the<br />
de<strong>for</strong>mation speed is higher<br />
54 R&D FOR FBRs
IGC<br />
<strong>Annual</strong> <strong>Report</strong> 2007<br />
(~15 s -1 ) than at 25 Hz, the<br />
de<strong>for</strong>mation leads to work<br />
hardening and reduces the<br />
tendency <strong>for</strong> recovery process.<br />
This situation makes the<br />
material less ductile and leads<br />
to fracturing of the material.<br />
The harder material at the<br />
surface results in surface cracks<br />
and material removal. In view<br />
of the above, the wear is high<br />
at 75 Hz. At 125 Hz, the higher<br />
de<strong>for</strong>mation speed (~25 s -1 )<br />
results in higher temperature at<br />
the tip of the pin. The<br />
calculated rise in the<br />
temperature is above<br />
1223 K. This increase in<br />
temperature induces the<br />
oxidation of the surface. The<br />
oxide layer thus <strong>for</strong>med on the<br />
sliding surfaces <strong>for</strong>ms a glazing<br />
layer. Moreover, the oxide layer<br />
is stronger than that of the base<br />
material. Because of the<br />
presence of glazed layer the<br />
wear rate is low at 125Hz. Fig.<br />
3(a-b) reveals the presence of<br />
oxide particles in the<br />
microstructure of the wear scar.<br />
The Topography of the scar was<br />
examined using 3D surface<br />
profilometer and it is presented<br />
in Fig. 3(c). Fig. 3(c) shows that<br />
the scar was covered with a<br />
layer of material of about 2 mm<br />
thickness. This layer could be<br />
oxide layer. Tests were also<br />
per<strong>for</strong>med at a load of 100 N<br />
at 125 Hz and at 823 K to<br />
confirm the influence of heat<br />
generated during fretting on the<br />
<strong>for</strong>mation of oxide layers.<br />
The above observations<br />
reveal that the wear rate is<br />
higher at 125 Hz. In the steam<br />
generator of PFBR, the level of<br />
oxygen is 2 ppm hence, it is<br />
essential to carry out insotdium<br />
tests at 125 Hz.<br />
III.C.8. Effect of Flowing Sodium on<br />
Corrosion and Tensile Properties of AISI Type 316LN<br />
Stainless Steel at 823 K<br />
Austenitic stainless steels (SS)<br />
of different grades are used as<br />
structural materials in primary<br />
circuit, IHX and piping in<br />
secondary loop of fast breeder<br />
reactors owing to their good<br />
compatibility with sodium in<br />
addition to their desirable<br />
properties of adequate high<br />
temperature mechanical<br />
properties and resistance to<br />
neutron irradiation. Sodium is<br />
used as coolant in liquid metal<br />
fast breeder reactors due to its<br />
multifaceted properties of high<br />
thermal conductivity, low<br />
vapour pressure, high boiling<br />
point, large heat capacity and<br />
low cost.<br />
Long term exposure of<br />
austenitic SS to high<br />
temperature sodium leads to<br />
mass transfer and corrosion.<br />
This corrosion is predominantly<br />
governed by the impurities<br />
present in the sodium,<br />
especially carbon and oxygen.<br />
Presence of oxygen in sodium<br />
significantly influences the<br />
corrosion processes because<br />
leaching is usually preceded by<br />
the <strong>for</strong>mation of ternary<br />
compounds of the steel<br />
constituents with oxygen and<br />
sodium. The most commonly<br />
encountered corrosion product<br />
in sodium containing less than<br />
10 ppm oxygen is NaCrO 2 . The<br />
transfer of elements from<br />
structural materials by liquid<br />
sodium is reported to influence<br />
Fig.1 Microstructure showing<br />
316modified layer<br />
R&D FOR FBRs 55
IGC<br />
<strong>Annual</strong> <strong>Report</strong> 2007<br />
Carbon content(wt%)<br />
0.14<br />
0.12<br />
0.10<br />
0.08<br />
0.06<br />
0.04<br />
type 316SS<br />
type 316LN<br />
0.02<br />
0 5 10 15 20 25 30 35<br />
Distance(µm)<br />
Fig.2 Measured carbon profile <strong>for</strong><br />
types and 316LN stainless<br />
steel exposed <strong>for</strong> 16000 hours<br />
obtained by SIMS analysis<br />
the corrosion and mechanical<br />
properties.<br />
Here we report the results of<br />
the changes in microstructure,<br />
tensile and corrosion properties<br />
of AISI type 316LN SS on<br />
exposure to high temperature<br />
liquid sodium at 823 K <strong>for</strong><br />
16000 hours and compare<br />
them with the corresponding<br />
changes in type 316 SS<br />
exposed <strong>for</strong> the same duration<br />
in high temperature liquid<br />
sodium.<br />
In both the steels, thermal<br />
ageing at 823 K caused<br />
carbide precipitation at the<br />
grain boundaries. Due to<br />
leaching of elements, there was<br />
a surface modified layer of<br />
ferrite up to around 10 µm<br />
(Fig.1) in type 316LN SS while<br />
the modified layer was up to<br />
about 15 µm in type 316 SS.<br />
The average microhardness of<br />
mill-annealed type 316LN SS<br />
was 174 VHN. Thermally aged<br />
type 316LN SS showed an<br />
average hardness of 236 VHN.<br />
An increase of nearly 50 VHN<br />
was observed nearer the<br />
surface in sodium-exposed<br />
material vis-à-vis thermally<br />
aged material. The hardness<br />
values decreased and reached<br />
the matrix value at around<br />
100µm. This increase in<br />
hardness indicated surface<br />
carburization of the material<br />
due to sodium exposure.<br />
The concentration profile of<br />
carbon determined by SIMS<br />
showed that, in type 316LN SS,<br />
the peak concentration of<br />
carbon was attained at 10 µm,<br />
immediately after the end of the<br />
degraded layer, while the bulk<br />
concentration was attained at a<br />
distance of 38 µm. In type 316<br />
SS, carbon concentration had<br />
attained a maximum of 0.135<br />
wt% at a depth of 43 µm and<br />
equaled the bulk concentration<br />
at a distance of 74 µm from the<br />
surface. The carbon content<br />
was less than the bulk<br />
concentration up to a depth<br />
where a degraded layer which<br />
contained ferrite was <strong>for</strong>med on<br />
the surface. The reduction in<br />
carbon content in the degraded<br />
layer was because the solubility<br />
of carbon in ferrite is lower<br />
resulting in carbon being<br />
rejected from the degraded<br />
layer. Comparative carbon<br />
profiles of type 316 and 316LN<br />
SS, <strong>for</strong> the period of exposure<br />
of 16000 hours, measured by<br />
SIMS analysis is shown in Fig.2.<br />
Based on the measured carbon<br />
profiles by SIMS, the probable<br />
carbon profile after 40 years<br />
(Fig.3) was predicted by<br />
calculating and using an<br />
effective diffusion coefficient.<br />
The expected carburization<br />
depth was around 260 µm <strong>for</strong><br />
type 316LN SS.<br />
Tensile test results showed an<br />
increase of 22% in yield<br />
strength (YS) and a reduction in<br />
total elongation by 33% on<br />
sodium exposure of annealed<br />
material. Thermal exposure of<br />
the annealed material at 823 K<br />
<strong>for</strong> 16000 hours, without<br />
exposure to sodium, caused an<br />
increase in YS by 8% and a<br />
decrease of 13% in total<br />
elongation. The increased<br />
changes on sodium exposure<br />
vis-a vis thermally aged<br />
condition was attributed to<br />
carburization. Similar changes<br />
in mechanical properties were<br />
observed <strong>for</strong> type 316 stainless<br />
steel.<br />
Carbon Content (wt%)<br />
0.14<br />
0.13<br />
0.12<br />
0.11<br />
0.10<br />
0.09<br />
0.08<br />
0.07<br />
0.06<br />
0.05<br />
0.04<br />
0.03<br />
type 316SS<br />
type 316LN<br />
0 50 100 150 200 250 300<br />
Distance (µm)<br />
Fig.3 Calculated carbon profile of<br />
types 316 and 316LN stainless<br />
steel after 40 years<br />
56 R&D FOR FBRs
IGC<br />
<strong>Annual</strong> <strong>Report</strong> 2007<br />
III.C.9. Effect of Metallurgical Variables on the<br />
Stress Corrosion Cracking Behaviour of<br />
AISI Type 316LN Stainless Steel<br />
High-nitrogen stainless steels<br />
(SS) are an important class of<br />
engineering materials with their<br />
better property combinations<br />
such as strength, toughness,<br />
creep resistance, nonferromagnetic<br />
behaviour,<br />
corrosion resistance and stress<br />
corrosion cracking (SCC)<br />
resistance. Sensitisation is a<br />
common problem encountered<br />
with normal grades of<br />
austenitic SS. The problem of<br />
sensitisation can be overcome<br />
by using low carbon austenitic<br />
SS. To overcome the loss of<br />
strength due to carbon<br />
reduction, nitrogen is added to<br />
these SS. For PFBR, nitrogen<br />
content is limited to 0.08 wt. %<br />
in view of improved weldability,<br />
code data availability and to<br />
minimise scatter in mechanical<br />
properties.<br />
The response of nitrogen<br />
additions to SCC is varied.<br />
Addition of nitrogen to<br />
austenitic SS could influence its<br />
SCC resistance by influencing<br />
two opposing and competing<br />
factors viz. decrease in stacking<br />
fault energy, which causes an<br />
increase in slip planarity and<br />
thus deteriorates SCC<br />
resistance, and improved<br />
passive film stability which<br />
improves SCC resistance. In the<br />
present study, AISI type 316LN<br />
SS from two different sources,<br />
hence<strong>for</strong>th referred to as SS-1<br />
and SS-2, were tested <strong>for</strong> SCC<br />
crack growth behaviour in<br />
boiling aqueous solution of 5M<br />
NaCl + 0.15M Na 2 SO 4 + 2.5<br />
ml/l HCl (b.p = 381.5 K; pH =<br />
1.3) at various values of K I<br />
(stress intensity factor). SS-2<br />
had a slightly higher Cr, Ni and<br />
Mo contents than SS-1, while<br />
the nitrogen contents were<br />
similar (0.086wt. %). SS-1 was<br />
tested <strong>for</strong> its SCC crack growth<br />
behaviour in the mill-annealed<br />
condition while SS-2 was tested<br />
in the mill-annealed, 15% cold<br />
rolled and thermally aged (973<br />
K/800 hours) conditions. The<br />
present results were compared<br />
with those of AISI types 316<br />
and 304N SS carried out in our<br />
laboratory earlier.<br />
The comparison between the<br />
SCC behaviour of SS-1 and SS-<br />
2 is shown in Fig.1. SS-2<br />
possessed higher K ISCC<br />
(threshold stress intensity factor<br />
<strong>for</strong> stress corrosion cracking)<br />
and J ISCC (integral threshold<br />
stress intensity factor <strong>for</strong> stress<br />
corrosion cracking) and lower<br />
plateau crack growth rate<br />
(PCGR) than SS-1, despite the<br />
contents of major alloying<br />
elements and carbon and<br />
nitrogen being nearly the same.<br />
Initially, the lower average<br />
grain size ( ≅ 55 µm) of SS-2,<br />
vis-à-vis that of SS-1 ( ≅ 70 µm)<br />
was thought to be the cause <strong>for</strong><br />
this significant difference in the<br />
crack growth rate. However, the<br />
difference in the grain sizes was<br />
very small to cause the large<br />
differences observed. Based on<br />
orientation microscopic studies,<br />
it was found that the effective<br />
grain boundary energy, which is<br />
a function of energies of<br />
different low angle grain<br />
boundaries and grain size, was<br />
very low <strong>for</strong> SS-2. The presence<br />
of these special grain<br />
boundaries resulted from the<br />
processing history of the<br />
material. This difference in the<br />
nature of the grain boundary<br />
characteristics were correlated<br />
to a higher resistance to SCC in<br />
SS-2.<br />
Fig.2 shows that (i) on cold<br />
working, the values of K ISCC and<br />
PCGR of mill-annealed SS-2<br />
reduced, (ii) high temperature<br />
aging caused a decrease in the<br />
value of K ISCC and an increase<br />
R&D FOR FBRs 57
IGC<br />
<strong>Annual</strong> <strong>Report</strong> 2007<br />
Table 1: Comparison of SCC crack growth data <strong>for</strong> types 316LN<br />
(SS-1 and SS-2), type 304N and type 316 stainless steels<br />
Fig.1 Comparison of two type 316LN<br />
thermal SS from different sources<br />
in PCGR of mill-annealed<br />
material, and (iii) type 316N SS<br />
weld metal possessed lower<br />
value of K ISCC and higher PCGR<br />
than annealed SS-1. Cold work<br />
increases the number of active<br />
sites, such as vacancies,<br />
dislocation cores and stacking<br />
faults where the passive film will<br />
not be very adhering and<br />
protective, and dissolution can<br />
occur easily <strong>for</strong> SCC to initiate.<br />
Hence, lower K ISCC <strong>for</strong> cold<br />
worked material vis-à-vis<br />
annealed material. The lower<br />
PCGR <strong>for</strong> the cold worked<br />
material could be assigned to<br />
any or both of the following<br />
reasons: (i) restricted liquid<br />
mass transport to the crack tip<br />
due to less load line<br />
displacement because of higher<br />
strength of cold worked<br />
material, and (ii) a more lateral<br />
dissolution occurring at the<br />
crack tip of the cold worked<br />
material due to the high strain<br />
energy and high defect density<br />
there. The lateral dissolution<br />
would cause blunting of the<br />
crack tip and hence more time<br />
would be required <strong>for</strong> the crack<br />
to resharpen and propagate,<br />
thus slowing down crack<br />
growth.<br />
The weakly adherent passive<br />
film on thermally aged SS-2<br />
requires lower values of K I to<br />
break and expose the bare<br />
material to the environment.<br />
Hence, the aged material<br />
possessed lower K ISCC vis-à-vis<br />
annealed material. Since the<br />
dissolution rate of the Crdepleted<br />
regions is faster the<br />
necessary environmental<br />
conditions would be attained<br />
more rapidly in the thermally<br />
aged material leading to a<br />
higher PCGR. Also, the Crdepleted<br />
regions provide easy<br />
pre-existing active paths <strong>for</strong><br />
SCC propagation leading to<br />
higher PCGR.<br />
Table 1 shows the comparison<br />
of K ISCC and PCGR of type<br />
316LN SS (SS-1) from the<br />
present study alongwith the<br />
corresponding values <strong>for</strong> type<br />
316 and 304N SS. Comparison<br />
of the crack growth behaviour<br />
between types 316LN and 316<br />
SS, showed that type 316LN SS<br />
had higher K ISCC and lower<br />
PCGR than type 316 SS. This<br />
was because of lower carbon<br />
and higher nitrogen contents in<br />
the <strong>for</strong>mer. Higher values of<br />
K ISCC , which would mean<br />
increase in resistance to SCC<br />
initiation, was explained based<br />
on improved passive film<br />
stability, which also aids in<br />
decreasing the plateau crack<br />
growth rate of type 316LN SS<br />
vis-à-vis type 316 SS. Type<br />
304N SS had lower values of<br />
K ISCC and higher PCGR than<br />
type 316 LN SS. This indicated<br />
the role of Mo in resisting SCC<br />
initiation and growth.<br />
Comparison of crack growth<br />
data of types 316 and 304N SS<br />
gives an insight to the effects of<br />
Mo and N on the SCC<br />
behaviour of austenitic SS. The<br />
Ni content was higher by 2%,<br />
Cr content was lower by 2%<br />
and carbon content was higher<br />
Fig.2 Effect of cold work and aging<br />
on SCC crack growth<br />
behaviour of annealed SS-2<br />
58 R&D FOR FBRs
IGC<br />
by 0.01% in type 316 SS.<br />
Presence of higher Ni and<br />
lower Cr would nearly<br />
neutralise any beneficial or<br />
detrimental effects of these<br />
additions on the SCC<br />
properties of SS. Type 316 SS<br />
showed lower PCGR and lower<br />
K ISCC<br />
than type 304N SS. This<br />
suggested that nitrogen<br />
imparted better resistance to<br />
SCC initiation, as compared to<br />
Mo, due to a more adherent<br />
passive film that it helped to<br />
<strong>for</strong>m. However, Mo imparted<br />
better resistance to crack<br />
growth <strong>for</strong> the SS. This was<br />
because of the effect of<br />
nitrogen in lowering the<br />
stacking fault energy, which, in<br />
<strong>Annual</strong> <strong>Report</strong> 2007<br />
turn, would promote planar<br />
slip. Planar slip accelerates<br />
SCC crack growth. However,<br />
the presence of both these<br />
elements synergistically<br />
improves the SCC resistance of<br />
austenitic SS as evidenced by<br />
better SCC properties <strong>for</strong> type<br />
316 LN SS as compared to the<br />
other two SS.<br />
III.C.10. Creep Strength Reduction Factors <strong>for</strong><br />
316L (N) SS Welded Joints<br />
Long term creep properties of<br />
indigenously developed<br />
316L(N) SS plates and 316N<br />
SS electrodes have been<br />
characterized at 973 and 923<br />
K. Creep properties of 316L(N)<br />
SS plates, 316N SS weld metal<br />
and 316L(N)/316N SS weld<br />
joints have been studied at<br />
stresses ranging from 120 to<br />
300 MPa and rupture lives as<br />
long as 3 years. The specified<br />
chemical composition of<br />
316L(N) SS plates and 316(N)<br />
SS welding electrodes, and the<br />
actual composition of the<br />
plates and the weld metal used<br />
in this study, are given in Table<br />
1. For the creep design of<br />
welded components <strong>for</strong> fast<br />
reactor applications, RCC-MR<br />
has specified reduction factors<br />
<strong>for</strong> the strength of welded<br />
joints, which is defined as weld<br />
strength reduction factor<br />
(WSRF). WSRF is defined as the<br />
ratio of the creep strength of<br />
the weld joint to that of the<br />
base metal at the same<br />
temperature and creep rupture<br />
time. It is essentially an<br />
additional factor of safety since<br />
creep strength of weld metal<br />
and weld joints are generally<br />
lower than that of the plate<br />
material. WSRF is a function of<br />
creep temperature and time.<br />
The creep properties of<br />
316L(N) SS plates and welding<br />
electrodes have been<br />
developed indigenously and<br />
their creep properties have<br />
been evaluated. Fig. 1(a) and<br />
1(b) show the variation of<br />
WSRF values with rupture life,<br />
at 873 and 923 K respectively<br />
as recommended by RCC-MR<br />
code. WSRF decreases with<br />
increase in rupture time. For a<br />
given creep rupture time, the<br />
strength reduction factor is<br />
lower at higher temperature.<br />
Typically, at 923 K, WSRF=1 at<br />
short rupture life, and its value<br />
decreases to about 0.65<br />
Table 1 : Specified and actual chemical compositions of 316(L)N SS plate,<br />
316(N) SS electrode, 316L(N) SS plate and 316(N) SS weld metal.<br />
R&D FOR FBRs 59
IGC<br />
<strong>Annual</strong> <strong>Report</strong> 2007<br />
Strength reduction factor<br />
1.1<br />
1.0<br />
0.9<br />
0.8<br />
0.7<br />
0.6<br />
RCC-MR code curve<br />
Experimental values<br />
1000 10000<br />
Rupture life, h<br />
(a)<br />
316(N) SS weld joint<br />
873 K<br />
Strength reduction factor<br />
1.1<br />
1.0<br />
0.9<br />
0.8<br />
0.7<br />
0.6<br />
Experimental data<br />
RCC-MR code curve<br />
316(N) SS weld joint)<br />
923 K<br />
100 1000 10000<br />
(b)<br />
Rupture life, h<br />
Fig.1 Variation of WSRF values with rupture life, at (a) 873 and (b) 923 K<br />
corresponding to a rupture life<br />
of about 25000 hours. The<br />
strength reduction factors <strong>for</strong><br />
the 316N SS weld joints in the<br />
present investigation were<br />
found to be higher than the<br />
RCC-MR code values; WSRF<br />
values at 873 K were found to<br />
be close to 1 and was found to<br />
be above 0.85 at 923 K. This<br />
implies that the creep strength<br />
of the weld joint is close to that<br />
of the plates and are<br />
significantly higher than the<br />
values specified in the codes.<br />
III.C.11. Cross Section TEM Studies on the Effect of<br />
Plasma Nitriding of Cr Plated Type 316L Stainless Steel<br />
Hardfacing of stainless steel<br />
(SS) components is commonly<br />
used to improve the chemical<br />
and mechanical properties.<br />
Amongst many alternatives,<br />
chromium nitride (CrN or Cr 2 N)<br />
can attain hardness up to 2400<br />
HV, is thermally stable up to<br />
~1273 K and is preferable to<br />
Stellite and Colmonoy coatings<br />
in radioactive environments.<br />
Plasma nitriding is a diffusion<br />
driven process and is able to<br />
partially nitride the<br />
electroplated (EP) Cr, such that<br />
Cr 2<br />
N(-1-12)<br />
Intensity (arb. un.)<br />
4<br />
Surface<br />
Interior<br />
Cr at Interface<br />
SS316L at<br />
Interface<br />
5 6 7 8 9 10 11 12<br />
g (nm -1 )<br />
Fig.1 XTEM results on a plasma nitrided Cr sample: (a) DF TEM image near the surface,<br />
(b) Intensity plots derived from SAD patterns at various depths from surface.<br />
60 R&D FOR FBRs
IGC<br />
<strong>Annual</strong> <strong>Report</strong> 2007<br />
the nitrided layer is confined to<br />
the surface. Cross-section TEM<br />
(XTEM) has been undertaken to<br />
characterize the nitride phase.<br />
Fig. 1 represents the results on<br />
a specimen that was nitrided at<br />
773K <strong>for</strong> 24hrs, (a) TEM<br />
micrograph taken close to<br />
surface, and (b) SADP intensity<br />
plots against the reciprocal<br />
lattice vector, IgI, taken<br />
from various depths<br />
from the surface.<br />
Fig. 1(a) shows that the EP-Cr is<br />
columnar in nature. Fig. 1(b)<br />
shows that a Cr 2 N phase is<br />
found only on the surface while<br />
all other peaks are from Cr. The<br />
results show that nitride <strong>for</strong>ms<br />
only on the surface as a mixture<br />
of Cr and Cr 2 N, under the<br />
given conditions of plasma<br />
nitriding.<br />
III.C.12. In - house Development of Test Facilities to<br />
Study Hydrogen Assisted Cracking in Steel Weldments<br />
Hydrogen Assisted Cracking<br />
(HAC) is one of the major <strong>for</strong>ms<br />
of cracking that occur in steel<br />
welds. Four different tests,<br />
namely UT-Modified Hydrogen<br />
Sensitivity Test (UT-modified<br />
HST), Implant test, Gap Beadon-Plate<br />
(G-BOP) test and Y-<br />
groove test, were set up<br />
indigenously to study this <strong>for</strong>m<br />
of cracking in steel weld joints.<br />
Susceptibility of modified 9Cr-<br />
1Mo steel and its weld metal<br />
produced from indigenously<br />
developed welding electrodes<br />
has been studied using these<br />
tests. Results from various tests<br />
(except from Y-groove tests)<br />
indicated that a preheat of the<br />
order of 473-523 K is<br />
necessary to prevent HAC in<br />
these steel welds. In the case of<br />
Y-groove test, restraint was low<br />
because of the lower thickness<br />
of the plate used <strong>for</strong> testing (12<br />
mm and 30 mm) and it was<br />
found that with increase in plate<br />
thickness, the preheat<br />
temperature to prevent cracking<br />
increased. Fig.1 and 2 show the<br />
various of preheat temperature<br />
with volume % hydrogen in the<br />
shielding gas <strong>for</strong> UT-modified<br />
HST and with lower critical<br />
stress <strong>for</strong> implant test<br />
respectively. No cracking was<br />
observed at higher<br />
temperatures <strong>for</strong> the given<br />
testing parameters.<br />
Results from different tests<br />
indicated that both weld metal<br />
and base metal are susceptible<br />
to HAC with weld metal more<br />
susceptible than the base<br />
Fig.1 Variation in critical preheat temperature as<br />
function of hydrogen in the shielding gas and strain<br />
applied on the specimen in UT-modified HST<br />
Fig.2 Variation of lower critical stress above which<br />
the specimens cracked as a function of preheat<br />
temperature. No cracking was observed in<br />
specimens prepared at preheat temperature >573 K.<br />
R&D FOR FBRs 61
IGC<br />
<strong>Annual</strong> <strong>Report</strong> 2007<br />
metal. In UT Modified HST<br />
cracking apparently initiated in<br />
the weld metal and extended up<br />
to fine grained HAZ in the base<br />
metal. In the implant test,<br />
cracking was predominantly in<br />
the weld metal at high stress<br />
levels and in HAZ at low stress<br />
levels. In Y-groove tests, cracking<br />
was confined to weld metal both<br />
<strong>for</strong> straight Y-groove (designed to<br />
facilitate weld metal cracking)<br />
and in inclined Y-groove<br />
(designed to facilitate HAZ<br />
cracking) confirming higher<br />
susceptibility of weld metal to<br />
cracking than the base metal. G-<br />
BOP test is specially designed to<br />
evaluate susceptibility of the<br />
weld metal to HAC and critical<br />
preheat temperature determined<br />
from this test is comparable to<br />
that determined from UTmodified<br />
HST and implant test.<br />
III.C.13A. Fabrication of Non-instrumented Irradiation<br />
Capsules <strong>for</strong> Measurement of In-pile Creep and<br />
Mechanical Properties of D-9 Material Using<br />
Pre-pressurized Capsules and Tensile Specimens in FBTR<br />
Irradiation induced swelling<br />
and creep are important<br />
phenomena that affect the<br />
design, operation and<br />
per<strong>for</strong>mance of core structural<br />
materials of Fast Breeder<br />
Reactors. Alloy D9 is selected<br />
<strong>for</strong> FBR fuel cladding and<br />
wrapper tube in view of its<br />
enhanced swelling resistance to<br />
neuron irradiation and<br />
irradiation creep compared to<br />
than those of type 316 stainless<br />
steel. The Alloy D9 which is a<br />
modified type 316 stainless<br />
steel with controlled additions<br />
of titanium and silicon has<br />
been developed indigenously in<br />
collaboration with MIDHANI.<br />
The irradiation creep behaviour<br />
of the indigenously developed<br />
D9 alloy has to be evaluated in<br />
order characterise and qualify<br />
the material <strong>for</strong> use in FBR.<br />
Pressurised capsules technique<br />
is used <strong>for</strong> evaluating the<br />
irradiation creep behaviour of<br />
Alloy D9 because this method<br />
does not require any<br />
instrumentation during<br />
irradiation testing in nuclear<br />
reactors. Two numbers of noninstrumented<br />
irradiation<br />
capsules <strong>for</strong> irradiation of<br />
pressurised capsules and<br />
tensile specimens of D9 in FBTR<br />
have been fabricated to<br />
generate baseline irradiation<br />
per<strong>for</strong>mance data on this<br />
material at low temperature<br />
and low fluence irradiation<br />
conditions.<br />
Pressurised capsules were<br />
fabricated from indigenously<br />
developed D9 clad tube of<br />
outer diameter 6.6 mm and<br />
0.45 mm wall thickness. The<br />
tube is closed by welding at<br />
one end and fitted with special<br />
end plug at the other end,<br />
which enables filling of gas at<br />
the desired pressure into the<br />
tube using a pressurising<br />
Fig.1 View of irradiation capsule with D9 pressurised capsules and D9 disk<br />
specimens (be<strong>for</strong>e assembly and welding)<br />
62 R&D FOR FBRs
IGC<br />
<strong>Annual</strong> <strong>Report</strong> 2007<br />
system. A gas mixture of 97%<br />
argon and 3% helium was used<br />
<strong>for</strong> the pressurisation. After<br />
pressurising, the gas entry path<br />
is sealed with a soft gasket and<br />
welding is carried out to close<br />
the special end plug with a cap.<br />
The diameter of the special end<br />
plug has been designed to<br />
accommodate all features<br />
within the diameter of 6.6 mm.<br />
The length of the pressurised<br />
capsule is about 74 mm. The<br />
pressure of gas in the<br />
pressurised capsule was<br />
determined using the pressure<br />
gauge connected in the<br />
pressurising system and by<br />
using gas laws. These<br />
pressurised capsules were<br />
fabricated using the specially<br />
developed pressurising set up.<br />
All the components required <strong>for</strong><br />
this work were machined in<br />
house. The final end caps were<br />
welded using laser welding to<br />
avoid over-heating of the<br />
sealing portion. The finished<br />
capsules (Fig. 1) were helium<br />
leak tested and found to be<br />
acceptable.<br />
Fifteen numbers of such D9<br />
pressurised capsules have been<br />
fabricated and arranged in five<br />
partitions in an irradiation<br />
capsule along with D9 disk<br />
specimens. Out of these 15<br />
pressurised capsules, 5<br />
numbers each were filled with<br />
pressures of 2.1 MPa, 4.2 MPa<br />
and 6.3 MPa at room<br />
temperature respectively. The<br />
corresponding pressures at the<br />
irradiation temperature of<br />
about 623 K are 4.4, 8.8 and<br />
13.2 MPa and the hoop<br />
stresses that are developed in<br />
the pressurised capsules at the<br />
irradiation temperature are 30,<br />
60 and 90 MPa respectively.<br />
The second irradiation capsule<br />
contains D9 tubular tensile<br />
specimens, small size flat<br />
tensile specimens and disk<br />
specimens of D9. A few<br />
specimens of type 316 stainless<br />
steel (FBTR Quality) are also<br />
included in this irradiation<br />
capsule. Holes have been<br />
drilled on the wall of irradiation<br />
capsules to allow the reactor<br />
sodium to enter and surround<br />
the pressurised capsules /<br />
specimens during irradiation.<br />
The irradiation temperature of<br />
pressurised capsules /<br />
specimens is same as<br />
temperature of sodium (619 to<br />
623 K). The irradiation<br />
capsules are assembled in two<br />
special steel subassemblies and<br />
have been loaded presently in<br />
the 4th ring of FBTR <strong>for</strong><br />
irradiation (Fig. 1). The desired<br />
duration of irradiation is one<br />
year or above. After irradiation,<br />
the capsules will be discharged<br />
from the reactor and taken to<br />
Radiometallurgy Laboratory<br />
and post irradiation<br />
examination will be conducted<br />
on the pressurised capsules<br />
and other specimens.<br />
III.C.13B. Development of Fly Ash Concrete <strong>for</strong><br />
Nuclear Power Plant Structures<br />
To conserve precious natural<br />
resources, and to use industrial<br />
waste materials gainfully in<br />
nuclear projects, use of fly ash<br />
in project sites at Kalpakkam<br />
was explored, by consolidating<br />
knowledge gained in various<br />
units of DAE.<br />
Positive effects of using fly ash<br />
in concrete are as below:<br />
• Better quality of concrete;<br />
better rheology, higher<br />
strength, enhanced durability.<br />
• Eco-friendly, minimizing<br />
greenhouse gas emissions<br />
associated with the<br />
manufacturing of Ordinary<br />
Portland Cement (OPC),<br />
environment friendly disposal of<br />
millions of tones of fly ash.<br />
• Preservation of resources,<br />
saving in energy requirements<br />
R&D FOR FBRs 63
IGC<br />
<strong>Annual</strong> <strong>Report</strong> 2007<br />
in the production of OPC,<br />
preservation of limestone and<br />
coal reserve.<br />
For deploying fly ash in plants<br />
construction, development of<br />
different mixes of Traditionally<br />
Placed Concrete (TPC) and Self<br />
Compacting Concrete (SCC)<br />
Table 1 : Concrete mix proportions<br />
using fly ash, suitable <strong>for</strong> NPP<br />
structures is undertaken in<br />
collaboration with AERB, NPCIL<br />
and BHAVINI. Main results of<br />
the work under taken are<br />
summerised in this article.<br />
Concrete ingredients which<br />
are in use <strong>for</strong> the construction<br />
of PFBR were used in this study.<br />
Fly ash from Ennore thermal<br />
power station was used. All the<br />
concrete ingredients were<br />
tested as per the relevant<br />
specification. Table 1 gives the<br />
mix proportions.<br />
The graphs in Fig.1 are<br />
representative of the trends in<br />
fly ash concrete. Interpretations<br />
drawn are summarized below.<br />
Fly ash concrete mixes have<br />
better slump retention property,<br />
more cohesiveness, lesser<br />
bleeding, comparable air<br />
content, slightly lower density<br />
and slightly delayed setting time<br />
as compared to control mixes<br />
(ie. mix with no flyash).All the<br />
three mixes meet the strength<br />
requirement of grade M50,<br />
M35, M20 respectively at 56<br />
days .For all the three grades of<br />
concrete the Rapid Chloride<br />
Penetration Test(RCPT) values at<br />
28 days as well as at 56 days is<br />
much lower <strong>for</strong> fly ash concrete<br />
mixes as compared to<br />
respective control mix. The<br />
reduction in RCPT values is due<br />
to improvement of pore<br />
structure with the addition of fly<br />
ash in the concrete mix.<br />
Fig.1 Properties of fly ash concrete<br />
Based on the results, fly ash<br />
concrete mixes were identified<br />
and recommended <strong>for</strong> the<br />
construction of Power Island<br />
structures of PFBR.<br />
64 R&D FOR FBRs
IGC<br />
<strong>Annual</strong> <strong>Report</strong> 2007<br />
III.D. Control Rod Materials<br />
III.D.1. Augmentation of Boron Enrichment Plant<br />
Because of the higher crosssection<br />
of 10 B <strong>for</strong> the reaction<br />
10<br />
B(n,α) 7 Li, boron compounds<br />
enriched in the 10B isotope<br />
are generally used <strong>for</strong> control<br />
rods of Fast Breeder Reactors<br />
(FBRs), neutron counter and<br />
neutron capture therapy of<br />
malignant tissues. Natural<br />
boron has 18.8 at% of 10 B and<br />
81.2 at% of 11 B. For efficient<br />
control of fast reactors, it is<br />
required to use highly enriched<br />
boron in 10 B isotope.<br />
Ion exchange chromatography<br />
is one of processes that are<br />
used <strong>for</strong> the separation of<br />
natural isotopes of boron. In<br />
this process, a strong base<br />
anion exchange resin in<br />
hydroxyl <strong>for</strong>m is exchanged with<br />
boric acid solution. After<br />
loading boric acid to the<br />
required band length, it is<br />
displaced with an acid to<br />
achieve the desired enrichment.<br />
The technology <strong>for</strong> enrichment<br />
of isotopes of boron to 65% in<br />
10<br />
B required <strong>for</strong> PFBR has been<br />
demonstrated at the centre.<br />
Using ion exchange resin with<br />
0.3mm to 1.2 mm particle size<br />
(termed as normal resin), it has<br />
taken almost 4 years to achieve<br />
65% enrichment. Mathematical<br />
calculations indicated that<br />
using ion exchange resin with<br />
0.3mm to 1.2 mm particle size,<br />
it would not be possible to<br />
achieve enrichment in 10 B to<br />
91% . Studies were undertaken<br />
to improve upon the<br />
equilibration time required to<br />
achieve the enrichment.<br />
Investigations revealed that the<br />
use of fine particle size resin<br />
could result in reduction in<br />
equilibration time <strong>for</strong><br />
enrichment as the value of<br />
Height Equivalent to a<br />
Theoretical Plate (HETP) which<br />
is an important parameter in<br />
column per<strong>for</strong>mances in ion<br />
exchange chromatography can<br />
be reduced significantly by<br />
using smaller particle size resin.<br />
Laboratory and pilot scale<br />
experiments were carried out<br />
using resin with particle size of<br />
0.075 mm to 0.15 mm,<br />
(termed as fine resin) <strong>for</strong><br />
evaluation of the resin <strong>for</strong><br />
enrichment per<strong>for</strong>mance. The<br />
results of experiments carried<br />
out with normal resin and with<br />
fine resin under identical<br />
conditions are shown in Fig.1.<br />
From this figure, it could be<br />
seen that enrichment to 40% in<br />
10B could be reached using<br />
fine resin whereas <strong>for</strong> normal<br />
resin enrichment to only 26% in<br />
10<br />
B could reached in the same<br />
time.<br />
A computer code 'CASCADE'<br />
was developed <strong>for</strong> predicting<br />
the enrichment profiles <strong>for</strong><br />
boron enrichment based on<br />
Fujine's model (developed <strong>for</strong><br />
Lithium isotope enrichment). In<br />
this model, the band is divided<br />
into theoretical stages. The<br />
governing equations are<br />
derived from the material<br />
balance of the isotope in the<br />
resin phase and solution phase<br />
in a theoretical stage at any<br />
given time. The enrichment<br />
profiles are calculated by using<br />
band length, band velocity and<br />
total time of operation as inputs<br />
using assumed values of HETP.<br />
The calculated profiles are then<br />
compared with experimental<br />
enrichment profile, and the<br />
value of HETP that closely<br />
matches calculated profile, is<br />
taken as the value of HETP of<br />
the column. Once HETP is<br />
estimated, the same model is<br />
Percentage of 10 B<br />
50<br />
40<br />
30<br />
20<br />
10<br />
0<br />
Fine resin<br />
Normal resin<br />
0,0 1,0 2,0 3,0 4,0 5,0<br />
Band length / m<br />
Fig.1 Enrichment profiles after<br />
36 m of borate band movement<br />
R&D FOR FBRs 65
IGC<br />
<strong>Annual</strong> <strong>Report</strong> 2007<br />
used <strong>for</strong> predicting the<br />
enrichments that could be<br />
achieved later in the columns.<br />
The accuracy of the<br />
mathematical model is<br />
assessed by comparing isotopic<br />
enrichment profiles obtained<br />
during operation with<br />
theoretical values obtained<br />
using mathematical model.<br />
Table 1 : Analysis of data <strong>for</strong> pilot plant using fine resin<br />
The calculations carried out<br />
<strong>for</strong> the data obtained during<br />
operation of pilot plant using<br />
fine resin are listed in Table 1.<br />
The samples <strong>for</strong> isotopic profile<br />
were taken after 18m and 36m<br />
of band movement. It can be<br />
seen from the results that the<br />
projected enrichments are<br />
within ±10% error. Hence, the<br />
mathematical model gives<br />
confidence in simulation of<br />
boron enrichment process.<br />
Based on the results of these<br />
experiments, the Augmented<br />
Boron Enrichment Plant(ABEP)<br />
was designed <strong>for</strong> the<br />
production of boron enriched<br />
10<br />
in B. Fig.2 shows a<br />
photograph of the plant. The<br />
plant consists of two streams of<br />
ion exchange columns each<br />
having 5 process ion exchange<br />
columns interconnected in<br />
series. One external<br />
regeneration column is<br />
provided <strong>for</strong> each stream. The<br />
fine resin was charged to<br />
process ion exchange columns<br />
and pretreated <strong>for</strong> 5 cycles of<br />
OH - Cl exchange by using<br />
1.25N NaOH and 1.0 N HCl<br />
followed by intermittent<br />
washing with DM water. In the<br />
final cycle of pretreatment, the<br />
resin was retained in hydroxyl<br />
<strong>for</strong>m and thoroughly washed<br />
with DM water. Boric acid<br />
Fig.2 A view of augmented boron<br />
enrichment plant.<br />
Fig.3 Enrichment profile obtained after operation of ABEP <strong>for</strong> 2 months<br />
66 R&D FOR FBRs
IGC<br />
<strong>Annual</strong> <strong>Report</strong> 2007<br />
solution in the concentration<br />
range of 0.30-0.35M was<br />
charged to three ion exchange<br />
columns interconnected in<br />
series to develop the required<br />
length of borate band.<br />
After commissioning the<br />
plant, the displacement of<br />
borate band in ABEP was<br />
started. Once the column was<br />
exhausted (ensured by the<br />
absence of boric acid in the<br />
sample drawn from the outlet of<br />
the column), the resin was<br />
hydraulically transferred to a<br />
Regeneration Vessel (RV) <strong>for</strong><br />
regeneration.<br />
After<br />
regeneration and rinsing the<br />
resin in RV, it was transferred<br />
back to the same process ion<br />
exchange column. The pressure<br />
drop observed per column was<br />
in the range of 1.5 to 2 bar<br />
initially and later it stabilized to<br />
1.2 bar per column. After<br />
completion of 4 cycles of band<br />
displacement, samples were<br />
drawn from the rear end of the<br />
borated band and sent <strong>for</strong><br />
isotopic analysis. As shown in<br />
Fig. 3, the enrichment in 10 B to<br />
40% was achieved in 2 months<br />
of operation using fine resin<br />
whereas with normal resin it<br />
took 11 months to reach the<br />
same level of enrichment in 10 B.<br />
The operation of the plant has<br />
given confidence in using fine<br />
resin with manageable pressure<br />
drop in columns, external<br />
regeneration of the fine resin<br />
after hydraulic transfer, and all<br />
the more that enrichment could<br />
be attained reach faster<br />
compared to ion exchange<br />
columns using normal resin.<br />
III.D.2. Removal of Fluoride from the Effluent Generated<br />
during Elemental Boron Production<br />
Boron carbide containing 65%<br />
enriched 10 B will be used as the<br />
control rod material in FBRs.<br />
R&D programme is being<br />
pursued <strong>for</strong> enrichment of<br />
isotopes of boron using ion<br />
exchange chromatography,<br />
production of elemental boron<br />
from potassium fluoroborate<br />
through molten salt<br />
electrowining process. During<br />
the production of elemental<br />
boron from potassium<br />
fluoroborate, effluents rich in<br />
fluoride are generated. These<br />
effluents cannot be disposed off<br />
into water bodies due to the<br />
disposal limit of less than 2<br />
mg/litre of fluoride. Hence, a<br />
method <strong>for</strong> effluent treatment<br />
was developed to effectively<br />
treat these fluoride effluents in<br />
two stages. In the first stage,<br />
the concentration is reduced to<br />
less than 20 mg/litre using<br />
chemical methods. This effluent<br />
is further treated using<br />
membrane filtration to reduce<br />
the fluoride levels to
IGC<br />
<strong>Annual</strong> <strong>Report</strong> 2007<br />
R&D experiments were carried<br />
out to reduce the fluoride levels<br />
from 20 mg/litre to
IGC<br />
<strong>Annual</strong> <strong>Report</strong> 2007<br />
that the effects of mechanical<br />
interaction with neighbouring<br />
subassemblies are ignored to<br />
yield conservative results. The<br />
mass of the test mock-up<br />
subassembly is 245 kg equal to<br />
that of the PFBR subassembly.<br />
Further, the test mock-up is<br />
geometrically similar to reactor<br />
conditions. The upward fluid<br />
<strong>for</strong>ce is simulated by pumping<br />
water under pressure using the<br />
setup shown in Fig. 2. The SA is<br />
made to freely hang through a<br />
load cell so that it can measure<br />
the weight of the SA accurately.<br />
The measured weight by the<br />
load cell is plotted as a function<br />
of applied pressure at the<br />
bottom in Fig. 2. A pressure of<br />
0.7 MPa is applied at the<br />
bottom of SA to generate the<br />
targeted upward lift <strong>for</strong>ce equal<br />
to 30% of weight of SA.<br />
Seismic excitations<br />
Test has been done by using<br />
tri-axial shake table of 10 t<br />
capacity existing at the <strong>Centre</strong>.<br />
Experimental setup is shown in<br />
Fig.3. A dedicated data<br />
acquisition system with 64<br />
channels is used <strong>for</strong> capturing<br />
the structural response under<br />
seismic excitation. Three LVDTs<br />
are used <strong>for</strong> measuring the<br />
relative displacement of the SA<br />
with respect to GP top. The set<br />
up is subjected to vertical<br />
excitations with the peak<br />
accelerations to ensure the<br />
realistic transmission of seismic<br />
excitations to the SA.<br />
Excitations corresponding to<br />
peak acceleration of 0.5 g and<br />
1.0 g are applied and the<br />
accelerations are measured at<br />
the GP top portion. The applied<br />
accelerations and the average<br />
relative displacements with<br />
respect to GP top surface,<br />
measured by LVTDs are shown<br />
in Fig.4. The random variation<br />
of displacements <strong>for</strong> the peak<br />
acceleration of 0.5 g (Fig.4a)<br />
Fig.2 Simulation of upward <strong>for</strong>ce<br />
Fig.3 SA mounted on shake table<br />
R&D FOR FBRs 69
IGC<br />
<strong>Annual</strong> <strong>Report</strong> 2007<br />
Fig.4a: SA Displacement <strong>for</strong> 0.5 g (vertical)<br />
indicates that there is no impact and<br />
hence SA always gets attached with grid<br />
plate. Further, the discrete displacement<br />
peaks observed <strong>for</strong> 1.0 g (Fig.4b), imply<br />
that there are impacts from which it is<br />
inferred that the SA gets lifted off.<br />
However, the magnitude of lift off is<br />
insignificant (< 2 mm).<br />
Fig.4b SA Displacement <strong>for</strong> 1.0 g (vertical)<br />
Fig.4c SA Displacement <strong>for</strong> 1 g (multi-axial)<br />
In order to investigate the effects of<br />
horizontal excitations, tests are repeated<br />
<strong>for</strong> 1.0 g peak acceleration, by way of<br />
applying seismic excitations in all the<br />
three X, Y and Z direction using the input<br />
time history corresponding to the GP<br />
location. The random variation of<br />
displacement response with peak value <<br />
0.3 mm, indicates that there is no lift off<br />
of SA (Fig. 4c). This further demonstrates<br />
that there is no risk of instability or lift off<br />
of subassemblies under seismic loading.<br />
III.E.2. Real Time Decision Support System <strong>for</strong><br />
Radiological Emergency as a New Feature during<br />
the Off-site Emergency Exercise - 2007<br />
The real time Decision<br />
Support System (DSS)<br />
developed at the centre <strong>for</strong><br />
radiological emergency was<br />
demonstrated <strong>for</strong> the first time<br />
during the off-site emergency<br />
exercise on August 24, 2007.<br />
This biennial exercise is<br />
conducted by the Kalpakkam<br />
Emergency Committee to train<br />
and activate the emergency<br />
response administration and<br />
the systems <strong>for</strong> keeping it in live<br />
condition to cope with a real<br />
case of an extremely unlikely<br />
emergency. It contains the most<br />
advanced meteorological<br />
<strong>for</strong>ecasting module and<br />
involves integration of the same<br />
with a dispersion and dose<br />
prediction<br />
module,<br />
commissioning of a real time<br />
meteorological data acquisition<br />
& archival system from 50 m<br />
meteorological towers installed<br />
around Kalpakkam and<br />
creation of a realistic<br />
geographical data base used<br />
as the surface boundary<br />
condition in the model.<br />
At the front end, the DSS has<br />
a web based on-line<br />
Geographic In<strong>for</strong>mation System<br />
(GIS) display and query module<br />
developed in collaboration with<br />
Regional Remote Sensing<br />
Service <strong>Centre</strong> (RRSSC-ISRO),<br />
Nagpur. This module is a<br />
70 R&D FOR FBRs
IGC<br />
<strong>Annual</strong> <strong>Report</strong> 2007<br />
software package indigenously<br />
developed by RRSSC following<br />
the system requirement<br />
specification laid down by RSD,<br />
<strong>IGCAR</strong>. The expertise of RRSSC<br />
in remote sensing data analysis<br />
and geo-projection of the local<br />
data base in a high resolution<br />
imagery was a specific<br />
contribution to the DSS. The<br />
DSS has three options namely<br />
to show the dose projection<br />
assuming an emergency under<br />
loss of coolant accident in<br />
MAPS, dose projection under<br />
an unit release of activity and<br />
dose projection <strong>for</strong> known<br />
release rate that can be entered<br />
by any client on his machine.<br />
These options are provided<br />
because the actual release rate<br />
is unknown in case of an<br />
accident. During simulation of<br />
the Off-site Emergency, on the<br />
day of the emergency drill, the<br />
DSS could show the <strong>for</strong>ecast of<br />
the radioactive plume in a 100<br />
km radius, and now cast the<br />
radioactivity and dose spread in<br />
a local range of 10 km radius.<br />
The meteorological data was<br />
displayed on-line in order to<br />
know the wind speed and<br />
direction towards which the<br />
radioactive plume would travel.<br />
The data showed that since<br />
morning hours the direction<br />
was from west and it changed<br />
to south east in the afternoon<br />
due to sea breeze onset.<br />
The villages Kadampady and<br />
Ambur were preplanned <strong>for</strong><br />
evacuation drill. However the<br />
DSS showed many other<br />
villages falling under the<br />
footprint of high dose values<br />
requiring evacuation in case of<br />
a real release. The GIS query<br />
module helped as a ready<br />
reckoner to list out details<br />
about the villages likely to be<br />
affected. For example, the<br />
spatial query module 'SQ' could<br />
show on-line, the plume<br />
trajectory prediction at any<br />
given time of the day, the<br />
present plume position based<br />
on real time data, the villages,<br />
population dose and severity of<br />
the emergency such as whether<br />
evacuation is required etc.<br />
Similarly, the radius query could<br />
list out the villages having<br />
shelters and hospitals within a<br />
specified radius. Village<br />
Layer Name:village No.of Results:1<br />
NAME Athur<br />
V_CODE 555<br />
TOT_P 7752<br />
TOT_F 3877<br />
TOT_M 3875<br />
Layer Name:district No.of Results:1<br />
D_CODE 1801<br />
DIST CHENGALPATTU (TN)<br />
Layer Name:roads No.of Results:2<br />
DESCR<br />
VILLAGE/UNMETALLED<br />
ROAD<br />
RD_CODE 104<br />
DESCR NATIONAL HIGHWAY<br />
RD_CODE 101<br />
Layer Name:rail No.of Results:3<br />
DESCR BROAD GAUGE<br />
RL_CODE 101<br />
DESCR METER GAUGE<br />
RL_CODE 102<br />
DESCR BROAD GAUGE<br />
RL_CODE 101<br />
Layer Name:slope No.of Results:1<br />
MODERATELY SLOPING<br />
DESCR<br />
(15-30%);STEEPLY<br />
SLOPING (30-50%);VERY<br />
STEEPLY SLOPING<br />
Layer Name:luse No.of Results:1<br />
DESCR_L1 AGRICULTURE<br />
DESCR_L2 CROP-LAND<br />
DESCR_L3 DOUBLE CROP (K-R)<br />
NRIS_CODE 2010300<br />
Layer Name:soiltex No.of Results:1<br />
SO_TEX 1<br />
Layer Name:soero No.of Results:1<br />
SO_ERO 3<br />
Layer Name:sodep No.of Results:1<br />
SO_DEP 2<br />
Layer Name:veg No.of Results:1<br />
GRID_CODE 24<br />
in<strong>for</strong>mation database of the<br />
DSS is designed in a manner<br />
similar to the <strong>for</strong>mat of VRC<br />
(Village Resource <strong>Centre</strong>), an<br />
in<strong>for</strong>matics kiosk being set up<br />
by ISRO throughout the country.<br />
Fig 1 shows the thematic layers<br />
and the coding followed in the<br />
national <strong>for</strong>mat. The predicted<br />
plume during sea breeze in<br />
agreement with actual data is<br />
shown in Fig. 2. The Kalpakkam<br />
Management Committee and<br />
members of the National<br />
Disaster Management Authority<br />
were shown the DSS and its<br />
various functionalities. They<br />
suggested that the model may<br />
be implemented in other sites of<br />
nuclear power plants. Also it<br />
was pointed out that such a<br />
system is required <strong>for</strong> large<br />
chemical plants.<br />
Fig.1 Various thematic layers and their<br />
attributes in a national coding <strong>for</strong>mat<br />
(encircled in red) on the left<br />
Fig.2 Thyroid dose at 14h on the day of the drill<br />
R&D FOR FBRs 71
IGC<br />
<strong>Annual</strong> <strong>Report</strong> 2007<br />
III.E.3. State of the Art Automatic Multilevel<br />
Meteorological Tower System<br />
Meteorological towers are the<br />
plat<strong>for</strong>ms providing continuous<br />
in-situ in<strong>for</strong>mation within the<br />
lower atmospheric layer called<br />
the Atmospheric Boundary<br />
Layer (ABL). Though there is a<br />
number of meteorological<br />
towers ranging in height from<br />
30 to 60 m in the country, many<br />
of them do not have multilevel<br />
sensors installed <strong>for</strong> all the<br />
basic atmospheric parameters<br />
like wind speed & direction,<br />
temperature, relative humidity<br />
and pressure. Our ef<strong>for</strong>t has<br />
been to operationalise a<br />
simple, reliable and easy to<br />
maintain system of multilevel<br />
meteorological tower based on<br />
a generic type of data<br />
acquisition system.<br />
Fifty meter tall meteorological<br />
lattice type guyed tower was<br />
designed in collaboration with<br />
Structural Engineering <strong>Research</strong><br />
Fig.1 Distributed network modules<br />
and signal conditioners at the<br />
base of the tower<br />
<strong>Centre</strong>, Chennai, and erected<br />
at Kalpakkam. As compared to<br />
the free-standing fixed base<br />
tower, the above design can be<br />
implemented at a<br />
comparatively lower cost. At<br />
Kalpakkam, one of the towers is<br />
located on the coast and the<br />
other two are located<br />
perpendicular to the coast at<br />
distances of 7 km and 15 km<br />
from the coast. Other features<br />
of the tower developed inhouse<br />
are signal conditioners,<br />
remote data acquisition system<br />
(RDAS) with a more generic<br />
input data base covering<br />
various sensor models, user<br />
friendly software and on-line<br />
data communication links<br />
through ethernet, e-mail and<br />
RF transreceivers.<br />
System electronics and<br />
hardware<br />
The towers are instrumented<br />
at multi levels with conventional<br />
sensors <strong>for</strong> various parameters<br />
and fast response sonic<br />
anemometer <strong>for</strong> turbulence<br />
measurement. Fig. 1 shows the<br />
distributed network modules<br />
and the signal conditioners. A<br />
rugged, user-friendly data<br />
acquisition system was<br />
designed around an industrial<br />
embedded computer plat<strong>for</strong>m<br />
with RS 485 based embedded<br />
distributed network modules<br />
located near the tower base as<br />
an interface with the sensors.<br />
Since the nodes are connected<br />
in parallel, they can be<br />
disconnected from the host<br />
without affecting the<br />
per<strong>for</strong>mance of the remaining<br />
nodes. The biggest advantage<br />
of using such a configuration is<br />
that the main data acquisition<br />
system i.e. an industrial PC can<br />
be housed in a weather proof<br />
shelter box fixed on the tower<br />
so that no separate room or<br />
cabin is required. It can also be<br />
kept in a laboratory away as far<br />
as 600 m from the tower, the<br />
connecting cable being a two<br />
core cable <strong>for</strong> RS 485 signal<br />
from the RDAS to the tower.<br />
The universal network<br />
controller used <strong>for</strong> RDAS is a<br />
system that has an application<br />
ready plat<strong>for</strong>m and supports<br />
several standard networking<br />
interfaces, such as Ethernet,<br />
wireless Ethernet, RS-232, RS-<br />
485 and on board I/O<br />
interfaces. It has an open<br />
architecture and is extremely<br />
reliable in the field as it has a<br />
fan-less,<br />
cable-less<br />
architecture. The system was<br />
found to be extremely rugged<br />
72 R&D FOR FBRs
IGC<br />
<strong>Annual</strong> <strong>Report</strong> 2007<br />
and robust and suitable <strong>for</strong> use<br />
in harsh and critical<br />
environments such as the one<br />
we have at Kalpakkam tower<br />
location, a coastal site. The<br />
system has a strong mechanical<br />
design, and has excellent antishock<br />
and anti-vibration<br />
properties.<br />
Software, data structure and<br />
online data links<br />
The application software has<br />
been designed around<br />
DASYLab. The system installed<br />
at the tower has all the user<br />
friendly menus <strong>for</strong> configuring<br />
the parameters and also has<br />
real time graphical and tabular<br />
displays of real time data and<br />
recent data (values and trends)<br />
on the monitor. The screen, in<br />
addition to showing the status<br />
of the DAS, has links to a<br />
number of other data display<br />
screens. Most of the ready<br />
Fig.2 Display of the real-time tower data through a portal in the LAN<br />
made field - installed RDAS do the field and has been<br />
not have the real time graphical providing input data to the<br />
output facility. The salient real-time dispersion model of a<br />
feature of the software decision support system <strong>for</strong><br />
developed <strong>for</strong> this system is that<br />
all the above features and the<br />
various screens are available in<br />
real time and on-line without<br />
radiological emergency. In the<br />
present installation, the 10 min.<br />
averaged tower data is received<br />
by a server located about 8 km<br />
interrupting the data away from the tower and real<br />
acquisition during the actual<br />
logging of data in the field.<br />
time data is displayed through<br />
a web portal in the local LAN of<br />
<strong>IGCAR</strong>. A typical display of<br />
The system is operational in data is shown in Fig.2.<br />
III.E.4. Devices to Minimize Gas Entrainment in<br />
PFBR Surge Tank<br />
Gas entrainment is an<br />
undesirable phenomenon and it<br />
is to be avoided from<br />
considerations of cavitation in<br />
the secondary sodium pumps<br />
and heat transfer in the<br />
secondary circuit. In the<br />
secondary circuit of Fast<br />
Breeder Reactors the potential<br />
source of entrainment of argon<br />
cover gas into liquid sodium is<br />
in the surge tank located<br />
upstream of the Steam<br />
generator. It is there<strong>for</strong>e<br />
essential to mitigate the<br />
entrainment of the argon gas<br />
into liquid sodium in the surge<br />
tank itself. The phenomenon of<br />
gas entrainment was modeled<br />
in a 5/8 scale model of the<br />
surge tank of PFBR. The choice<br />
of the scale size was based on<br />
the similitude criteria derived<br />
from non dimensional analysis<br />
of the dominant <strong>for</strong>ces which<br />
initiate the phenomenon of<br />
entrainment. The geometrical<br />
and flow parameters that<br />
strongly influence the<br />
mechanism of entrainment were<br />
R&D FOR FBRs 73
IGC<br />
<strong>Annual</strong> <strong>Report</strong> 2007<br />
investigated in these studies.<br />
The need <strong>for</strong> devices to mitigate<br />
entrainment was established<br />
<strong>for</strong>m these studies.<br />
Ef<strong>for</strong>ts to finalize an optimum<br />
configuration of the device that<br />
would serve to eliminate<br />
entrainment was carried<br />
<strong>for</strong>ward through a series of flow<br />
visualization tests in the model<br />
using water as the simulant.<br />
The selection of the devices<br />
employed <strong>for</strong> testing was,<br />
governed by the philosophy to<br />
reduce the height of the liquid<br />
column above the outlet nozzle<br />
<strong>for</strong> the onset of entrainment.<br />
Pepper pot<br />
Fig.1 Pepper pot assembly in model<br />
Fig.2 Ring plate cylindrical<br />
per<strong>for</strong>ated shell<br />
Fig.3 Minimum height required to avoid gas entrainment <strong>for</strong> different conditions<br />
The efficacy of devices was this device was used in<br />
proven with simple stiffener combination with a Ring<br />
rings and porous plates, plate Cylindrical Per<strong>for</strong>ated<br />
wherein the height of liquid<br />
column at which initiation of<br />
Shell (RCPS) (Fig. 2). This<br />
combination was found to be<br />
entrainment occurs had very effective and the minimum<br />
dropped considerably possible height of liquid<br />
compared to the case without column without entrainment <strong>for</strong><br />
any device. However the nominal flow was 1320 mm<br />
reference height of the liquid from the outlet nozzle<br />
column based on the corresponding to 2050 mm in<br />
operational requirements was prototype. The tests have<br />
even lower. It was necessary to<br />
test a combination of devices<br />
confirmed the adequacy of the<br />
configuration and the same is<br />
like the stiffener ring in recommended <strong>for</strong> deployment<br />
conjunction with porous plates in the reactor.<br />
to reduce this liquid column<br />
height. A series of test with 22<br />
Fig. 3. shows the minimum<br />
height required to avoid gas<br />
different configurations were entrainment <strong>for</strong> different<br />
conducted to reduce this combinations in model. The<br />
height. The pepper pot effect of devices is not<br />
configuration (Fig.1) was one considerable at low Froude No.<br />
device which, when tested (upto 2.5) whereas <strong>for</strong> higher<br />
produced very encouraging<br />
results But to reduce the liquid<br />
column height further to the<br />
required levels the variations in<br />
the geometry of the pepper pot<br />
Froude No. the configuration<br />
of devices plays an important<br />
role in minimizing the gas<br />
entrainment phenomenon at<br />
lower heights of liquid column.<br />
alone was not sufficient. Hence,<br />
74 R&D FOR FBRs
IGC<br />
<strong>Annual</strong> <strong>Report</strong> 2007<br />
III.E.5. Simulated Sodium Test Results of Eddy Current<br />
Position Sensor<br />
Eddy Current Position Sensor<br />
(ECPS) has been<br />
conceptualized to detect<br />
whether the DSR has reached<br />
its bottom most deposited<br />
position or not and to find out<br />
free fall time of DSR using ECPS<br />
signal. In the earlier version of<br />
ECPS, primary coils housed in<br />
DSR electromagnet side and<br />
secondary coils housed in<br />
sheath side were kept axially<br />
aligned. Detailed analysis <strong>for</strong><br />
reactor conditions indicated<br />
that in reactor primary coil and<br />
secondary coils will get axially<br />
misaligned up to a maximum of<br />
45mm due to thermal<br />
expansion and irradiation<br />
induced dimensional changes.<br />
There<strong>for</strong>e a new configuration<br />
of ECPS which can take care of<br />
axial misalignment of 45mm<br />
was conceptualized and tested<br />
in laboratory scale. Air test was<br />
carried out in a 1:1 model<br />
where the presence of sodium<br />
was simulated by an equivalent<br />
thickness of aluminum sheet<br />
between primary side and<br />
secondary side coils.<br />
In ECPS (Version-3), where<br />
axial misalignment of 45mm is<br />
taken care of, secondary coil<br />
occupies whole 65mm axial<br />
length on DSR sheath side. This<br />
secondary coil also works as<br />
signal transfer coil. In primary<br />
side totally three coils (one<br />
primary & two pick-up coils) are<br />
housed in 105mm axial length.<br />
Schematic of ECPS-3 is shown<br />
in Fig.1. While conceptualizing<br />
the ECPS-3 schematic,<br />
constraints of space availability<br />
of 65mm only on DSR sheath<br />
side is taken into account and<br />
advantage is taken of the fact<br />
that axial misalignment of<br />
maximum 45mm is only in one<br />
direction i.e. DSR<br />
electromagnet moving 45mm<br />
below compared to secondary<br />
sheath side coil.<br />
The primary is excited by a<br />
constant current source and<br />
produces an alternating<br />
magnetic field which induces a<br />
voltage in the secondary coil on<br />
the sheath side. An alternating<br />
current starts flowing due to<br />
induced secondary voltage<br />
since the secondary side circuit<br />
is closed. The magnitude of this<br />
secondary current depends on<br />
the impedance of the<br />
secondary circuit. The<br />
impedance of the sensor coil<br />
(on secondary side) is a<br />
function of the permeability of<br />
the material in the sensor coil<br />
region. Since the piston of the<br />
DSR is made of modified 9Cr-<br />
1Mo, which is magnetic<br />
material, the dropping of DSR<br />
causes a change in the<br />
impedance of the sensor coil<br />
resulting in a change in<br />
secondary side current. This<br />
change in secondary current<br />
causes a change in the net<br />
magnetic flux and hence in the<br />
pick-up voltages.<br />
Initially, the bottom pick-up<br />
will be aligned with the<br />
secondary coil, as the axial<br />
misalignment takes place the<br />
bottom pick-up will move<br />
downwards and the top pick-up<br />
(which is identical to the bottom<br />
Top Pick up<br />
Primary<br />
Bottom Pick up<br />
Sensor coil<br />
Fig.1 Schematic of ECPS to<br />
take care of axial misalignment<br />
Secondary<br />
R&D FOR FBRs 75
IGC<br />
<strong>Annual</strong> <strong>Report</strong> 2007<br />
one) will align with secondary<br />
coil. At any time atleast one<br />
pick-up coil will be aligned with<br />
secondary coil. The change in<br />
voltage in pick up coil due to<br />
change in position of DSR will<br />
be the indication of DSR<br />
reaching bottom most position.<br />
Further, in order to avoid the<br />
ambiguity as to which pick-up<br />
voltage to be sensed, the sum<br />
of the pick-up outputs is taken<br />
and analyzed to detect DSR<br />
position.<br />
In order to validate the<br />
proposed configuration a 1:1<br />
model was fabricated. Presence<br />
of sodium within the annular<br />
space between the primary and<br />
the secondary side coils is<br />
simulated by 1mm thick<br />
aluminum sheet. The set-up<br />
was tested at various<br />
frequencies from 100Hz to<br />
1000Hz at constant current of<br />
100mA, 200mA and 300mA.<br />
From the test results it is seen<br />
that at 300mA current the<br />
change in pick-up output is<br />
varying from 10-16mV <strong>for</strong><br />
various misaligned positions.<br />
Fig. 2 shows the simulated<br />
laboratory test result <strong>for</strong> change<br />
in pick-up voltage with and<br />
without target when the axial<br />
misalignment is 45mm between<br />
primary and secondary side.<br />
The maximum change <strong>for</strong><br />
45mm comes out to be 13mV<br />
which can indicate the position<br />
of DSR.<br />
Thus, from the experimental<br />
results of the simulated sodium<br />
testing, it can be observed that<br />
the proposed configuration is<br />
able to give a measurable<br />
change in pick-up output (10-<br />
16mV) <strong>for</strong> different misaligned<br />
positions and hence, can be<br />
applied <strong>for</strong> position detection<br />
of DSR in the fast reactors.<br />
Fig.2 Pick-up output voltage variation<br />
with frequency with 45mm axial<br />
misalignment<br />
III.E.6. Techniques <strong>for</strong> Assessing Concrete Damage<br />
In the secondary circuits of<br />
Fast Breeder Reactors, if a<br />
sodium spillage occurs on<br />
concrete, sodium - concrete<br />
reaction takes place and the<br />
concrete gets weakened. To<br />
assess the damage, Differential<br />
Thermal Analysis (DTA) and<br />
Fourier Trans<strong>for</strong>m Infrared<br />
Spectroscopy (FTIR) techniques<br />
have been adopted. The status<br />
of the sodium interacted<br />
concrete has been evaluated by<br />
studying the change in<br />
Ca(OH) 2 content through DTA<br />
and O-H stretching frequencies<br />
through FTIR techniques. To<br />
study these techniques, blocks<br />
of specially cast limestone<br />
concrete with a square cavity<br />
were exposed to burning liquid<br />
sodium at initial temperature of<br />
873 K <strong>for</strong> 30 minutes in open<br />
Amount of Ca(OH) 2<br />
(%)<br />
7.0<br />
6.5<br />
6.0<br />
5.5<br />
5.0<br />
4.5<br />
4.0<br />
3.5<br />
3.0<br />
2.5<br />
2.0<br />
10 20 30 40 50<br />
Depth from the interacting surface (mm)<br />
Fig.1 Variation of Ca(OH) 2 content<br />
as a function of depth<br />
air. Samples were collected<br />
from 5 locations of the cavity<br />
floor of the sodium interacted<br />
blocks. From each location 5<br />
samples were taken <strong>for</strong> every 1<br />
cm depth.<br />
Differential thermal analysis<br />
(DTA) technique<br />
Ca(OH) 2 is one of the<br />
hydration products of Portland<br />
Cement and is in the range of 6<br />
to 7 % in concrete. It<br />
decomposes in the temperature<br />
range 753 to 773 K<br />
endothermically. DTA is a<br />
76 R&D FOR FBRs
IGC<br />
<strong>Annual</strong> <strong>Report</strong> 2007<br />
Absorbance<br />
(a)<br />
ν 4<br />
712<br />
*<br />
ν 2<br />
876<br />
Raman<br />
1070<br />
1425<br />
ν 3<br />
*<br />
Reference<br />
10 mm<br />
20 mm<br />
Absorbance<br />
2ν 2 +ν 4<br />
500 1000 1500 2000 2500 3000 3500 4000<br />
Wavenumber (cm -1 )<br />
convenient method to estimate<br />
the Ca(OH) 2 content through its<br />
characteristic decomposition.<br />
The content of Ca(OH) 2 as<br />
obtained from the peak area at<br />
753 K from DTA, is plotted as a<br />
function of depth <strong>for</strong> the<br />
samples from one of the blocks<br />
in Fig.1. From the figure it is<br />
clear that the concentration is<br />
increasing linearly up to about<br />
40 mm depth of interacted<br />
concrete. Thus it is clear that<br />
DTA is a sensitive means to<br />
obtain the Ca(OH) 2 content,<br />
which in turn is an indicator of<br />
the concrete damage.<br />
Fourier trans<strong>for</strong>m infrared<br />
(FTIR) studies<br />
Alternatively, the quality of<br />
concrete can also be<br />
determined from their<br />
characteristic stretching<br />
frequencies from the mid<br />
infrared region absorption<br />
spectrum. Control runs have<br />
also been carried out to<br />
delineate the thermal effects of<br />
sodium fire from that of the<br />
chemical interaction effects.<br />
Definite signatures of<br />
3110<br />
3240<br />
2ν 3<br />
10 mm<br />
3643<br />
20 mm<br />
Reference<br />
3000 3250 3500 3750<br />
Wavenumber (cm -1 )<br />
Fig.2a Room temperature infrared<br />
spectra of reference sample along<br />
with sodium exposed samples<br />
removed from 10 and 20 mm from<br />
the affected surface of concrete<br />
thermochemical degradation<br />
indicating dehydration and<br />
structural modification of the<br />
limestone concrete have been<br />
obtained <strong>for</strong> the first time using<br />
this technique.<br />
Fig.2a shows the room<br />
temperature mid infrared<br />
spectrum of the limestone<br />
aggregate reference concrete<br />
along with the spectra of<br />
sodium exposed samples as a<br />
function of depth. The spectrum<br />
revealed the broad absorption<br />
feature centered around 3500<br />
cm -1<br />
attributed to stretching<br />
mode of bound water in<br />
concrete. In particular the<br />
sharp feature at 3643 cm -1<br />
riding on the broad water<br />
background is said to arise due<br />
to the O-H stretching of<br />
Ca(OH) 2 - the major hydration<br />
product of Portland Cement.<br />
Estimating the area under this<br />
peak at 3643 cm -1 could follow<br />
the extent of degradation of<br />
concrete. It is clearly evident<br />
from the figure that the<br />
spectrum of the sodium<br />
exposed sample removed from<br />
10 mm from the affected<br />
surface shows appreciable<br />
changes as compared to that of<br />
the reference sample. The<br />
stretching modes of water in the<br />
affected sample reveals a<br />
significant softening associated<br />
with a dramatic increase in the<br />
intensity of the low frequency<br />
components as compared to<br />
that of the reference sample<br />
(inset in Fig. 2a). The intensity<br />
of the 3643 cm -1 peak is also<br />
seen to significantly decrease.<br />
These changes indicate the loss<br />
of both free and bound water<br />
from the concrete on account<br />
of sodium exposure, thus<br />
degrading the concrete. The<br />
appearance of a new mode at<br />
1070 cm -1 and the splitting of<br />
the doubly degenerate<br />
ν 3 and ν 4 modes indicate a<br />
structural trans<strong>for</strong>mation of the<br />
limestone aggregates.<br />
Fig.2b shows the changes in<br />
the vibrational frequencies of<br />
the stretching modes of water<br />
as a function of depth from the<br />
affected surface. It is evident<br />
from the figure that the<br />
conversion of bound water into<br />
free water is confined to depths<br />
of 30 mm from affected<br />
surface. Thus infrared<br />
spectroscopy helps to provide<br />
an insight into the changes<br />
occurring at the molecular<br />
level.<br />
Frequency (cm -1 )<br />
3260<br />
3235<br />
3210<br />
3185<br />
3450<br />
3425<br />
3400<br />
3375<br />
3615<br />
3590<br />
3565<br />
(b)<br />
A<br />
B<br />
C<br />
D<br />
Ref<br />
3540<br />
0 25 50 100<br />
Distance from surface (mm)<br />
Fig.2b Variation of stretching<br />
frequencies of water as a function of<br />
depth from the affected surface of<br />
concrete. Half shaded circles<br />
correspond to the unexposed<br />
reference samples. A, B, C and D<br />
Correspond to various location on<br />
the sodium interacted surface<br />
R&D FOR FBRs 77
IGC<br />
<strong>Annual</strong> <strong>Report</strong> 2007<br />
III.E.7. Characteristics of Debris Bed Formed by Woods<br />
Metal Melt Stream - Water Thermal Interaction<br />
Under a postulated, very low<br />
probability core meltdown<br />
scenario of a Fast Reactor, the<br />
physical status of debris<br />
generated during the molten<br />
fuel interaction with the<br />
coolant, plays a crucial role <strong>for</strong><br />
the post accidental decay heat<br />
removal. Towards this, simulant<br />
thermal interaction experiments<br />
with woods metal melt-water<br />
system under gravity driven<br />
stream mode are being carried<br />
out. The physical properties<br />
(such as density, surface tension<br />
and kinematic viscosity) of<br />
liquid woods metal (a fusible<br />
bismuth based low melting<br />
point alloy with 50 % Bi, 25 %<br />
Pb, 12.5 % Sn, and 12.5 % Cd<br />
with melting point at<br />
345 K) and liquid uranium<br />
dioxide are similar. The low<br />
Fig.1 Melt release system<br />
Fig.2 Jet breakup<br />
melting point of woods metal<br />
facilitates experimentation on<br />
both hydrodynamic and thermal<br />
fragmentation phenomena. The<br />
experimental melt release<br />
system is shown in Fig.1.<br />
Molten woods metal heated to<br />
a temperature 373 K in an<br />
alumina crucible, is released<br />
through a nozzle of 8 mm<br />
diameter into a water column of<br />
70 cm height at a rate of ~<br />
600 g/s. The melt release rate<br />
has been assessed from the<br />
readings from the online<br />
electronic mass balance.<br />
Stream break up length is<br />
assessed to be 110 mm from<br />
the processed high speed melt<br />
stream images taken at 100 fps<br />
(Fig.2), which agree closely with<br />
the theoretical value predicted<br />
from Raleigh-Taylor instability<br />
consideration. The debris heap<br />
<strong>for</strong>med is shown in Fig.3. The<br />
bed profile measurements are<br />
processed in MATLAB to get its<br />
volume and hence the average<br />
bed porosity. Solidified debris<br />
constituted the heap, and the<br />
observed average bed height<br />
(<strong>for</strong> 20 kg run), bed porosity<br />
and heap repose angle are 15<br />
cm, ~0.61 and 42°<br />
respectively. No significant<br />
changes in the heap porosity<br />
and debris size spectrum are<br />
observed with variation in initial<br />
inventory. Experiments are<br />
repeated at elevated melt<br />
Fig.3 Heap <strong>for</strong>mation<br />
78 R&D FOR FBRs
IGC<br />
<strong>Annual</strong> <strong>Report</strong> 2007<br />
temperatures of 433 K and 493<br />
K with a melt inventory of 20<br />
kg. The debris size distribution<br />
obtained with different melt<br />
temperatures are shown in Fig.<br />
4. For a melt temperature of<br />
493 K the bed porosity<br />
decreased to 0.466. This<br />
in<strong>for</strong>mation on debris bed<br />
characteristics are being further<br />
processed to address the reality<br />
in a sodium cooled fast reactor<br />
and the results can still be used<br />
as first approximation to assess<br />
recriticality and bed coolability<br />
of relocated molten core<br />
material.<br />
Particle size (mm)<br />
10<br />
1<br />
0.1<br />
0.1 1 5 20 40 60 80 95 99 99.9 99.999<br />
Cumulative mass percentage %<br />
Fig.4 Size distributions at different melt temperatures<br />
WM 371 K<br />
WM 433 K<br />
WM 493 K<br />
III.E.8. Variations in Biofouling Settlement Pattern<br />
in the Coastal Waters of Kalpakkam<br />
Coastal power plants, which<br />
use seawater <strong>for</strong> cooling the<br />
condenser and other auxiliary<br />
systems, face great monetary<br />
losses due to the settlement of<br />
marine sedentary organisms.<br />
These organisms are identified<br />
as "Biofouling organisms" or<br />
"Biofoulers" and the process is<br />
Fig.1 Variations in settlement<br />
pattern of biofouling organisms<br />
on weekly panels during the<br />
period May 2006 - April 2007.<br />
known as "Biofouling", which<br />
creates major operational<br />
problems such as condenser<br />
tube blockages, reduction in<br />
heat transfer, increased<br />
pressure drop and pump<br />
vibration etc. PFBR is going to<br />
use about 30 m 3 /s of seawater<br />
<strong>for</strong> cooling. In order to devise<br />
an effective biofouling control<br />
measure <strong>for</strong> PFBR cooling water<br />
system, it is essential that the<br />
present biofouling potential<br />
(qualitative, quantitative and<br />
their variations) at Kalpakkam<br />
coastal water is studied. In view<br />
of this, a study was carried out<br />
with the objectives, to find out<br />
a) the present settlement<br />
Fig.2 A view of a teak wood panel<br />
exposed to coastal water at<br />
Kalpakkam <strong>for</strong> 7 days<br />
pattern of biofoulers and b)<br />
seasonal succession of<br />
macrofoulants. Teak wood<br />
panels (size 12 x 9 x 0.3 cm)<br />
were suspended at 1 m depth<br />
below the lowest low water<br />
mark approximately 400 m<br />
away from the shoreline on<br />
epoxy coated mild steel frames<br />
R&D FOR FBRs 79
IGC<br />
<strong>Annual</strong> <strong>Report</strong> 2007<br />
from the jetty of Madras <strong>Atomic</strong><br />
Power Station. Three series of<br />
observations (weekly, monthly<br />
and cumulative at 30 d<br />
intervals) were made. Different<br />
evaluating parameters viz.<br />
composition of organisms,<br />
number of organisms settled on<br />
the panels, both % of number<br />
and % of area coverage and<br />
biomass (g/100 cm 2 ) have been<br />
used to study the fouling<br />
pattern.<br />
A substantial temporal<br />
variation in fouling pattern was<br />
observed with respect to all the<br />
parameters evaluated. A wide<br />
Fig.3 A view of a teak wood panel exposed<br />
to coastal water at Kalpakkam <strong>for</strong> 30 days<br />
variation was observed in the<br />
number of settled organisms on<br />
weekly panels (Fig. 1). Major<br />
fouling organisms observed<br />
during the study were<br />
barnacles, hydroids, ascidians,<br />
oysters, sea anemones and<br />
green mussels. In addition to<br />
these sedentary organisms,<br />
epizoic animals like errant<br />
polychaetes, flat worms,<br />
amphipods, crabs were also<br />
observed. A wide variation in<br />
the settlement pattern of the<br />
weekly panels was observed<br />
with the range of 1-136<br />
numbers per sq.cm, however, in<br />
the monthly panels the number<br />
of organisms per sq. cm ranged<br />
from 11-69 due to increase in<br />
the size of foulers. Result<br />
showed that the fouling<br />
intensity was significantly<br />
different between the successive<br />
weeks. .<br />
The percentage of area<br />
coverage of weekly panels<br />
showed a well-marked<br />
variation, ranged between 0.08<br />
and 100%, whereas, in case of<br />
monthly and cumulative panels,<br />
it was found to be 89 - 100%<br />
and 100% respectively.<br />
Barnacles and mussels were<br />
found to be the major<br />
macrofoulants in this coastal<br />
water. A substantial increase in<br />
biomass was noticed with time<br />
(Fig. 2, 3, 4). For example,<br />
biomass observed on 7 d, 28<br />
d, 56 d, 112 d and 150 d is<br />
11, 77, 97,185 and 648<br />
g/100 cm 2 respectively.<br />
Pronounced variations were<br />
also observed in case of the<br />
species diversity, species<br />
richness and evenness values.<br />
The unique feature of this study<br />
is that the photographs of each<br />
series were taken and available<br />
in digital <strong>for</strong>m. Fouling pattern<br />
at an interval of 7 d was<br />
observed <strong>for</strong> the first time in this<br />
coast. Result of this study could<br />
be used <strong>for</strong> arriving at more<br />
effective biofouling control<br />
regime in cooling water system<br />
of PFBR.<br />
Fig.4 A view of 112 d old panel, covered with green mussels (Perna viridis)<br />
80 R&D FOR FBRs
Chapter -4<br />
FUEL CYCLE<br />
IV.A. Fuel Properties and Per<strong>for</strong>mance<br />
IV.A.1. Recovery of Plutonium and Americium from<br />
Waste Matrices by Supercritical Fluid Extraction<br />
Handling of plutonium in a radioactive laboratory involves the usage of tissue paper and<br />
recovery of plutonium from the same assumes significance from the point of view of<br />
accounting of special nuclear material (SNM) as well as radioactive waste management.<br />
Supercritical Fluid Extraction (SFE) technique, which produces relatively less or no secondary<br />
waste, is very much preferable <strong>for</strong> such applications. Supercritical fluids possess the properties<br />
of gas-like diffusivity and viscosity, liquid-like density and low surface tension, which help<br />
them to easily penetrate through the pores of the sample matrix and extract the components<br />
of interest more efficiently. Supercritical fluids provide faster, cleaner and efficient extractions,
IGC<br />
<strong>Annual</strong> <strong>Report</strong> 2007<br />
3<br />
4<br />
2<br />
Fig.1 SFE facility in glove box.<br />
Components such as pumping<br />
systems of CO2 and modifier were<br />
kept outside glove box. (not shown<br />
in picture). 1. Secondary vessel<br />
accommodates in it primary<br />
extraction vessel with its constant<br />
temperature heating system 2. Panel<br />
incorporating various SS lines, check<br />
valves and needle valves<br />
3. Backpressure regulator and<br />
4. Plutonium collection.<br />
and they become gas at the<br />
end of extraction and escape<br />
leaving the dissolved solute.<br />
Thus SFE technique provides an<br />
excellent alternative to recover<br />
the actinides with minimum<br />
generation of secondary liquid<br />
waste.<br />
SFE based procedures were<br />
earlier developed in our<br />
laboratory <strong>for</strong> the recovery of<br />
uranium from tissue paper<br />
waste, removal of silicone oil<br />
from urania microspheres,<br />
separation of uranium from<br />
thorium etc.<br />
An SFE system (Fig.1) was setup<br />
in a glove box <strong>for</strong> studies<br />
involving plutonium. The glove<br />
box facility was modified<br />
suitably <strong>for</strong> safely handling<br />
radioactive materials under<br />
high pressure conditions. The<br />
primary extraction vessel was<br />
1<br />
accommodated in a secondary<br />
vessel in order to contain any<br />
accidental release of gaseous<br />
carbon dioxide from it, which<br />
may otherwise damage the<br />
negative pressure environment<br />
of the glove box. The two<br />
pumps used <strong>for</strong> pumping liquid<br />
carbon dioxide and the<br />
modifier containing extractants<br />
in methanol were placed<br />
outside the glove box. However<br />
the backpressure regulator and<br />
heating oven, which<br />
accommodated the extraction<br />
vessel were housed inside the<br />
glove box. The collection<br />
Pu(IV) recovery (cumulative %)<br />
100 2<br />
80<br />
60<br />
40<br />
20<br />
SFE of Pu(IV) with SC-CO 2<br />
modified with<br />
CMPO in MeOH with 0.16 N HNO 3<br />
CMPO in MeOH<br />
0<br />
0 15 30 45 60<br />
Extraction period (min)<br />
Fig.2 Extraction profile <strong>for</strong> Pu(IV)<br />
from simulated waste. Sample: Pu(IV)<br />
( 5 g) loaded on to a tissue paper.<br />
Experimental conditions: CO2 flow<br />
rate: 2.5 mL/min; Modifiers: (1). 2 wt<br />
% CMPO in methanol and (2). 2 wt %<br />
CMPO in methanol with 0.16 N HNO3,<br />
flow rate: 0.25 mL/min. Pressure: 300<br />
bar, and Temperature: 308 K.<br />
system was also arranged<br />
inside the glove box, from<br />
which the extracted sample was<br />
taken out <strong>for</strong> assay.<br />
1<br />
Studies on the extraction<br />
behaviour of plutonium loaded<br />
onto a tissue paper were<br />
carried out using supercritical<br />
carbon dioxide (Sc-CO2)<br />
modified with various ligands.<br />
Complete extraction of Pu(IV) in<br />
its nitrate <strong>for</strong>m from tissue<br />
paper matrix was achieved <strong>for</strong><br />
the first time using Sc-CO2<br />
modified with n-octyl(phenyl)-<br />
N , N - d i i s o b u t y l<br />
carbamoylmethyl phosphine<br />
oxide ( CMPO) in methanol<br />
containing 0.16 N HNO3<br />
(Fig.2). Pu (IV) was also<br />
completely removed from other<br />
matrices such as teflon,<br />
stainless steel and glass.<br />
Complete recovery of Pu(IV)<br />
was demonstrated <strong>for</strong> tissue<br />
paper matrix containing 5, 25<br />
and 50 g plutonium. Complete<br />
extraction was also obtained<br />
<strong>for</strong> Pu (III) and Am(III) under<br />
similar experimental conditions.<br />
Besides the simulated waste,<br />
recovery of Pu (IV) from actual<br />
tissue paper waste generated in<br />
the laboratory was also<br />
demonstrated satisfactorily.<br />
Future endeavor envisages<br />
the development of procedures<br />
to recover plutonium present in<br />
powder <strong>for</strong>m in various waste<br />
matrices. The development of a<br />
large scale facility <strong>for</strong> the<br />
actinide decontamination of<br />
various matrices is the ultimate<br />
objective of these ef<strong>for</strong>ts.<br />
82 FUEL CYCLE
IGC<br />
<strong>Annual</strong> <strong>Report</strong> 2007<br />
IV.A.2. Radiation Stable Resins <strong>for</strong> the Recovery of<br />
Actinides and Palladium<br />
The purification and<br />
concentration of plutonium<br />
from dilute process solutions<br />
are major steps in nuclear spent<br />
fuel reprocessing in current<br />
PUREX plants. Due to its<br />
simplicity, ion exchange<br />
processes have advantages<br />
over the other separation<br />
methods <strong>for</strong> the concentration<br />
and purification of plutonium.<br />
Anion exchange process is<br />
being commonly used by most<br />
of the nuclear plants and<br />
laboratories <strong>for</strong> plutonium<br />
processing and purifications.<br />
The inability of several elements<br />
to <strong>for</strong>m the anionic complexes<br />
in nitric acid solution makes it<br />
possible to get a better<br />
decontamination factor. The<br />
conventional anion exchange<br />
resins have a styrene-DVB<br />
based coplymers matrix.<br />
In India, the purification and<br />
concentration of plutonium is<br />
carried out by conventional<br />
anion exchange. The two major<br />
problems which have been<br />
encountered during plutonium<br />
purification using the anionexchange<br />
process are<br />
i) very slow sorption and<br />
desorption kinetics,<br />
ii) radiation degradation of<br />
the anion-exchange resin in<br />
intense radiationfield.<br />
The use of resin beads with<br />
high porosity and lower bead<br />
size is preferred to overcome<br />
the slow kinetics. The<br />
combination of hostile<br />
conditions such as high<br />
radiation and concentrated<br />
nitric acid can degrade the<br />
resins and various accidents<br />
had been reported during the<br />
anion-exchange process of<br />
plutonium purification. Thus,<br />
anion-exchange resins, which<br />
possess high radiation and<br />
chemical stability, are preferred<br />
<strong>for</strong> the purification of<br />
plutonium. From the literature it<br />
is found that pyridine-based ion<br />
exchangers have the highest<br />
order of radiation stability. This<br />
is because vinylpyridine resins<br />
are less susceptible to<br />
electrophilic attack than the<br />
styrene-based resins. At the<br />
centre, a programme has been<br />
initiated to synthesise and<br />
develop gel-type 4-<br />
vinylpyridine(PVP) resins <strong>for</strong><br />
plutonium processing and<br />
precious metal recovery. The<br />
PVP resins were synthesized by<br />
suspension polymerization<br />
technique and after that resin<br />
was methylated with<br />
iodomethane. Three different<br />
cross-linked (4, 8, and 12%)<br />
gel-type 4-vinylpyridine resins<br />
were characterized, and<br />
evaluated <strong>for</strong> processing and<br />
purification of plutonium and<br />
palladium from nitric acid<br />
medium. For palladium<br />
recovery PVP resin was used as<br />
it is and <strong>for</strong> plutonium<br />
methylated resin was used. The<br />
results were compared with<br />
those obtained with the<br />
conventional anion-exchange<br />
resin namely, Dowex 1X4,<br />
which has been studied<br />
extensively.<br />
Variation of DPu(IV) as a<br />
function of acidity<br />
From Fig.1 its is seen that<br />
D Pu(IV) value of 4% cross-linked<br />
PVP resin is lowest at all<br />
acidities and <strong>for</strong> 8% the D Pu(IV) is<br />
highest. In Dowex 1x4, the<br />
maximum D Pu(IV) value is<br />
attained at 7 - 8 M, whereas <strong>for</strong><br />
PVP resins, the maximum shifts<br />
towards 8 - 10 M nitric acid.<br />
The D Pu(IV) <strong>for</strong> 8% and 12%<br />
crosslinked resins is high as<br />
compared to Dowex 1X4.<br />
Elution studies<br />
The column per<strong>for</strong>mance of<br />
PVP resins was compared with<br />
that of Dowex 1X4 under<br />
similar conditions. Pu(IV) was<br />
loaded from 8 M nitric acid and<br />
FUEL CYCLE 83
IGC<br />
<strong>Annual</strong> <strong>Report</strong> 2007<br />
Fig.1 Variation of D Pu(IV) with nitric<br />
acid concentration.<br />
after washing the column, it<br />
was eluted with 0.5 M nitric<br />
acid. It is seen from Fig.2 that<br />
<strong>for</strong> 4% PVP resin, about 99.8%<br />
of the loaded plutonium could<br />
be eluted within 3 bed volumes,<br />
whereas <strong>for</strong> 8% PVP about 93%<br />
of plutonium could be eluted.<br />
The 12% resin shows a poor<br />
and incomplete elution pattern;<br />
only 86% of plutonium could<br />
be eluted within 5 bed volumes.<br />
Under similar conditions Dowex<br />
1X4 also exhibits poor and<br />
incomplete elution pattern.<br />
Even after 6 bed volumes only<br />
about 66% of the loaded Pu<br />
could be eluted.<br />
Fig.2 Elution profile of PVP resins<br />
and Dowex 1X4.<br />
Radiation degradation<br />
The resins were irradiated in a<br />
Co-60 gamma chamber in<br />
presence of 8 M nitric acid,<br />
after which the resins were<br />
analysed <strong>for</strong> capacity, moisture<br />
content and Pu distribution<br />
ratios. All the resins were<br />
irradiated up to 200 MRad of<br />
total absorbed dose. As<br />
expected, <strong>for</strong> all the resins the<br />
D Pu(IV) decreased with the<br />
increase in dose. The value of<br />
D Pu(IV)<br />
of 200 MRad irradiated<br />
8% PVP resin was nearly<br />
identical to that of 100 MRad<br />
irradiated Dowex 1X4. At 200<br />
MRad of total cumulative dose,<br />
PVP resin shows little damage<br />
in the <strong>for</strong>m of dimples over<br />
bead surface (Fig.3) but it takes<br />
up plutonium over a range of<br />
nitric acid concentration,<br />
whereas Dowex 1X4 was<br />
completely degraded. As the<br />
total absorbed dose increases,<br />
the strong-base capacity of the<br />
resin decreases, indicating the<br />
deterioration of functional<br />
group (i.e. methyl group) upon<br />
irradiation. The deterioration of<br />
the polymer matrix upon<br />
irradiation is also manifested in<br />
the increase in moisture content<br />
of the irradiated resin and<br />
increase in volume of resin.<br />
Palladium recovery<br />
Palladium is a precious metal<br />
with good catalytic, corrosion<br />
and oxidation resistant<br />
properties, which have resulted<br />
in its widespread use in<br />
different industries. The natural<br />
abundance of palladium is very<br />
low and thus, there is an<br />
incentive in recovering<br />
palladium from the high level<br />
Fig.3 SEM images of unirradiated and<br />
200 MRad irradiated 8% PVP resin.<br />
waste generated in Fast Reactor<br />
Fuel Reprocessing. At <strong>IGCAR</strong>,<br />
we have developed a method<br />
<strong>for</strong> the recovery of palladium<br />
from nitric acid medium. We<br />
have used 8% PVP resin <strong>for</strong> the<br />
recovery of palladium from 2 M<br />
and 4 M nitric acid medium. In<br />
a small column of 7.2 ml about<br />
1000 ml of solution containing<br />
210 ppm of palladium was<br />
passed and it was observed that<br />
even the last 200 ml of effluent<br />
contains less than 2 ppm of<br />
palladium. Similar results were<br />
obtained when 400 ml of<br />
solution containing 800 ppm of<br />
palladium was passed.<br />
Palladium was eluted with 0.5M<br />
thiourea in 0.1M HNO3 and<br />
95% of loaded palladium was<br />
eluted in four-bed volume of<br />
column. When the solution<br />
containing palladium,<br />
ruthenium and rhodium were<br />
passed through the column<br />
only palladium was loaded.<br />
The above studies indicate<br />
that 4-vinylpyridine resins can<br />
be used <strong>for</strong> recovery and<br />
purification of plutonium as<br />
well as <strong>for</strong> the recovery of<br />
palladium from radioactive<br />
waste solutions.<br />
84 FUEL CYCLE
IGC<br />
<strong>Annual</strong> <strong>Report</strong> 2007<br />
IV.A.3. Matrix Effect on Laser Desorption/Ionization of<br />
Uranyl Nitrate Solution in Laser Mass Spectromtry<br />
Development of simple and<br />
direct methods <strong>for</strong><br />
measurement of burn-up of fast<br />
reactor fuels is an important<br />
area. The direct determination<br />
of burn-up based on the<br />
method based on measurement<br />
of intensity ratio (i.e. ratio of<br />
ion intensity corresponding to a<br />
burn-up monitor element to<br />
that corresponding to U)<br />
requires the determination of U<br />
in uranyl nitrate solution. If only<br />
one of the ionic species UO2 + ,<br />
UO + , U + were to be present in<br />
the laser-vaporized plume, the<br />
burn-up measurement could be<br />
subject to error, since the single<br />
species signal may get<br />
saturated. (For 10 at % fission,<br />
the number of atoms of heavy<br />
elements present in a spent fuel<br />
would be a few hundred times<br />
more than that of 143Nd atoms<br />
produced). However, if the U<br />
bearing species U + , UO + and<br />
UO2 + are all present, then the<br />
saturation problem may not<br />
exist. Furthermore, if the ion<br />
intensity of one of the above<br />
species were to become<br />
comparable to that of 143 Nd<br />
bearing species, then<br />
determination of the ratio of<br />
Nd/U will be easier and more<br />
reliable. With these aspects in<br />
mind, a study of the effect of<br />
different matrices such as Tributyl<br />
dissolved in 1 ml of the medium<br />
phosphate (TBP), was loaded on the Al sample<br />
Nicotinic acid and Polyethylene holder (see Fig.1), dried under<br />
oxide (PEO) of molecular IR lamp and transferred to the<br />
weight 2000, on the laser<br />
desorption and ionization of<br />
uranyl nitrate solution was<br />
taken up. The experiments were<br />
carried out using a laser mass<br />
spectrometry system comprising<br />
sample chamber. The samples<br />
contained typically about 10 19<br />
atoms of U. Under low intensity<br />
laser beam, the spread in<br />
kinetic energy of the ions<br />
produced will be low, and thus<br />
of an in-house developed resolution in the mass spectrum<br />
reflectron time-of-flight mass<br />
+<br />
will also be better. Only UO 2<br />
spectrometer. A schematic of and UO + were observed on<br />
the experimental facility is<br />
shown in Fig.1. Methanol was<br />
laser desorption/ionization of<br />
uranyl nitrate solution without<br />
used as the medium <strong>for</strong> PEO any matrix (Fig. 2a). On<br />
and TBP matrices and water addition of a matrix, keeping<br />
was used <strong>for</strong> nicotinic acid all other experimental<br />
matrix. The matrix to sample<br />
ratio was maintained about<br />
100:1. About 10µL of the<br />
conditions same, the signal<br />
intensity increased in all the<br />
three cases. With nicotinic acid<br />
sample and the matrix mixture as the matrix, UO + was the<br />
Fig.1 Laser TOF-MASS Spectrometry - Schematic<br />
FUEL CYCLE 85
IGC<br />
<strong>Annual</strong> <strong>Report</strong> 2007<br />
Fig.2 Effect of matrix on the<br />
signal intensity in the laser<br />
desorption/ionization mass<br />
spectrum of UO 2 (NO 3 ) 2 solution<br />
most intense signal, followed by<br />
UO 2+<br />
and U + (Fig. 2b); with<br />
+<br />
PEO as the matrix, only UO 2<br />
was observed (Fig. 2c); and<br />
with TBP as the matrix UO + and<br />
UO 2+<br />
were the major species<br />
with very small amount of U +<br />
(Fig. 2d). The nicotinic acid<br />
matrix seems to score over<br />
others, since the total U gets<br />
divided into all the three <strong>for</strong>ms<br />
(UO + , UO 2+<br />
, U + ), and the<br />
peaks are also sharper (better<br />
mass resolution). Compared to<br />
the no-matrix condition,<br />
improvement in signal<br />
intensities was observed most<br />
with nicotinic acid as matrix (10<br />
times), implying that use of this<br />
matrix will involve considerable<br />
reduction in the quantity of<br />
sample required <strong>for</strong> the<br />
analysis.<br />
IV.A.4. Thermophysical Property Measurements on Urania-<br />
Thoria and Urania-Gadolinia Solid<br />
Solutions, and U-Zr Alloys<br />
Uranium-thorium mixed<br />
oxides are being considered as<br />
the fuels <strong>for</strong> the thermal<br />
reactors such as Advanced<br />
Heavy Water Reactors and high<br />
temperature gas cooled<br />
reactors. Gadolinium is one of<br />
the major fission products and<br />
its oxide <strong>for</strong>ms solid solutions<br />
C P<br />
(J/K/mol)<br />
100<br />
90<br />
80<br />
70<br />
60<br />
U 0.1 Th 0.9 O 2 Kopp's rule<br />
U 0.5 Th 0.5 O 2 Kopp's rule<br />
U 0.9 Th 0.1 O 2 Kopp's rule<br />
U 0.1 Th 0.9 O 2 Drop<br />
U 0.5 Th 0.5 O 2 Drop<br />
U 0.9 Th 0.1 O 2 Drop<br />
U 0.1 Th 0.9 O 2 DSC<br />
U 0.5 Th 0.5 O 2 DSC<br />
U 0.9 Th 0.1 O 2 DSC<br />
400 800 1200 1600 2000<br />
Temperature (K)<br />
Fig.1 Heat capacity of (U,Th)O 2<br />
Solid solutions<br />
with uranium oxide in the oxide<br />
fuel. Hence the thermophysical<br />
properties of the solid solutions<br />
of urania with thoria and<br />
gadolonia are important. Heat<br />
capacity data are available <strong>for</strong><br />
thoria rich (≤20 mol % urania)<br />
mixed oxides only and that too<br />
over a limited temperature<br />
range. Enthalpy increments of<br />
(U 0.1 Th 0.9 )O 2 , (U 0.5 Th 0.5 ) O2 and<br />
(U 0.9 Th 0.1 )O 2 were measured<br />
by inverse drop calorimetric<br />
method using a high<br />
temperature differential drop<br />
calorimeter in the temperature<br />
range 430-1805 K. Heat<br />
capacity data were computed<br />
from the measured enthalpy<br />
increments.<br />
Direct<br />
measurements of the heat<br />
capacity of these mixed oxides<br />
were also carried out in the<br />
temperature range 300-800 K<br />
using a heat flux differential<br />
scanning calorimeter. It can be<br />
seen from Fig.1that the heat<br />
capacity data of all the three<br />
mixed oxides obtained by two<br />
different calorimetric methods<br />
are in very good agreement<br />
with each other within 3% in<br />
the overlapping regions and<br />
that they are also in agreement<br />
with the values computed using<br />
Neumann-Kopp's rule.<br />
There exists discrepancy in the<br />
literature data <strong>for</strong> the heat<br />
capacity and no data exist <strong>for</strong><br />
high temperature thermal<br />
expansion of urania-gadolinia<br />
solid solutions. Hence, heat<br />
capacity measurements on<br />
( U 0 . 9 G d 0 . 1 ) O 2 . 1 2 5 ,<br />
(U 0.8 Gd 0.2 )O 2.187 and (U 0.5<br />
Gd 0.5 )O 1.984 were carried out<br />
using a heat flux differential<br />
scanning calorimeter in the<br />
temperature range 298-800 K<br />
and the thermal expansion<br />
measurements were per<strong>for</strong>med<br />
86 FUEL CYCLE
IGC<br />
<strong>Annual</strong> <strong>Report</strong> 2007<br />
Thermal expansion (%)<br />
2.5<br />
2.0<br />
1.5<br />
1.0<br />
0.5<br />
0.0<br />
UO 2<br />
10 mol % GdO 1.5<br />
20 mol % GdO 1.5<br />
50 mol % GdO 1.5<br />
Gd 2<br />
O 3<br />
400 800 1200 1600 2000<br />
Temperature (K)<br />
Fig.2 Thermal expansion (%) as a<br />
function of temperature<br />
<strong>for</strong> UO 2 -GdO 1.5 solid solutions<br />
on these solid solutions 298-<br />
1973 K using high temperature<br />
X-ray diffraction. The thermal<br />
expansion of these solid<br />
solutions are shown in Fig.2.<br />
U-Zr metal alloys will be used<br />
as the blanket material in fast<br />
breeder reactors. Hence heat<br />
capacity data of U-Zr alloys is<br />
important. Heat capacity data<br />
of U-Zr alloys are available<br />
only <strong>for</strong> alloys with >13 at.% Zr<br />
. Heat capacity measurements<br />
were carried out on U-Zr alloy<br />
with 2, 5 and 10 wt.% Zr using<br />
heat flux differential calorimeter<br />
in the temperature range 298-<br />
800 K to generate the first<br />
experimental data which are<br />
shown in Fig.3. The measured<br />
heat capacity of pure U along<br />
C p, m<br />
(J K -1 mol -1 )<br />
45<br />
40<br />
35<br />
30<br />
25<br />
C p, m<br />
U<br />
C p, m<br />
U Hulgren et al.<br />
C p, m<br />
U Nakumura et al.<br />
C p, m<br />
U-2 wt.% Zr<br />
C p, m<br />
U-5 wt.% Zr<br />
C p, m<br />
U-10 wt.% Zr<br />
300 400 500 600 700 800 900<br />
Temperature (K)<br />
Fig.3 Heat capacity of U and U-Zr<br />
alloys<br />
with other literature values is<br />
also shown in Fig. 3 along with<br />
the literature values.<br />
IV.A.5. An Automated Facility <strong>for</strong> Charging of Fuel<br />
Micro Spheres into the Sintering Furnace<br />
Fuel preparation in the <strong>for</strong>m<br />
of micro spheres generated by<br />
the SOLGEL process is an<br />
attractive alternative to the<br />
powder route of preparation.<br />
An automated fabrication<br />
facility on the SOLGEL route<br />
has been set up in the<br />
Radiochemistry Laboratory.<br />
The fuel materials in the <strong>for</strong>m<br />
of micro spheres produced by<br />
the gelation process are first<br />
dried and are then to be<br />
loaded in a charge carrier and<br />
placed remotely into a high<br />
temperature furnace <strong>for</strong><br />
sintering.This operation is to be<br />
mechanized and per<strong>for</strong>med<br />
remotely. Towards this,an<br />
automated gripping device<br />
positionable along three coordinates,<br />
<strong>for</strong> positioning and<br />
subsequent lowering of the<br />
charge carrier into the furnace,<br />
has been developed. The<br />
device consists of an<br />
electrically actuated x-y<br />
plat<strong>for</strong>m which is mounted<br />
above the furnace as shown<br />
Fig.1. The plat<strong>for</strong>m which can<br />
be positioned in the horizontal<br />
plane, is holding an electrically<br />
operated telescopic arm fitted<br />
with a pneumatically actuated<br />
two jaw gripper.The Z axis<br />
position indicator mounted on<br />
the plat<strong>for</strong>m indicates the depth<br />
to which the gripper has been<br />
lowered. A reed sensor fixed<br />
on the end effectors is used <strong>for</strong><br />
sensing the gripping<br />
operation.The system has been<br />
commissioned with an overall<br />
positioning accuracy of 0.5<br />
mm.With no direct vision,the<br />
lowering of the charge into the<br />
furnace is assisted by a PAN-<br />
TILT camera ,as shown in the<br />
inset in Fig.1.<br />
Fig.1 Automated gripping devices<br />
<strong>for</strong> the introduction of charge<br />
carrier into the sintering furnace<br />
FUEL CYCLE 87
IGC<br />
<strong>Annual</strong> <strong>Report</strong> 2007<br />
IV.A.6. Dismantling and Metrology of FBTR FSA<br />
and Fuel Pins after 155 GWd/t Burn-up<br />
A new computer controlled<br />
Dimensional-Measurementscum-Laser-Dismantling<br />
(DMLD)<br />
machine was developed and<br />
installed inside the hot cells to<br />
carry out remote metrology and<br />
laser based dismantling of high<br />
burn-up FBTR fuel<br />
subassemblies (FSA). The<br />
machine consists of a<br />
mechanical system located<br />
within the hot cell, and the<br />
associated motion control<br />
system and laser system located<br />
outside the hot cell. Fig.1<br />
shows photographs of the four<br />
axis mechanical system of the<br />
machine.<br />
High level of gamma<br />
radiation, de<strong>for</strong>med nature of<br />
the FSA and the requirement of<br />
high level of measurement<br />
accuracy provided immense<br />
challenges in developing this<br />
machine especially <strong>for</strong> remote<br />
operation and maintenance.<br />
Laser-based cutting was<br />
adopted due to its favorable<br />
features such as fast and noncontact<br />
nature of cutting,<br />
absence of moving parts, ease<br />
of remote operation, minimum<br />
remote repair/replacement of<br />
parts, absence of coolant and<br />
minimum generation of waste<br />
such as dust, chips etc.<br />
However challenges were<br />
involved in delivering the<br />
required laser power precisely<br />
at the cutting location with<br />
optimized parameters and<br />
avoiding welding between the<br />
outer and inner hexagonal<br />
sheaths of FSA during cutting.<br />
Precise dimensional<br />
measurement of the FSA is<br />
required to assess whether the<br />
incremental de<strong>for</strong>mations due<br />
to irradiation is likely to pose<br />
any constraints in the fuel<br />
handling operations, and<br />
thereby limit the burn-up of the<br />
fuel. The DMLD machine make<br />
use of an induction type touch<br />
trigger sensor mounted on the<br />
YZ- stage and a custom- made<br />
motion control software <strong>for</strong><br />
dimensional measurements of<br />
the FSA. The machine<br />
automatically acquires the<br />
coordinates of large number of<br />
surface points at various cross<br />
sections along the length of the<br />
FSA through automatic<br />
scanning as defined by the user.<br />
These cross-sections of the FSA<br />
are reconstructed by plotting<br />
this data in the 2D drafting<br />
environment of CAD software.<br />
The width-across-flat and<br />
corner-to-corner distance of<br />
various cross sections are<br />
(a) Outside hot cell<br />
(b) Inside hot cell<br />
Fig.1 Photographs of the mechanical system of the DMLD machine<br />
88 FUEL CYCLE
IGC<br />
<strong>Annual</strong> <strong>Report</strong> 2007<br />
Table 2 : Results of dimensional measurements on FSA and fuel pins after154GWD/t burn-up<br />
measured from the<br />
reconstructed cross sections. By<br />
assembling various crosssections<br />
in the 3D-modelling<br />
environment of CAM software,<br />
the 3D wire frame model of the<br />
FSA is reconstructed. The<br />
magnitude and direction of the<br />
head-to-foot misalignment,<br />
angular twist etc., are<br />
measured from this model.<br />
The machine was used to<br />
carry out metrology and<br />
dismantling of the FBTR FSA<br />
that was discharged after a<br />
burn-up of 155 GWd/t. The<br />
reconstructed cross sections of<br />
the FSA at some typical axial<br />
locations are shown in Fig.2.<br />
Dimensional accuracy of these<br />
figures lies within + 0.015mm.<br />
The variation of flat-to-flat<br />
distance along the length of the<br />
FSA is shown in Fig.3. The<br />
maximum increase in flat-to-flat<br />
distance and corner-to-corner<br />
distance observed are<br />
respectively 0.7mm and<br />
0.68mm, and they occur at the<br />
region corresponding to the<br />
centre of the fuel column.<br />
Fig.4 shows the reconstructed<br />
wire-frame model of the FSA.<br />
The head-to-foot misalignment<br />
of the FSA was found to be<br />
the FSA after cutting the inner<br />
and outer hexagonal sheaths<br />
transversely using laser at the<br />
7.5mm and no twist was location 605mm from the foot<br />
observed.<br />
end of the FSA.<br />
Fig. 5 shows the Nd-YAG 13 selected fuel pins<br />
laser system developed by extracted from the FSA were<br />
RRCAT, Indore, <strong>for</strong> laser cutting. subjected to length and<br />
The power and signal cables diameter measurements. Length<br />
and the fibre optic cable which was measured using a<br />
delivers the laser power at the measuring bench fitted with dial<br />
cutting torch pass through gauges and working on<br />
specially designed leak-tight<br />
penetrations in the cell wall.<br />
comparison principle with an<br />
accuracy of ± 0.02mm. The<br />
The DMLD machine has increase in lengths of fuel pins<br />
additional provision <strong>for</strong> cutting<br />
the FSA with a motorized<br />
diamond wheel. The fuel pin<br />
bundle was disengaged from<br />
measured was found to vary<br />
from 1.89mm to 4.28mm. A<br />
fuel pin profilometer with two<br />
linearly variable differential<br />
Fig.2 The reconstructed cross sections of high burn-up FSA.<br />
FUEL CYCLE 89
IGC<br />
<strong>Annual</strong> <strong>Report</strong> 2007<br />
transducers (LVDT) fixed on a<br />
motorized carriage was used<br />
measurement accuracy of this<br />
device is ± 0.005mm. A plot<br />
5.400<br />
Fuel Pin Diameter measurements - Pin no. 05E1<br />
<strong>for</strong> scanning the fuel pins along<br />
of the diameter variation along<br />
the length <strong>for</strong> diameter<br />
measurements.<br />
The<br />
the length of a fuel pin in two<br />
perpendicular orientations is<br />
Diameter of fuel pin in mm<br />
5.300<br />
5.200<br />
5.100<br />
5.000<br />
0.00 100.00 200.00 300.00 400.00 500.00<br />
Distance from bottom end in mm<br />
Orientation-1<br />
Orientation-2<br />
Fig. 6 Variation in diameter along the<br />
length of a fuel pin<br />
Fig. 3 Variation of flat-to-flat distance along the length of the FSA<br />
Fig. 4 Reconstructed wire-frame model of the FSA<br />
Fig. 5 Nd-YAG Laser system developed by RRCAT<br />
shown in Fig.6. It can be seen<br />
that fuel pin clad has<br />
undergone increase in diameter<br />
in the fuel column region. The<br />
maximum increase in diameter<br />
in various fuel pins vary from<br />
0.17mm to 0.27mm at the<br />
centre of fuel column. The<br />
results of dimensional<br />
measurements on FSA and fuel<br />
pins are summarized in Table.1.<br />
It indicates that there is<br />
significant increase in<br />
dimensions after 155 GWd/ t<br />
burn-up.<br />
Along with other PIE results,<br />
the results of dimensional<br />
measurements of the FSA and<br />
fuel pins will help in<br />
determining the residual life of<br />
the FSAs. The experience<br />
gained during the development<br />
of the above machine will be<br />
utilized to develop a<br />
production-scale system <strong>for</strong> the<br />
inspection and dismantling of<br />
PFBR FSAs prior to<br />
reprocessing.<br />
90 FUEL CYCLE
IGC<br />
<strong>Annual</strong> <strong>Report</strong> 2007<br />
IV.A.7. Development of Remote Inspection Devices<br />
Poolside Spent Sub-assembly Inspection Bench <strong>for</strong> PFBR<br />
A prototype special purpose<br />
remote inspection bench has<br />
been developed to carry out the<br />
dimensional measurement /<br />
profilometry and visual<br />
examination of spent subassemblies<br />
(SA) of PFBR at the<br />
spent fuel storage pool. The<br />
main purpose of dimensional<br />
measurement/profilometry of<br />
spent SA is to evaluate the<br />
extent of irradiation-induced<br />
de<strong>for</strong>mation like bow, bulge<br />
across the faces and elongation<br />
of hexagonal SA wrapper and<br />
to give a quick feedback on the<br />
per<strong>for</strong>mance of the SA to the<br />
plant operators. The inspection<br />
bench is designed in such a<br />
way that all moving<br />
components excepting the<br />
measuring probes, are kept<br />
above the storage pool<br />
eliminating the need <strong>for</strong><br />
expensive underwater<br />
compatible components. Two<br />
LVDTs have been used as<br />
induction type touch trigger<br />
probes to enable acquisition of<br />
coordinates on the SA surfaces<br />
by respective encoders on the<br />
principal translational axes.<br />
The inspection bench has<br />
been installed and<br />
commissioned at Engineering<br />
Hall No.2. Preliminary testing<br />
of the inspection bench has<br />
been carried out on dummy<br />
PFBR sub-assembly kept in air.<br />
With the acquired surface<br />
coordinates, profiles of the<br />
cross sections along the length<br />
of the SA have been generated<br />
and integrated using standard<br />
modeling software to get a 3D<br />
wire frame model of the SA.<br />
Special VB-based software has<br />
been developed <strong>for</strong> aiding the<br />
standard modeling software in<br />
making the 3D wire frame<br />
model by proper test data<br />
structuring and archival. From<br />
the wire frame model, extent of<br />
de<strong>for</strong>mations such as bulge<br />
across the faces & corners, bow<br />
& elongation of the SA could<br />
be visualized and determined.<br />
From the test results with SA in<br />
air and subsequent<br />
optimization of trigger<br />
parameters and speed of the<br />
scan axes, overall<br />
measurement accuracy is found<br />
to be ±0.2 mm and<br />
repeatability is ±0.1mm.<br />
Fig.1 Test results on dummy SA conducted in air<br />
In order to validate the system<br />
to evaluate bulges across the<br />
hexagonal wrapper faces and<br />
FUEL CYCLE 91
IGC<br />
<strong>Annual</strong> <strong>Report</strong> 2007<br />
Fig.2 In-situ fabricated water tank around the sub-assembly<br />
slewing of the SA, small strips the SA conducted in air are<br />
of known thickness across shown in Fig1.<br />
opposite faces of the SA at<br />
various locations along the<br />
length were introduced. Results<br />
of the test have satisfactorily<br />
revealed the areas of bulges<br />
Following the testing of the SA<br />
in air, testing and validation of<br />
the SA was carried out under<br />
water by enveloping the SA with<br />
and the slope of the SA with an in-situ-fabricated tank<br />
respect to the axis of the SA<br />
base. The results of the tests on<br />
(Fig.2). Sequence of operations<br />
had to be necessarily optimised<br />
<strong>for</strong> testing of SA in water to take<br />
into account the effects of water<br />
turbulence arising due to the<br />
movements of the measurement<br />
axes. The entire SA was<br />
inspected and measurements<br />
were carried out. The<br />
per<strong>for</strong>mance of the inspection<br />
has been found to be<br />
satisfactory and motions of all<br />
four axes have been smooth.<br />
The results of under water<br />
testing of the SA were<br />
compared with the results<br />
obtained during air testing and<br />
the results have been<br />
satisfactory. Exact simulation of<br />
the storage pool could not be<br />
done and the minor deviation<br />
observed during the underwater<br />
testing from the air testing<br />
could be attributed to the small<br />
diameter of the water tank.<br />
2-Axis Scanner <strong>for</strong> Wall Thickness Measurements of CORAL Dissolver Vessel<br />
As part of the in-service<br />
inspection (ISI) of CORAL, it is<br />
required to inspect the dissolver<br />
vessel <strong>for</strong> assessing the loss of<br />
wall thickness due to corrosion.<br />
The dissolver consists of two<br />
cylindrical limbs, namely<br />
dissolver vessel and<br />
electrolyser. The inner diameter<br />
of the vessel is 100 mm and<br />
depth is 560 mm upto sparger<br />
which is at the bottom of the<br />
vessel. In order to inspect the<br />
dissolver vessel <strong>for</strong> evaluating<br />
the loss of wall thickness, a<br />
prototype remote inspection<br />
device was conceptualized and<br />
developed. The device is<br />
essentially, a two axis scanner<br />
having rotation (θ) and vertical<br />
telescopic (Z) motions. The θ -<br />
axis has 360° and Z - axis has<br />
about 450 mm travel ranges.<br />
Each telescopic stage is<br />
connected by two wire ropes<br />
with each one assigned <strong>for</strong> one<br />
direction of motion. A lead<br />
screw and nut mechanism is<br />
adopted <strong>for</strong> the telescopic<br />
motion. Fig. 1 shows the<br />
device being tested in the<br />
mock-up dissolver vessel. The<br />
inspection technique is by<br />
immersion ultrasonic testing<br />
with water as the coupling<br />
medium. Stepper motors are<br />
chosen <strong>for</strong> precisely positioning<br />
the ultrasonic probe around the<br />
internal surface of the vessel<br />
and identifying the inspection<br />
locations without feedback<br />
elements. All materials of the<br />
construction <strong>for</strong> the device are<br />
made of corrosion resistant<br />
steel AISI 304L. Overall size of<br />
92 FUEL CYCLE
IGC<br />
<strong>Annual</strong> <strong>Report</strong> 2007<br />
the device is 220 mm long (in<br />
retracted condition) x ∅ 195<br />
mm enabling it to be deployed<br />
through the glove port and<br />
blister box on to the vessel to<br />
be inspected.<br />
Improvements have been<br />
made in the design of the<br />
telescopic module <strong>for</strong> precise<br />
movement and the device has<br />
been made in two modules to<br />
facilitate deployment into the<br />
containment box. The device<br />
has been tested in a mock-up<br />
vessel under non-active<br />
environment and validated <strong>for</strong><br />
its per<strong>for</strong>mance and reliability.<br />
The per<strong>for</strong>mance of the device<br />
has been found to be<br />
satisfactory as seen in the test<br />
results. Fig.2 shows the<br />
Titanium mock-up dissolver<br />
vessel and figs 3 (a) & (b) show<br />
the ultrasonic test results on the<br />
mock-up vessel. It is planned to<br />
introduce a degree-of-freedom<br />
in the end-effector whereby it<br />
would be possible to<br />
manipulate the ultrasonic<br />
probe so as to enable<br />
inspection of the critical nozzle<br />
welds in the vessel.<br />
FUEL CYCLE 93
IGC<br />
<strong>Annual</strong> <strong>Report</strong> 2007<br />
IV.A.8. Development of Gamma Ray Backscattering<br />
Facility <strong>for</strong> Application to Concrete,<br />
Corrosion & Composites<br />
The need <strong>for</strong> advanced<br />
techniques <strong>for</strong> detection and<br />
evaluation of embedded<br />
corrosion and a class of subsurface<br />
defects that requires<br />
access only to the one side of<br />
any material or structure to be<br />
inspected has drawn attention<br />
to X-ray or gamma backscatter<br />
as a desirable choice. Among<br />
the techniques using X-ray or<br />
gamma radiation, the<br />
transmission modality is usually<br />
employed. However,<br />
transmission measurements<br />
may not always be possible due<br />
to surrounding space<br />
constraints and <strong>for</strong> if the object<br />
is too bulky to produce<br />
sufficient radiation penetration.<br />
Transmission provides lineintegrated<br />
in<strong>for</strong>mation along<br />
the path of radiation from the<br />
source to the detector, which<br />
masks the position of an<br />
anomaly present along the<br />
transmission line. The<br />
Fig.1 Gamma-ray backscattering<br />
scanning facility<br />
scattering modality provides<br />
alternative and in this method<br />
point-wise in<strong>for</strong>mation can be<br />
obtained by focusing the field<br />
of view of the source and<br />
detector so that they interact<br />
around a point. Since both the<br />
source and detector are<br />
located on one side of the<br />
object, examination of<br />
extended structures becomes<br />
possible. The gamma scattering<br />
method is a viable tool <strong>for</strong><br />
inspecting material since it is<br />
an interaction which is strongly<br />
dependent on the electron<br />
density of the scattering<br />
medium, and in turn, its mass<br />
density. There<strong>for</strong>e the<br />
in<strong>for</strong>mation obtained by this<br />
technique is strongly related to<br />
the material density, thus<br />
allowing changes in the<br />
material uni<strong>for</strong>mity to be<br />
monitored.<br />
An indigenous gamma-ray<br />
backscattering scanning facility<br />
has been designed, built and<br />
commissioned. The scanning<br />
system (Fig. 1) consists of four<br />
main modules: the first module<br />
is the source container, second<br />
module houses the detector, the<br />
third is an independent 4-axis<br />
job positioning system and the<br />
Fig. 2 The screen display <strong>for</strong> easy<br />
operation of complete system<br />
through PC<br />
fourth is the control panel and<br />
PC (Fig. 2). The source and<br />
detector modules are mounted<br />
on a fabricated mild steel<br />
frame and driven by AC<br />
servomotors, linear motion<br />
(LM) guides and ball screws.<br />
The axial travel is 500 mm and<br />
the vertical travel is 400 mm<br />
with an accuracy of ± 0.05<br />
mm. Computer Numerical<br />
Control (CNC) rotary tables of<br />
size 170 mm each are mounted<br />
over the Z-axes of the source<br />
and detector modules and the<br />
source and detector units are<br />
housed over these CNC rotary<br />
tables. Provision is available in<br />
the system to use either<br />
horizontal or streamlined side<br />
looking dipstick HPGe<br />
detectors. The source and<br />
detector modules are designed<br />
to support 450 kg load. The<br />
movement of source and<br />
detector units are programmed<br />
94 FUEL CYCLE
IGC<br />
<strong>Annual</strong> <strong>Report</strong> 2007<br />
was written <strong>for</strong> easy operation<br />
of complete system through PC.<br />
Two lead casks were designed<br />
and fabricated to house the γ-<br />
source and the detector and the<br />
lead melting and pouring was<br />
carried out in-house.<br />
Counts<br />
4500<br />
4000<br />
3500<br />
3000<br />
2500<br />
2000<br />
1500<br />
1000<br />
500<br />
200 210 220 230 240 250 260<br />
Energy(KeV)<br />
Corroded<br />
Uncorroded<br />
Fig.3 The PC display of a typical<br />
scattered PHS<br />
and controlled by 8-axes Galil<br />
servo controller through PC.<br />
The 4-axes job positioning<br />
system is an independent unit.<br />
Test samples weighing up to 10<br />
kg can be fixed on the table. It<br />
consists of X, Y, Z, θ stages run<br />
by AC servomotors<br />
programmed and controlled by<br />
Galil servo controller through<br />
PC. The travel lengths available<br />
in this system are 450, 150 and<br />
250mm respectively in X, Y and<br />
Z directions and in addition to<br />
a 360-degree job rotation<br />
provision. The positioning<br />
accuracies of the system are<br />
within ± 10 microns. Two limit<br />
switches and one reference<br />
switch are provided <strong>for</strong> each<br />
axis. Many interlocks are<br />
provided in the system <strong>for</strong> the<br />
safe operation. The source and<br />
detector unit are mounted on<br />
caster wheel with jack. All<br />
electrical controls are mounted<br />
on transportable control panel.<br />
A pointing laser is mounted on<br />
the source and detector<br />
housing <strong>for</strong> easy alignment of<br />
the source and detector. An<br />
operator friendly VB program<br />
A 137 Cs radioactive source of<br />
strength 155.4 GBq with a lead<br />
shielding and a collimated and<br />
shielded 50% efficiency coaxial<br />
HPGe detector providing high<br />
resolution energy dispersive<br />
analysis of the scattered<br />
spectrum are mounted<br />
separately on the source and<br />
detector sub assemblies of 6-<br />
axis system. The per<strong>for</strong>mance<br />
of the system was benchmarked<br />
by studying two Mild Steel (MS)<br />
plates of the same dimensions,<br />
one normal as a standard<br />
reference and another<br />
corroded one <strong>for</strong> corrosion<br />
detection and quantification.<br />
Scanning of the specimen<br />
mounted on 4-axis system was<br />
achieved by its lateral<br />
movement across the source<br />
and detector collimators by<br />
computer commands. The<br />
scattered intensity from the<br />
specified volume element<br />
(voxel) of the MS plate is<br />
detected using the HPGe<br />
detector and the pulse height<br />
spectrum (PHS) was<br />
accumulated and displayed<br />
using an 8K-channel analyzer<br />
which was interfaced with a PC<br />
<strong>for</strong> data storage and analysis.<br />
Fig.4 The photo peak part of<br />
scattered spectra from normal and<br />
corroded MS plates<br />
The display of a typical<br />
scattered PHS recorded with the<br />
number of channels nearly<br />
equal to 2000 with each<br />
channel width of 0.374 keV is<br />
shown in Fig. 3 and the photo<br />
peak parts of the scattered<br />
spectra from normal and<br />
corroded MS plates are shown<br />
in Fig.4. The photo peak<br />
intensity of scattered spectra<br />
plotted <strong>for</strong> normal and<br />
corroded MS plate regions is<br />
shown in Fig. 5. It can be seen<br />
clearly from this figure that the<br />
scattered intensity decreases as<br />
one move from normal to the<br />
corroded MS plate.<br />
To provide a sound<br />
theoretical proof <strong>for</strong> the<br />
Fig.5 The photo peak intensity of<br />
normal and <strong>for</strong> corroded regions of<br />
MS plates<br />
FUEL CYCLE 95
IGC<br />
<strong>Annual</strong> <strong>Report</strong> 2007<br />
experimental analysis of<br />
detection and quantification of<br />
corrosion in mild steel by<br />
gamma ray scattering the<br />
Monte Carlo simulations have<br />
been done by using the Monte<br />
Carlo N- Particle (MCNP) code,<br />
which takes into account the<br />
detailed characteristics of the<br />
source, detector and the<br />
scatterer in calculating the<br />
gamma scattered intensity from<br />
the MS plates. The result of<br />
MCNP PHS simulations and<br />
their comparison with the<br />
experimental ones are shown in<br />
Fig. 6 <strong>for</strong> the normal MS plate<br />
and in Fig. 7 <strong>for</strong> the corroded<br />
one. A good agreement in the<br />
shape of the PHS is seen<br />
between the experimental<br />
spectra and MC simulated<br />
ones.<br />
Fig.6 The scattered PHS and its<br />
comparison with MCNP simulated<br />
one <strong>for</strong> normal MS plate<br />
Fig.7 The scattered PHS and its<br />
comparison with MCNP simulated<br />
one <strong>for</strong> corroded MS plate<br />
Table1. Density of MS corroded plate (kg/ m3) reconstructed from the<br />
experimental and MCNP simulated gamma scattered intensities and the average<br />
density value obtained by weight and volume measurements<br />
A methodology to reconstruct<br />
the densities of the corroded<br />
regions of the MS plate directly<br />
from the scattered intensities is<br />
developed and implemented. In<br />
this method the density, ρ of the<br />
specimen need not be known<br />
and only the knowledge of the<br />
target material's mass<br />
attenuation coefficients, µ/ ρ<br />
and µ'/ ρ is sufficient to correct<br />
<strong>for</strong> absorption of incident and<br />
scattered radiation. These mass<br />
attenuation coefficients are<br />
independent of the physical<br />
state of the matter (independent<br />
of density) and the knowledge<br />
of composition of the material<br />
is sufficient <strong>for</strong> reconstruction.<br />
The experimental and MCNP<br />
reconstructed densities from a<br />
typical voxel of the corroded<br />
MS plate are given in Table 1<br />
along with the average density<br />
value obtained by weighing the<br />
MS plate in a weighing balance<br />
and estimating its volume by<br />
fluid displacement method.<br />
From the Table 1 it can be seen<br />
that a good agreement is seen<br />
between the experimental<br />
values, MCNP calculations and<br />
average density value within<br />
estimated errors.<br />
The measured gamma<br />
scattered photo peak intensity<br />
from corroded MS plate<br />
decreases up to 6.46%<br />
compared to a normal MS plate<br />
and this corresponds to an<br />
average density loss of 0.416 x<br />
10 3 kg/ m 3 (5.24%) due to<br />
corrosion in a MS plate of size<br />
235 x 155 x 10 mm. This<br />
amount of metal loss due to<br />
corrosion has been detected<br />
and quantified in the present<br />
study. The experimental and<br />
MC results show that the<br />
scattering method is highly<br />
sensitive to changes in<br />
electronic and physical<br />
densities of the voxel under<br />
study and the magnitude of<br />
corrosion can be clearly<br />
identified and quantified by<br />
monitoring single scattered<br />
events.<br />
96 FUEL CYCLE
IGC<br />
<strong>Annual</strong> <strong>Report</strong> 2007<br />
IV.B. Reprocessing and Waste Management<br />
IV.B.1. Reprocessing of Spent FBTR fuel in CORAL<br />
The reprocessing of all the<br />
pins from FBTR with the burnup<br />
upto 100 GWd/t have been<br />
reprocessed successfully in<br />
CORAL which has provided<br />
immense opportunity <strong>for</strong><br />
studying various solvent<br />
extraction flowsheet conditions<br />
on the per<strong>for</strong>mance. The<br />
per<strong>for</strong>mance of the solvent<br />
extraction process with high<br />
plutonium feed concentration<br />
was studied. With an aqueous<br />
plutonium feed as high as 30<br />
gms per liter(gpl), the organic<br />
could be loaded to as high as<br />
25 gpl. The strip product from<br />
the first cycle with a Pu<br />
concentration of as high as 20<br />
gpl could be obtained. As the<br />
required decontamination<br />
factor was obtained in the first<br />
cycle itself, the product was<br />
qualified <strong>for</strong> reconversion. This<br />
is a very encouraging result,<br />
considering the fact that during<br />
a codecontamination cycle, we<br />
have been able to establish the<br />
conditions <strong>for</strong> high<br />
decontamination factor as well<br />
high strip product<br />
concentration which will be fit<br />
<strong>for</strong> direct reconversion. This<br />
high Pu concentration has<br />
improved the precipitation<br />
characteristics in the Pu<br />
reconversion also. Most of the<br />
campaigns could be completed<br />
in a single extraction cycle<br />
itself, though in a very few<br />
cases, to get the required Ru<br />
decontamination, the second<br />
cycle was required.<br />
The inspection of chopper<br />
and chopper-dissolver<br />
interconnecting chute was<br />
carried out using a fibroscope<br />
during the course of the<br />
campaign. Some chopped<br />
pellets were seen to have<br />
accumulated in the chopperdissolver<br />
chute and were<br />
cleared mechanically. Dissolver<br />
was inspected with a camera<br />
using a telescopic arm. No<br />
undissolved solids or corrosion<br />
of vessel was observed in the<br />
dissolver.<br />
In the spent solvent treatment<br />
facility, various washing<br />
reagents such as ammonium<br />
carbonate and sodium<br />
carbonate were used. Pu<br />
retained in the lean organic<br />
could be quantitatively<br />
recovered. Fig.1(a) and (b)<br />
show the setup <strong>for</strong> spent solvent<br />
Fig.1(a) Solvent treatment facility: Mixer settler in operation inside the glove box<br />
Fig.1 (b) Closer view of the Mixer<br />
settler<br />
FUEL CYCLE 97
IGC<br />
<strong>Annual</strong> <strong>Report</strong> 2007<br />
treatment. The lean solvent<br />
could be reused in the plant.<br />
The operational experience is<br />
being analysed to evolve a<br />
viable flowsheet <strong>for</strong> DFRP.<br />
As the gamma back ground is<br />
very high in the CORAL facility,<br />
it was not possible to monitor<br />
Pu in the hulls by gamma<br />
assaying. A separate facility is<br />
being constructed to<br />
accomplish this measurement<br />
using HPG or Lithium Bromide<br />
detector can be used.<br />
Some of the centrifugal<br />
extractor motors required<br />
replacement. HEPA filters in the<br />
vessel off gas system and glove<br />
box off gas system were<br />
changed since the pressure<br />
drop across the filters were<br />
more than 75mm. These filters<br />
did not have any significant α<br />
contamination which is<br />
indicative of the effective first<br />
stage filtration in the respective<br />
circuits.<br />
The facility is gearing up <strong>for</strong><br />
taking the next important<br />
milestone of reprocessing 155<br />
GWd/t burnup FBTR fuel. After<br />
review of the operation of this<br />
facility during the earlier<br />
campaigns, AERB has cleared<br />
the proposal <strong>for</strong> taking up this<br />
campaign.<br />
IV.B.2. Thermodynamic Measurements on Aqueous<br />
Solutions of Uranyl Nitrate Hexahydrate at<br />
298.15 K and 0.1 MPa<br />
Uranyl nitrate hexahydrate<br />
(UNH) is an important key<br />
solute in the nuclear solvent<br />
extraction processes like<br />
PUREX, UREX and UREX+.<br />
In<strong>for</strong>mation on the<br />
thermodynamic parameters <strong>for</strong><br />
aqueous solutions of uranyl<br />
nitrate is severely limited.<br />
Recently at Reprocessing<br />
Fig.1 Experimental determination<br />
of water activity of aqueous uranyl<br />
nitrate hexahydrate solutions at<br />
298.15 K and 0.1 MPa. The present<br />
experimental and calculated data<br />
are compared with those reported<br />
in the literature.<br />
Group, thermodynamic<br />
parameters of UNH in aqueous<br />
solutions viz. activity<br />
coefficients, osmotic<br />
coefficients, excess Gibbs<br />
energy and vapour pressures<br />
were measured. Selected results<br />
of these investigations are<br />
highlighted here.<br />
ASTM Grade-1 water as per<br />
ASTM D-1193-99 with a<br />
resistivity of 18.2 M Ωcm at<br />
298.15 K and TOC
IGC<br />
<strong>Annual</strong> <strong>Report</strong> 2007<br />
in thermoelectric peltier<br />
element module <strong>for</strong><br />
maintaining temperature of<br />
sample. Samples were loaded<br />
in polystyrene cups and placed<br />
into the activity meter. The<br />
activity meter was standardized<br />
using a two-step procedure. In<br />
the first step, purified and<br />
degassed ASTM-Grade-1 water<br />
was used as a standard in<br />
addition to the four aqueous<br />
electrolyte solutions supplied in<br />
sealed ampules as standards.<br />
These solutions were 0.5 m KCl<br />
(a W =0.984±0.003), 6.0 m<br />
NaCl (a W = 0.760±0.003),<br />
8.57 m LiCl (a W =0.500±<br />
0.003) and 13.3 m LiCl (a W<br />
=0.250±0.003). In the second<br />
step, 19 aqueous solutions of<br />
AR grade urea (1 x 10 -4 to 13 m<br />
approx.) were made and their<br />
water activities were<br />
determined experimentally.<br />
Experimentally determined<br />
water activity values <strong>for</strong> ureawater<br />
system were compared<br />
with two sets of literature data<br />
and an excellent agreement<br />
was observed. 14 solutions of<br />
uranyl nitrate were made<br />
(~5x10 -4 to 5 m). The water<br />
activity values <strong>for</strong> the uranyl<br />
nitrate solutions were<br />
determined and plotted in Fig.1<br />
along with the values reported<br />
in the literature<br />
The osmotic coefficient was<br />
derived from water-activity<br />
values and based on that<br />
activity coefficient of uranyl<br />
nitrate in aqueous solution was<br />
estimated. From water activity<br />
values, vapour pressure of<br />
aqueous solutions of uranyl<br />
nitrate was also estimated and<br />
is shown in Fig.2 along with the<br />
literature data. Both match<br />
well. Based on similar<br />
methodology, activity<br />
coefficients of various other key<br />
and non-key solutes of interest<br />
to reprocessing are being<br />
evaluated. Incorporation of<br />
these activity coefficients in the<br />
mathematical models <strong>for</strong><br />
nuclear solvent extractions<br />
would reduce the margin of<br />
error in the predictions from the<br />
computer simulations.<br />
Fig.2 Variation of vapour pressure of<br />
aqueous solution of uranyl nitrate<br />
hexahydrate with concentration at<br />
298.15 K and 0.l MPa. The present<br />
experimental and calculated<br />
data are compared with those<br />
reported in the literature.<br />
IV.B.3 Study of TBP-Nitric Acid Runaway Reaction<br />
and Synthesis of Red-Oil<br />
TBP nitric acid runaway<br />
reaction was studied in a high<br />
temperature-high pressure<br />
autoclave (shown in Fig.1) and<br />
red-oil was synthesized. It was<br />
established that presence of<br />
metallic nitrates was not<br />
essential <strong>for</strong> red-oil <strong>for</strong>mation<br />
as thought earlier. Various<br />
single-phase as well as twophase<br />
experiments have been<br />
completed.<br />
From Fig.2 it is observed that<br />
temperature profile had a<br />
threshold of about 403K. This<br />
Autoclave<br />
Fig.1 A view of the experimental<br />
setup <strong>for</strong> study of runaway chemical<br />
reactions of interest to reprocessing<br />
threshold temperature is<br />
initiation temperature. From<br />
Fig.3, it can be seen that the<br />
amount of pressure generated<br />
per mL of TBP exceeds even<br />
500 psi /mL of TBP. It<br />
underlines the absolute<br />
necessity of removal of<br />
entrained as well as dissolved<br />
organics from the aqueous salt<br />
solutions be<strong>for</strong>e they are<br />
concentrated by means of<br />
FUEL CYCLE 99
IGC<br />
<strong>Annual</strong> <strong>Report</strong> 2007<br />
Fig.2 Comparison of single-phase experiments <strong>for</strong> temporal<br />
temperature profiles.<br />
Fig.3 Comparison of single-phase experiments <strong>for</strong> temporal pressure<br />
profiles on the basis of psi/mL of TBP fed<br />
evaporation. Even very low<br />
quantities of organic would be<br />
enough <strong>for</strong> an explosion in the<br />
case of a red-oil event as the<br />
energy involved is very high.<br />
The main results from the redoil<br />
related work done at<br />
Reprocessing Group are as<br />
follows-<br />
1. TBP-Nitric acid runaway<br />
reaction starts only at the<br />
temperatures at or greater than<br />
403.15 K. This was found valid<br />
<strong>for</strong> all the runs either single or<br />
two phase system. For control<br />
of this situation, operating<br />
temperature has to be kept<br />
below 393K.<br />
2. Once the runaway<br />
reaction starts, the heating rate<br />
increases due to auto catalytic<br />
reactions involved and pressure<br />
starts to shoot up. This feature<br />
can be used to detect onset of<br />
runaway reactions and <strong>for</strong><br />
setting of process interlocks to<br />
prevent energetic reaction to<br />
happen. As the rate of<br />
pressure-rise approaches a<br />
pre-decided limit, related logic<br />
can provide opening up of<br />
larger and safe vent area as<br />
well as additional cooling to<br />
quench the reaction by bringing<br />
temperature below 393-383K.<br />
3. The pressure generated<br />
per g or per mL of the Feed TBP<br />
is a function of several<br />
variables like acidity of the<br />
equilibration, amount of acid<br />
present in the system during<br />
reaction and the temperatures<br />
prevailing during reactions.<br />
4. The most important<br />
finding is that <strong>for</strong> prevention of<br />
red-oil <strong>for</strong>mation, 10 M limit as<br />
earlier proposed in the<br />
literature is strictly not valid as<br />
found from the recent<br />
experiments carried at RR&DD.<br />
Red-oil event was observed in<br />
the experiments with nitric acid<br />
of as low as 2 M<br />
concentrations. Thus the<br />
prevalent safety guidelines <strong>for</strong><br />
limiting concentrations need a<br />
relook. Pressure generated is<br />
quite high even in the<br />
experiments with lower acidity.<br />
Thus possibility of runaway<br />
reaction at the lower acidity<br />
needs to be investigated.<br />
Further studies are in progress<br />
to identify the safe operating<br />
regimes during evaporation.<br />
100 FUEL CYCLE
IGC<br />
<strong>Annual</strong> <strong>Report</strong> 2007<br />
IV.B.4. Recovery of Valuables from Waste Using<br />
Room Temperature Ionic Liquids<br />
Room temperature ionic liquids<br />
(RTIL) have recently gained<br />
recognition in the area of<br />
nuclear fuel cycle. They are<br />
compounds comprised entirely<br />
of ions and are molten at<br />
temperatures lower than 373 K.<br />
Substitution of unsymmetrical<br />
organic cations, <strong>for</strong> e.g. 1<br />
butyl-3-methylimidazolium<br />
cation (bmim) in place of<br />
sodium ion in sodium chloride<br />
(MP 1074 K) results in the<br />
<strong>for</strong>mation of room temperature<br />
ionic liquid, bmimCl having<br />
melting point of 340 K. As<br />
these compounds possess<br />
several amazing physical and<br />
chemical properties congenial<br />
<strong>for</strong> nuclear reprocessing and<br />
waste treatment, they have<br />
acquired popularity <strong>for</strong> their<br />
role as solvent/medium <strong>for</strong> a<br />
wide variety of applications.<br />
These studies examine the<br />
feasibility and merits of<br />
Fig.1a SEM image of rhodium depos<br />
it obtained by the electrolysis of 20<br />
mM rhodium chloride in bmimCl<br />
<strong>for</strong> 2 hours on SS plate (3 cm x 4 cm)<br />
at -1.7 V (vs. Pd quasi-reference)<br />
at 373 K.<br />
employing RTILs in liquid-liquid<br />
solvent extraction process and<br />
as electrolytic medium <strong>for</strong> nonaqueous<br />
reprocessing.<br />
Furthermore, RTILS are<br />
excellent candidates <strong>for</strong><br />
solubilizing cellulose, starch<br />
and wood. Tissue paper is one<br />
of the cellulose based materials<br />
generated in significant<br />
volumes at nuclear fuel cycle<br />
facilities. There<strong>for</strong>e, studies<br />
using RTILs are focused on the<br />
recovery of valuable fission<br />
platinoids present in the spent<br />
nuclear fuel and the<br />
development of methods <strong>for</strong> the<br />
treatment of tissue paper waste<br />
followed by the recovery of<br />
valuables present in the tissue<br />
matrix.<br />
Significant quantities of PGMs<br />
(Palladium, rhodium and<br />
ruthenium) are present in the<br />
high burn-up fuel discharged<br />
from fast reactors. We have<br />
attempted an electrochemical<br />
method <strong>for</strong> the recovery of<br />
PGMs using RTIL as electrolytic<br />
medium. The study revealed<br />
that PGMs in bmimCl are<br />
speciated as chlorocomplexes,<br />
<strong>for</strong> e.g. rhodium (III) in bmimCl<br />
is present as [RhCl 6 ] 3- and other<br />
chlorocomplexes. Palladium<br />
and rhodium chlorocomplexes<br />
are reduced to their metallic<br />
<strong>for</strong>m by an irreversible single<br />
step two or three electron<br />
transfer, respectively, at the<br />
glassy carbon electrode. The<br />
mass transfer of rhodium (III)<br />
was slower compared to<br />
palladium (II) under similar<br />
conditions. Electrowinning of<br />
rhodium from bmimCl medium<br />
results in the deposition of<br />
metallic rhodium (see Fig.1a).<br />
Electrodeposition of fission<br />
palladium from co-existing<br />
fission rhodium resulted in a<br />
separation factor of 10 (Pd/Rh),<br />
when the deposition was<br />
conducted at palladium<br />
deposition potential. The<br />
separation factor decreased<br />
with increase of applied<br />
negative potential (towards<br />
rhodium deposition potential).<br />
The study indicated that codeposition<br />
of fission rhodium<br />
(~10%) is inevitable during<br />
electroseparation of fission<br />
palladium from a solution of<br />
rhodium(III) and palladium (II)<br />
present in bmimCl, due to<br />
proximity of palladium and<br />
rhodium reduction onset<br />
potentials.<br />
Significant volumes of tissue<br />
paper waste containing special<br />
nuclear materials are generated<br />
FUEL CYCLE 101
IGC<br />
<strong>Annual</strong> <strong>Report</strong> 2007<br />
during nuclear fuel cycle<br />
operations. A new method has<br />
been developed <strong>for</strong> treating<br />
these tissue paper wastes using<br />
RTIL and electrochemical<br />
recovery of the valuables<br />
present in it. The procedure<br />
involves the dissolution of<br />
tissue paper waste in 1 butyl 3-<br />
methylimidazolium chloride.<br />
The study indicated that<br />
dissolution of 5 - 7 wt. % tissue<br />
paper in bmimCl was complete<br />
within 60 minutes at 373 K.<br />
The time required <strong>for</strong><br />
dissolution increased with<br />
increase of loading. The<br />
limiting solubility of tissue<br />
paper was 15 -17 wt.% at 373<br />
K. Contaminants such as<br />
uranium (VI) and Pd (II) present<br />
as chloride/nitrate salts also<br />
dissolve in bmimCl along with<br />
tissue paper. However they can<br />
be recovered by<br />
electrodeposition. Electrolysis<br />
of a solution of uranium (VI)<br />
and palladium(II) loaded tissue<br />
paper in bmimCl resulted in<br />
deposition of uranium oxide<br />
(UO 2 ) and metallic palladium<br />
(see Fig.1b), respectively, which<br />
were characterized by X-ray<br />
diffraction and scanning<br />
electron microscopy. The study<br />
established the possibility of<br />
dissolving tissue paper and<br />
other cellulose based materials<br />
containing soluble uranium (VI)<br />
and Pd(II) compounds in<br />
bmimCl, and their recovery<br />
from the resultant solution.<br />
Cellulose pulp was regenerated<br />
by adding surplus water after<br />
the recovery of valuables and<br />
the ionic liquid, bmimCl, was<br />
also regenerated <strong>for</strong> further use<br />
by vacuum distillation of water.<br />
These experiments confirmed<br />
the attractive possibility of<br />
developing processes <strong>for</strong><br />
recovering valuable elements<br />
from tissue paper waste without<br />
generating significant<br />
quantities of secondary waste<br />
Fig.1b SEM image of palladium<br />
deposit obtained by electrolysis of<br />
palladium chloride (100 mM) in 5<br />
wt.% tissue paper-bmimCl-DMSO<br />
solution <strong>for</strong> 2 hours on SS plate at -<br />
1.0 V (vs. Pd quasi reference)<br />
at 298 K.<br />
IV.B.5. Development of a Novel Mixer-Settler with Rotated<br />
Helical Coils as Mixer <strong>for</strong> Nuclear Solvent Extraction<br />
For current designs of<br />
radiochemical plants, solvent<br />
extraction (SX) contactors with<br />
no periodic maintenance are<br />
the first choice. In addition, as<br />
costs of specialty solvents <strong>for</strong><br />
nuclear extraction are quite<br />
high, there is a demand of SX<br />
operation at extreme flow ratios<br />
of the two phases (aqueous and<br />
organic). Recently a novel<br />
mixer-settler was visualized and<br />
Fig.1 A view of the experimental setup<br />
Helical mixer<br />
102 FUEL CYCLE
IGC<br />
<strong>Annual</strong> <strong>Report</strong> 2007<br />
developed <strong>for</strong> this kind of<br />
service. The mixer of the novel<br />
SX contactor is based on<br />
rotated helical tubes and does<br />
not involve any mechanical<br />
moving part. This mixer-settler<br />
was realized in a glass version<br />
at present and tested <strong>for</strong><br />
hydrodynamics in non-mass<br />
transfer region as well as mass<br />
transfer region. A view of the<br />
experimental setup is<br />
shown in Fig.1. Non-mass<br />
transfer runs were carried out<br />
with pre-equilibrated 30%<br />
TBP/kerosene/0.01N<br />
acid /water biphasic system.<br />
Drop population sizes were<br />
measured with a laser drop-size<br />
analyzer (Fig.2). Mass transfer<br />
runs were carried out with<br />
Percentage dV/dD<br />
15<br />
12<br />
9<br />
6<br />
3<br />
0<br />
10 100 1000 10000<br />
Size in Microns<br />
Median: 107.45µm Mean(vm):135.24µm<br />
Mode: 116.18µm S.D.(vm):102.46µm<br />
Concent.:3.1E-003cc/ml Conf(vm): 88.25%<br />
Fig.2 Experimental determination of drop population sizes using laser based<br />
drop-size analyzer. Result of water -30% TBP/NPH<br />
System at O/A = 6 and 1% SDS concentration.<br />
aqueous nitric acid feed of 4N<br />
concentration <strong>for</strong> extraction<br />
runs at different aqueous /<br />
organic ratios ranging from<br />
0.04 to 200. In addition, with<br />
the loaded organic product<br />
from the extraction, backextraction<br />
runs were also<br />
carried. Nearly 100% mass<br />
transfer efficiency was observed<br />
in all the cases. There<strong>for</strong>e<br />
prototype was validated and<br />
design of a multi stage unit is in<br />
the progress.<br />
IV.B.6. Current Status of Demonstration Fast Reactor<br />
Fuel Reprocessing Plant<br />
With the successful completion<br />
of the several campaigns of<br />
spent FBTR fuel reprocessing in<br />
CORAL, many modifications<br />
have been incorporated in the<br />
process flowsheet of<br />
Demonstration fast reactor fuel<br />
reprocessing plant (DFRP). Also<br />
the design of critical equipment<br />
such as chopper, dissolver and<br />
centrifugal extractors have<br />
been updated. These<br />
equipment are in advanced<br />
stage of fabrication at vendors'<br />
works. A view of the chopper-<br />
Fig.1 Perspective view of the FBTR chopper-dissolver cell in<br />
DFRP with partial piping<br />
FUEL CYCLE 103
IGC<br />
<strong>Annual</strong> <strong>Report</strong> 2007<br />
dissolver cell is given in Fig.1.<br />
The piping engineering of all<br />
the cells have been completed<br />
except the dissolver cell. 3D<br />
drawings of these have helped<br />
in visualizing effectively the<br />
erection and maintenance<br />
problems. Most of the<br />
packages <strong>for</strong> piping have been<br />
tendered out. The erection of<br />
equipment and piping will be<br />
completed and the plant will be<br />
ready <strong>for</strong> commissioning by<br />
2009.<br />
The construction of the head<br />
end facility, in which FBTR and<br />
PFBR spent fuel will be<br />
dismantled, is in progress. The<br />
detailed design of this facility<br />
has been completed by the<br />
consultants. This facility will be<br />
integrated with the rest of the<br />
plant by 2010.<br />
IV.C. Materials <strong>for</strong> Fuel Cycle<br />
IV.C.1. Athermal Decomposition Modes of Phase in a Ti-5%Ta-1.8%Nb Alloy<br />
Titanium alloys are chosen <strong>for</strong><br />
a variety of industrial<br />
applications due to their high<br />
strength/weight ratio and<br />
excellent corrosion resistance,<br />
which can be achieved by<br />
tailoring the microstructure.<br />
The origin of a myriad of<br />
microstructures is due to a<br />
variety of phase<br />
trans<strong>for</strong>mations of the high<br />
temperature BCC β phase,<br />
which is unstable at room<br />
temperature. However, the<br />
stability of β phase at room<br />
temperature can be influenced<br />
by addition of β stabilizing<br />
elements and cooling rate.<br />
Lean β as well as solute rich<br />
alloys undergo a diffusionless<br />
martensitic trans<strong>for</strong>mation. In<br />
the <strong>for</strong>mer alloys, β quenching<br />
results in a hexagonal<br />
martensite while in the latter an<br />
orthorhombic martensite <strong>for</strong>ms.<br />
Another class of trans<strong>for</strong>mation<br />
namely the displacive omega<br />
trans<strong>for</strong>mation is also reported<br />
to occur in group IV metals Ti,<br />
Zr, Hf etc. The presence of<br />
both martensite and omega<br />
phase in a Ti-5Ta-1.8Nb alloy<br />
subjected to isothermal<br />
treatments in different phase<br />
fields has been investigated.<br />
Transmission Electron<br />
Microscopy studies established<br />
that the α+β Ti-5Ta-1.8Nb<br />
(a)<br />
(b)<br />
β<br />
α<br />
0.5 µm<br />
0.05 µm<br />
Fig.1 (a) Trans<strong>for</strong>med β microstructure on isothermal treatment in α + β phase field below Ms temperature; inset<br />
is the diffraction pattern showing the presence of α,β and ω phases (b) Darkfield micrograph showing<br />
fine ellipsoidal particles of ω phase in retained β<br />
104 FUEL CYCLE
IGC<br />
<strong>Annual</strong> <strong>Report</strong> 2007<br />
alloy undergoes a martensitic<br />
trans<strong>for</strong>mation when quenched<br />
from the α phase field (1143K)<br />
<strong>for</strong>ming a hexagonal<br />
martensite. However, β phase if<br />
sufficiently enriched with<br />
stabilizers results a trans<strong>for</strong>med<br />
β microstructure (Fig. 1(a)) on<br />
water quenching, when<br />
isothermally treated in the α+β<br />
phase field at 973K, which is<br />
below martensite start (Ms)<br />
temperature. Analysis of SAD<br />
patterns (inset of Fig. 1(a)) from<br />
retained β showed the presence<br />
of phase. The orientation<br />
relationship between α and β,<br />
ω and β phases were found to<br />
be obeyed, as reported <strong>for</strong> Ti<br />
and its alloys. Dark-field<br />
microscopy of ω reflections,<br />
showed a dense distribution of<br />
fine, ellipsoidal particles of<br />
sizes ranging from 4 to 10 nm<br />
(Fig. 1(b)). The ellipsoidal<br />
morphology of the particles is<br />
attributed to the low misfit<br />
between α and β phases, since<br />
it can be ellipsoidal or cuboidal<br />
depending on the degree of<br />
misfit. The lower misfit in this<br />
alloy is attributed to the similar<br />
atomic size of Ti, Ta and Nb.<br />
The hardness of the β annealed<br />
alloy, the structure prior to the<br />
isothermal treatment showed no<br />
significant increase after<br />
isothermal treatments, which is<br />
also attributed to the poor solid<br />
solution strengthening effect of<br />
Ta and Nb. It was also observed<br />
that aging this alloy under<br />
similar conditions showed no<br />
evidence <strong>for</strong> decomposition of<br />
β phase. These observations<br />
there<strong>for</strong>e confirm that athermal<br />
phase <strong>for</strong>ms in this alloy.<br />
IV.C.2. Effect of De<strong>for</strong>mation Mode on Texture<br />
Development in Ti-5Ta-2Nb Alloy<br />
Ti-5Ta-2Nb alloy has been<br />
developed as a structural<br />
material <strong>for</strong> fuel reprocessing<br />
applications due to its excellent<br />
oxidation and corrosion<br />
resistance. The alloy undergoes<br />
a variety of phase<br />
trans<strong>for</strong>mations depending on<br />
the temperature and cooling<br />
rate. The products show distinct<br />
microstructural features and<br />
texture. Further, the texture is<br />
influenced by the prior<br />
de<strong>for</strong>mation.<br />
This alloy has α (hcp) phase<br />
as the predominant phase at<br />
room temperature, while β<br />
(bcc) phase gets stabilized at<br />
higher temperatures. The alloy<br />
Fig.1 XRD of wire and sheet sample be<strong>for</strong>e and after heat treatment,<br />
compared with powder sample. Surface of sheet and wire cross-section<br />
have been studied.<br />
FUEL CYCLE 105
IGC<br />
<strong>Annual</strong> <strong>Report</strong> 2007<br />
Fig.2 Crystal orientation map of<br />
phase <strong>for</strong> heat treated wire<br />
sample. Inverse pole figure<br />
contour shows primary<br />
concentration near to (1 1 -2 2)<br />
was de<strong>for</strong>med by two modes<br />
(namely wire drawing and cold<br />
rolling), followed by β solution<br />
annealing at 1273 K/1 hour<br />
and slow cooling to<br />
room temperature, resulting<br />
in α+β→β→α+β phase<br />
trans<strong>for</strong>mations. The evolution<br />
of crystallographic texture in<br />
the trans<strong>for</strong>med product has<br />
been characterized using X-ray<br />
Diffraction (XRD) and SEM-<br />
EBSD (Scanning Electron<br />
Microscopy-Electron Back<br />
Scattered Diffraction)<br />
techniques. Fig. 1 shows the<br />
XRD intensity of the various (h k<br />
i l) α crystallographic planes, <strong>for</strong><br />
the wire/sheet samples be<strong>for</strong>e<br />
and after heat treatment,<br />
compared with the powder<br />
sample. An increased relative<br />
intensity of certain plane<br />
suggests preferential<br />
crystallographic alignment or<br />
'texture'. Be<strong>for</strong>e heat treatment,<br />
a 'de<strong>for</strong>mation texture' of [1 0 -<br />
1 0] α //AD (Axial direction) <strong>for</strong><br />
the wire sample, and a (0 0 0<br />
2) α /ND (Normal direction)<br />
texture <strong>for</strong> the sheet sample was<br />
observed. Heat treatment<br />
resulted in a different and more<br />
pronounced 'trans<strong>for</strong>mation<br />
texture' of [1 1 -2 2] α //AD <strong>for</strong><br />
the wire, and (1 1 -2 0) α //ND<br />
<strong>for</strong> the sheet sample. SEM-<br />
EBSD analysis was used to<br />
study microscopic detail of<br />
texture. Fig. 2 and 3 show the<br />
'Crystal Orientation Map' <strong>for</strong><br />
the heat treated wire, sheet<br />
samples respectively, depicting<br />
the type of crystallographic<br />
planes (color indexed) which<br />
are aligned with the sample<br />
surface. The EBSD result is in<br />
concordance with XRD. The<br />
comparison of crystallographic<br />
orientation of α lamellae and its<br />
neighboring β lamellae showed<br />
'Burgers Orientation Relation'<br />
(BOR) to be obeyed. Thus, the<br />
alloy is seen to acquire a<br />
'de<strong>for</strong>mation texture' dictated by<br />
Fig.3 Crystal orientation map<br />
of α and β lamellas <strong>for</strong> heat<br />
treated sheet sample.-grains<br />
are oriented with (1 1 -2 0)<br />
alignment.<br />
the de<strong>for</strong>mation mode. Heat<br />
treatment leads to high<br />
temperature β-texture and a<br />
distinct 'trans<strong>for</strong>mation texture'<br />
of α, as dictated by the<br />
orientation relationship during<br />
β to α trans<strong>for</strong>mation.<br />
106 FUEL CYCLE
IGC<br />
<strong>Annual</strong> <strong>Report</strong> 2007<br />
IV.C.3. Application of Zircaloy-4 <strong>for</strong> Highly Corrosive<br />
Nitric Acid Environments in Reprocessing Plants<br />
Reprocessing of spent nuclear<br />
fuel used in FBRs involves use<br />
of nitric acid of high<br />
concentrations<br />
and<br />
temperatures <strong>for</strong> dissolvers and<br />
evaporators which are highly<br />
corrosive. The materials chosen<br />
<strong>for</strong> the fabrication of such<br />
reprocessing plant equipment<br />
should possess excellent<br />
corrosion resistance, ease of<br />
fabricability and reliability.<br />
Conventional austenitic<br />
stainless steels are not<br />
preferable in such highly<br />
oxidizing conditions as they<br />
undergo severe intergranular<br />
corrosion. Studies carried out<br />
earlier indicated good<br />
corrosion resistance of<br />
Commercially Pure Titanium<br />
(CP-Ti) and Ti-5%Ta as<br />
compared to AISI type 304L SS<br />
in highly oxidizing nitric acid.<br />
Thus, titanium was chosen <strong>for</strong><br />
fabricating electrolytic dissolver<br />
of CORAL plant, with a<br />
dissimilar joint by explosive<br />
joining process <strong>for</strong> linking to<br />
type 304L SS equipment in the<br />
plant, <strong>for</strong> reprocessing of spent<br />
fuel from FBTR. For future<br />
reprocessing plants, based on<br />
research and international<br />
experience, developmental<br />
ef<strong>for</strong>ts have been made <strong>for</strong> the<br />
fabrication of dissolvers by<br />
using Ti-5%Ta-1.8%Nb alloy.<br />
The excellent corrosion<br />
resistance of zirconium in nitric<br />
acid has been known <strong>for</strong> over<br />
50 years. Zirconium is highly<br />
resistant to nitric acid<br />
environments and is considered<br />
as candidate material <strong>for</strong><br />
various applications in spent<br />
nuclear fuel reprocessing plants<br />
involving highly concentrated<br />
nitric acid medium. Zirconium<br />
and its alloys are thus<br />
considered as candidate<br />
materials <strong>for</strong> various<br />
applications in spent nuclear<br />
fuel reprocessing plants<br />
involving nitric acid of high<br />
concentrations at high<br />
temperatures. Also, unlike<br />
titanium and its alloys,<br />
zirconium is unaffected by<br />
vapour and condensate of<br />
boiling nitric acid.<br />
An attempt was made to study<br />
the corrosion behaviour of<br />
Zircaloy-4 (Zr-with Sn-1.4%,<br />
Fig.1 (a) Corrosion rate of materials in three phase corrosion test, (b) Potentiodynamic polarisation curves of<br />
wrought and welded samples, in 11.5M HNO 3 medium.<br />
FUEL CYCLE 107
IGC<br />
<strong>Annual</strong> <strong>Report</strong> 2007<br />
Fe-0.22%, Cr-0.1%) in wrought<br />
and welded <strong>for</strong>ms in<br />
comparison with other<br />
candidate materials like CP Ti,<br />
Ti-5%Ta and Ti-5%Ta-1.8%Nb.<br />
Manual TIG welding and<br />
electron beam welding were<br />
carried out with Zircaloy-4, and<br />
radiography was made <strong>for</strong><br />
choosing defect free regions <strong>for</strong><br />
making samples <strong>for</strong> corrosion<br />
investigations. Three phase<br />
corrosion testing in liquid,<br />
vapour and condensate regions<br />
was conducted in boiling<br />
11.5M nitric acid using a<br />
specially<br />
designed<br />
experimental set up. The<br />
corrosion rates were evolved<br />
based on the weight change<br />
after the test <strong>for</strong> 240 h, and the<br />
tested base samples in liquid<br />
and condensate phases were<br />
analysed <strong>for</strong> the nature of<br />
surface films by using X-ray<br />
photoelectron spectroscopy<br />
(XPS), while that exposed to<br />
liquid phase was analysed by<br />
using secondary ion mass<br />
spectroscopy (SIMS).<br />
Potentiodynamic polarization<br />
technique was used to study the<br />
polarization behaviour in both<br />
base and welded conditions in<br />
11.5M HNO 3 solution at room<br />
temperature.<br />
The average corrosion rate<br />
<strong>for</strong> five individual periods in<br />
liquid, vapour and condensate<br />
phases of boiling 11.5M nitric<br />
acid <strong>for</strong> CP-Ti, Ti-5%Ta, Ti-<br />
5%Ta-1.8%Nb, Zircaloy-4,<br />
Zircaloy-4 TIG weld and EB<br />
weld samples are shown in<br />
Fig.1 (a). As the corrosion rates<br />
are in close ranges the values<br />
are also provided in Table<br />
inserted in the figure. The<br />
corrosion rates clearly<br />
indicated superior corrosion<br />
resistance of zircaloy-4 in both<br />
wrought and welded conditions<br />
as 'near-zero corrosion<br />
material' in comparison to CP-<br />
Ti, Ti-5%Ta, and, Ti-5%Ta-<br />
1.8%Nb. The electron beam<br />
welded samples did not show<br />
any deterioration and<br />
per<strong>for</strong>med similar to wrought<br />
alloy. The high corrosion<br />
resistance of zirconium and its<br />
alloys in highly oxidizing nitric<br />
acid conditions is due to a<br />
stable and adherent ZrO 2 film<br />
<strong>for</strong>med on their surface. XPS<br />
and SIMS spectra indicated the<br />
<strong>for</strong>mation of ZrO 2 protective<br />
film on the surface after testing.<br />
The binding energy of Zr3d 5/2<br />
from high resolution spectra<br />
indicated the presence of Zr in<br />
+4 valency state in condensate<br />
phase. SEM examination<br />
revealed insignificant corrosion<br />
attack of Zircaloy-4 and its<br />
welds in all three phases in<br />
comparison to CP-Ti, Ti-5%Ta,<br />
and Ti-5%Ta-1.8%Nb after<br />
testing in liquid, vapour and<br />
condensate phases. However,<br />
accelerated corrosion attack<br />
was noticed <strong>for</strong> titanium after<br />
testing in condensate phase.<br />
Fig.2 Zircaloy-4 corrosion testing<br />
system <strong>for</strong> three phase<br />
corrosion evaluation in 11.5M HNO 3 .<br />
The polarization curves <strong>for</strong><br />
Zircaloy-4 and its welds<br />
exhibited a wide region of<br />
stable passivation up to 1.5 V<br />
(SCE) beyond which distinct<br />
breakdown of passivity was<br />
noticed. The welded samples<br />
showed similar or better<br />
corrosion behaviour (Fig.1 (b))<br />
compared to wrought alloy in<br />
11.5 HNO 3 M solution.<br />
The results of microstructure,<br />
microhardness, corrosion rate,<br />
morphology of attack and<br />
nature of surface film <strong>for</strong>med<br />
clearly established that<br />
zircaloy-4 is a candidate<br />
material <strong>for</strong> application in<br />
highly corrosion concentrated<br />
nitric acid at high temperatures<br />
in reprocessing plants. Based<br />
on the results of the<br />
investigation a zircaloy-4<br />
testing system (Fig.2) with an<br />
option to conduct long term<br />
corrosion study in liquid,<br />
vapour and condensate region<br />
was fabricated, commissioned,<br />
and evaluated <strong>for</strong> corrosion<br />
behaviour.<br />
108 FUEL CYCLE
IGC<br />
<strong>Annual</strong> <strong>Report</strong> 2007<br />
IV.C.4. Glass-ceramic Waste Form <strong>for</strong> the High-level Waste<br />
from Pyrometallurgical Reprocessing of Nuclear Fuels<br />
The high-level radioactive<br />
waste (HLW) generated from<br />
pyrometallurgical reprocessing<br />
of irradiated nuclear fuels in<br />
molten LiCl-KCl media cannot<br />
be immobilized in the<br />
conventional borosilicate glass,<br />
as chlorides have very poor<br />
solubility in glass.<br />
Immobilization of the chloride<br />
waste in a glass-ceramic such<br />
as glass-bonded sodalite, has<br />
emerged as a promising option.<br />
Sodalite is a naturally occurring<br />
mineral, and the glass-ceramic<br />
waste <strong>for</strong>m based on it is<br />
considered suitable <strong>for</strong> disposal<br />
in geological repositories. The<br />
waste <strong>for</strong>m fabrication involves<br />
the occlusion and/or ion<br />
exchange of the radioactive<br />
waste on to a zeolite, tailoring<br />
with a glass binder, and<br />
subsequent conversion to the<br />
glass-ceramic. The preparation<br />
and characterization of such a<br />
waste <strong>for</strong>m using a simulated<br />
waste composition have been<br />
investigated.<br />
Dehydrated Zeolite 4A was<br />
homogenized with simulated<br />
chloride HLW of a<br />
representative reference<br />
composition (2 wt% CsCl, 2<br />
wt% BaCl 2 , 9 wt% NdCl 3 and<br />
the rest LiCl - KCl eutectic) in<br />
an inert atmosphere glove box,<br />
and the mixture was<br />
equilibrated at 848 K <strong>for</strong> 100h<br />
in static argon. The salt-loaded<br />
zeolite (SLZ) was washed with<br />
water, and the eluate analyzed<br />
by atomic absorption<br />
spectrometry in order to<br />
ascertain the extent of salt<br />
uptake in the zeolite matrix. The<br />
SLZ was then converted to<br />
glass-bonded sodalite<br />
[Na 8 (AlSiO 4 )6Cl 2 ] by blending<br />
it with 25wt % of a specially<br />
prepared boroaluminosilicate<br />
glass, pelletizing and heating at<br />
1188 K <strong>for</strong> 15h in flowing<br />
argon. By this procedure,<br />
several batches were prepared<br />
by varying experimental<br />
S<br />
N<br />
N<br />
S<br />
N<br />
N<br />
S<br />
N<br />
parameters such as the zeoliteto-salt<br />
ratio. X-ray<br />
diffractograms of the final<br />
waste <strong>for</strong>m showed sodalite as<br />
the major phase and nepheline<br />
as a minor phase (Fig.1). SEM<br />
micrograph of the product<br />
showed a uni<strong>for</strong>m<br />
microstructure (Fig. 2).<br />
Thermophysical properties<br />
like thermal expansion and<br />
glass transition temperature of<br />
the glass-ceramic were studied<br />
by high-temperature XRD and<br />
differential<br />
scanning<br />
calorimetry, respectively. The<br />
variation of the lattice<br />
parameter with temperature<br />
was found to be similar to that<br />
S<br />
2Theta Cu K α<br />
S : Sodalite<br />
N : Nepheline<br />
Fig.1 Powder XRD pattern of the glass-bonded sodalite<br />
N<br />
FUEL CYCLE 109
IGC<br />
<strong>Annual</strong> <strong>Report</strong> 2007<br />
of pristine sodalite, indicating<br />
that the incorporation of fission<br />
does not significantly alter its<br />
thermal expansion behaviour.<br />
products in the sodalite matrix The glass transition<br />
Fig.2 SEM micrograph of the glass-bonded sodalite<br />
temperature (T g ) of the glassbonded<br />
soadalite system (808<br />
K) was found to be significantly<br />
lower than that of the<br />
boroaluminosilicate glass (868<br />
K) used as the binder. This<br />
appears to be the indication of<br />
some interaction between the<br />
ceramic phase and the glass,<br />
the exact nature of which is to<br />
be established. With the glass<br />
composition employed in this<br />
study, the waste loading per<br />
canister has to be such that its<br />
centre line temperature stays<br />
well below the glass transition<br />
temperature of 808 K.<br />
IV.C.5. Development of NDE Technique <strong>for</strong> Detection of<br />
Sodium Voids in Metallic Fuels - a Simulation Study<br />
Non-destructive evaluation<br />
(NDE) plays a vital role <strong>for</strong><br />
ensuring stringent quality<br />
assurance of nuclear fuel<br />
cladding tubes. Eddy current<br />
(EC) NDE technique is routinely<br />
employed<br />
during<br />
manufacturing stages of<br />
cladding tubes of fast reactors<br />
as it is a versatile, high-speed<br />
and high-sensitive technique.<br />
Clad<br />
Al tube<br />
Notch<br />
simulating<br />
void<br />
Fig.1 Aluminum tube with machined<br />
notches simulating voids in sodium<br />
and the experimental set up <strong>for</strong><br />
imaging voids in sodium bonding.<br />
This technique is also used<br />
during post-irradiation<br />
examination of fuel pins in hot<br />
cells to detect and size surface<br />
and sub-surface defects in the<br />
cladding wall as well as certain<br />
anomalies in encapsulated fuel<br />
pellets. Metallic fuels are<br />
candidate fuels <strong>for</strong> fast breeder<br />
reactors <strong>for</strong> generation of<br />
nuclear power in future. The<br />
metallic fuel slugs in this type of<br />
fuels are encapsulated in<br />
cladding tubes with sodium<br />
bonding.<br />
During fabrication stages,<br />
there exists a possibility <strong>for</strong><br />
<strong>for</strong>mation of voids filled with<br />
inert gas due to improper<br />
sodium filling. Non-destructive<br />
detection of these voids or inert<br />
gas bubbles in sodium is<br />
important as their presence<br />
affect the heat transfer and<br />
thereby the fuel centre<br />
temperature and burn-up. From<br />
the design considerations, it is<br />
required that voids larger than<br />
1.4x2.1 mm 2 be detected<br />
during manufacturing stages of<br />
the fuel pins. In this direction,<br />
eddy current technique has<br />
been attempted to detect voids<br />
smaller than the specified size,<br />
using a pancake type probe,<br />
subsequent to initial studies on<br />
quartz tubes filled with sodium<br />
110 FUEL CYCLE
IGC<br />
<strong>Annual</strong> <strong>Report</strong> 2007<br />
and having a variety of inert<br />
gas voids. The pancake probe<br />
when used in conjunction with<br />
a scanner is expected to detect,<br />
image and locate voids in fuel<br />
pins and hence, detailed<br />
experimental studies have been<br />
carried out.<br />
In order to simulate the voids<br />
in sodium column, a 0.3 mm<br />
thick aluminium tube having<br />
electrical conductivity nearly<br />
equal to sodium has been<br />
chosen and a variety of holes,<br />
notches and slots identical to<br />
the expected voids have been<br />
machined. Typical simulated<br />
notch in aluminium tube<br />
inserted in a FBTR cladding<br />
tube, and the experimental set<br />
up comprising of in-house<br />
developed z-θ scanner, EC<br />
instrument and pancake probe<br />
are shown in Fig.1.<br />
Vertical Output, mV<br />
2.0<br />
1.8<br />
1.6<br />
1.4<br />
1.2<br />
1.0<br />
0.8<br />
0.6<br />
0.4<br />
0.2<br />
0.0<br />
-0.2<br />
-0.4<br />
-0.6<br />
-0.8<br />
A<br />
Void Size (long x trans)<br />
A-2x3 mm 2<br />
B-1.5x2 mm 2<br />
C-0.8x1 mm 2<br />
B<br />
Frequency: 75 kHz<br />
Gain: 25 dB<br />
-5 -4 -3 -2 -1 0 1<br />
Horizontal Output, mV<br />
C<br />
Typical EC signals from three<br />
simulated voids of 2x3mm 2 ,<br />
1.5x2 mm 2 and 0.8x1 mm 2 at<br />
75 kHz using a pancake probe<br />
are shown in Fig.2. As can be<br />
observed, the 0.8x1 mm 2<br />
notch, which is much smaller<br />
than the specified void size of<br />
1.4x2.1 mm 2 , has produced<br />
unambiguous signal even at a<br />
small gain of 25 dB.<br />
Fig.2 EC signals of simulated voids (notches in aluminium tube)<br />
at 75 kHz.<br />
Fig.3 Eddy current image of 2x3 mm 2 notch simulating void in sodium.<br />
In order to determine the<br />
circumferential location of<br />
voids, the pancake probe has<br />
been attached to the z-θ<br />
scanner and imaging of<br />
simulated notches has been<br />
carried out to develop detailed<br />
test procedure <strong>for</strong> reliable<br />
detection of voids. Typical<br />
image of 2x3 mm2 notch is<br />
shown in Fig.3. Studies reveal<br />
that it is possible to identify the<br />
location of a void from the<br />
axial and the circumferential<br />
location of the signal/image<br />
feature and also to size it<br />
reliably.<br />
FUEL CYCLE 111
IGC<br />
<strong>Annual</strong> <strong>Report</strong> 2007<br />
IV.C.6. Temperature Evolution in Spent Fuel Subassembly<br />
during Handling in Fuel Transfer Cell<br />
Spent fuel subassembly (FSA)<br />
is removed from the sodium<br />
filled transfer pot at the<br />
location of Ex-Vessel Transfer<br />
Post (EVTP) <strong>for</strong> handling in Fuel<br />
Transfer Cell (FTC) and<br />
subsequent storage in water<br />
pool storage bay. To prevent<br />
possible release of radioactivity<br />
due to failure of FSA clad, the<br />
temperature of clad should not<br />
exceed its permissible limit of<br />
923 K. To achieve this, the FSA<br />
is <strong>for</strong>ce cooled from the top of<br />
the FSA by supplying nitrogen<br />
at 323 K filled in FTC itself in<br />
re-circulation mode (Fig. 1). In<br />
the event of loss of <strong>for</strong>ced<br />
cooling, the temperatures of<br />
clad and hexcan increase, till<br />
the heat loss under natural<br />
convection and radiation<br />
equals the decay power. It is<br />
essential to determine the final<br />
steady state values of these<br />
temperatures, to assess whether<br />
natural cooling adequate. Also,<br />
knowledge of transient<br />
temperature evolution in the<br />
FSA is essential to determine<br />
the time available <strong>for</strong> the<br />
operator to take safety action.<br />
These have been evaluated by<br />
detailed<br />
conjugate<br />
computational fluid dynamics<br />
studies.<br />
In the absence of <strong>for</strong>ced<br />
cooling, the mode of heat<br />
transfer within the bundle (i.e)<br />
between the pins is only<br />
conduction and radiation as<br />
natural convection of nitrogen<br />
through the compact fuel<br />
bundle is negligible. Heat<br />
transfer from hexcan to FTC<br />
ambient (nitrogen) is by natural<br />
convection and radiation. A 30<br />
degree sector of FSA with the<br />
active fuel pin region of 1 m<br />
height has been considered in<br />
the analysis. For a single pin,<br />
the temperature difference<br />
Fig.1 Spent fuel subassembly <strong>for</strong>ce cooled by nitrogen from top<br />
112 FUEL CYCLE
IGC<br />
<strong>Annual</strong> <strong>Report</strong> 2007<br />
Fig.2 Computational mesh of 30 o<br />
sector of FSA<br />
Fig.3 Steady state temperature of<br />
fuel pins and nitrogen (in K) <strong>for</strong><br />
5 kW decay power<br />
between the fuel centre and<br />
clad surface is estimated as ~<br />
1 K only due to very low decay<br />
power of 5 kW. Hence, the fuel,<br />
clad and the gap between them<br />
are lumped into a single<br />
material having equivalent<br />
properties. The finite volume<br />
mesh of the FSA generated<br />
using STAR-CD code is<br />
presented in Fig. 2. The decay<br />
power of the FSA is given as<br />
volumetric heat source in the<br />
fuel pins. Appropriate values of<br />
surface emissivity have been<br />
taken <strong>for</strong> clad and hexcan,<br />
considering the fact that<br />
sodium is coated on the<br />
surfaces.<br />
Predicted steady state<br />
temperatures of the fuel pins,<br />
stagnant nitrogen within the<br />
FSA and hexcan, <strong>for</strong> 5 kW<br />
decay power, are presented in<br />
Fig. 3. As the heat transfer<br />
takes place in the radial<br />
direction and towards the heat<br />
sink which is outside the<br />
hexagonal sheath, the pin<br />
surfaces facing the sheath are<br />
at lower temperature compared<br />
to pins surfaces facing the<br />
centre of the FSA. It is seen that<br />
the temperature of central pin<br />
clad is 1557 K. Since the clad<br />
temperature is exceeding 923<br />
K, <strong>for</strong>ced cooling of the FSA is<br />
essential. Similar maximum<br />
clad temperature is estimated<br />
<strong>for</strong> various values of decay<br />
powers (from 1 to 5 kW). It is<br />
Fig.4 Evolution of central pin clad temperature during loss of cooling<br />
(5 kW decay power)<br />
found that <strong>for</strong> a decay power of<br />
1 kW, the clad temperature is<br />
883 K which is within the limit<br />
of 923 K. For 2 kW decay<br />
power (corresponding to<br />
internal storage <strong>for</strong> 2<br />
campaigns), the clad<br />
temperature is 1118 K. Hence,<br />
FSA with decay power less than<br />
or equal to 1 kW can be<br />
handled in FTC without any<br />
<strong>for</strong>ced cooling. For higher<br />
powers, <strong>for</strong>ced cooling is<br />
essential.<br />
The transient temperature<br />
evolution of spent FSA central<br />
pin clad in FTC is presented in<br />
Fig. 4, <strong>for</strong> the case of 5 kW<br />
decay power. The normal fuel<br />
handling time of spent FSA is<br />
30 - 45 min <strong>for</strong> its travel from<br />
primary sodium pool to EVTP.<br />
When the FSA reaches EVTP<br />
after this time, the clad<br />
temperature is ~773 K. At<br />
EVTP location, the FSA is taken<br />
out of the sodium filled transfer<br />
pot and the clad temperature<br />
again starts to increase when<br />
<strong>for</strong>ced cooling is unavailable<br />
<strong>for</strong> the FSA inside FTC. It takes<br />
15 min <strong>for</strong> the central pin clad<br />
temperature to reach the<br />
limiting value of 923 K. After<br />
this it takes a long time (~4 h)<br />
to reach the steady state<br />
temperature of 1557 K. Hence,<br />
it is established that loss of<br />
cooling can be sustained <strong>for</strong><br />
about 15 min.<br />
FUEL CYCLE 113
IGC<br />
<strong>Annual</strong> <strong>Report</strong> 2007<br />
IV.D. FRFCF<br />
IV.D.1. Status of work on Fast Reactor Fuel Cycle Facility<br />
A Fast Reactor Fuel Cycle<br />
Facility (FRFCF), that is a first of<br />
its kind in the country, is<br />
planned to reprocess the spent<br />
fuel from PFBR to recover<br />
plutonium and uranium, and<br />
recycle them to manufacture<br />
fresh fuel and supply to PFBR<br />
<strong>for</strong> reloads. This would lead to<br />
closing of the PFBR fuel cycle<br />
and eliminate transport of<br />
plutonium required <strong>for</strong> PFBR in<br />
public domain. This large<br />
project, which is a green-field<br />
project, would require<br />
developing the complete<br />
designs of plant and machinery<br />
needed to achieve the<br />
objective. The facility will<br />
contain a reprocessing plant, a<br />
fuel fabrication plant, a<br />
reprocessed uranium oxide<br />
plant, a core sub assembly<br />
plant, and an integrated waste<br />
management plant. The facility<br />
would be self-contained and<br />
located at Kalpakkam. The<br />
work is being piloted by <strong>IGCAR</strong><br />
with technical support from<br />
BARC and NFC. The project<br />
will continue on to the XII Plan<br />
as well. The site selected <strong>for</strong><br />
FRFCF has been approved by<br />
AERB after evaluation. As a<br />
preparatory step to construction<br />
of FRFCF, sanction has been<br />
obtained <strong>for</strong> development of<br />
infrastructure <strong>for</strong> FRFCF and<br />
appointment of consultants <strong>for</strong><br />
detailed design. Basic<br />
infrastructure is being created<br />
to reduce the lead time<br />
Fig.1 Work on main power station building in progress at FRFCF site<br />
Fig.2 PDSC Members inspecting the FRFCF site. Soil load bearing capacity<br />
test set up is in the background.<br />
required to commence the<br />
construction work once the<br />
FRFCF project is sanctioned.<br />
Design of selected<br />
infrastructure buildings has<br />
been completed. Construction<br />
activity related to Main power<br />
station(Fig.1), Stores, and<br />
workshop buildings is in<br />
progress. Work on construction<br />
power supply system has<br />
been completed. Topographic<br />
survey, and Geotechnical /<br />
hydrogeological investigations<br />
of the site have been completed<br />
and the results of geotechnical<br />
investigations are presented in<br />
the article "Integration of<br />
Geophysical and Geotechnical<br />
Investigation at FRFCF Site".<br />
AERB has constituted a Project<br />
Design Safety Committee <strong>for</strong><br />
FRFCF and review of the<br />
preliminary safety analysis<br />
report is in progress.<br />
The committee inspected<br />
the FRFCF site during<br />
geotechnical investigation<br />
phase (Fig.2). Appointment of<br />
consultants <strong>for</strong> the detailed<br />
design is being processed.<br />
Detailed project report <strong>for</strong><br />
FRFCF is planned to be<br />
submitted <strong>for</strong> financial sanction<br />
during the year 2008-09.<br />
114 FUEL CYCLE
IGC<br />
<strong>Annual</strong> <strong>Report</strong> 2007<br />
IV.D.2. Integration of Geophysical and Geotechnical<br />
Investigations at FRFCF Site<br />
Geophysical methods have complete site characterization.<br />
been used successfully <strong>for</strong> Generalized soil profile,<br />
geotechnical engineering velocity model <strong>for</strong> site<br />
applications which include classification, rock mass<br />
establishing stratigraphy, depth classification, and dynamic<br />
to bed rock, and locating properties were arrived through<br />
discontinuities<br />
and integration of the results.<br />
abnormalities. Appropriate<br />
inclusion of a geophysical The investigations show that<br />
survey into geotechnical bed rock is available at a depth<br />
subsurface exploration and of 15m to 20m below the<br />
testing programme also ground level. The top level of<br />
provides valuable in<strong>for</strong>mation weathering grade III rock<br />
on the lateral variation of soil established from seismic<br />
properties. A shallow seismic<br />
refraction survey was carried<br />
refraction and geotechnical is<br />
investigation shown in Fig.2.<br />
out during the initial planning<br />
stage at FRFCF site to decide Dynamic properties were<br />
the foundation level of various evaluated from the seismic<br />
civil structures of this facility. cross-hole survey and are<br />
Subsurface exploration of this<br />
site was carried out at this site<br />
to evaluate properties of the<br />
sub soil. Fig. 1 shows a view of<br />
shown in Table1. The variation<br />
of shear wave velocity with<br />
depth is shown in Fig 3. These<br />
values will be used to provide<br />
the drilling work at FRFCF site. the elastic parameters <strong>for</strong><br />
Findings of geophysical and earthquake analysis and also<br />
geotechnical investigations as input in dynamic response<br />
were integrated to obtain studies.<br />
Table 1: Range of dynamic soil properties<br />
Fig.1 Drilling work at FRFCF<br />
Fig.2 Top of weathering grade 3 rock<br />
Shear Wave velocity Vs Depth<br />
Shear wave Velocity m/s<br />
0 1000 2000 3000<br />
0<br />
Depth<br />
10<br />
20<br />
30<br />
Shear Wave<br />
Velocity Vs<br />
Depth<br />
40<br />
50<br />
Fig.3 Variation of shear wave<br />
velocity with depth<br />
FUEL CYCLE 115
Chapter -5<br />
ENABLING TECHNOLOGIES<br />
V.A. Inspection Techniques<br />
V.A.1. Development of Novel Combination of Immersion and<br />
Time of Flight Diffraction <strong>for</strong> Examination of Thin Weldments<br />
Time of Flight Diffraction (TOFD) technique is an advanced ultrasonic nondestructive testing<br />
method which can be used <strong>for</strong> accurate sizing of the discontinuities. This method is based on<br />
the time difference between the diffracted signals obtained from the tips of the discontinuity.<br />
Codes of practice recommend TOFD <strong>for</strong> weldments with thickness greater than 12.5 mm. Very<br />
few studies have been undertaken internationally <strong>for</strong> specimen thickness less than 12.5mm.<br />
Internationally TOFD combined with signal processing has been applied to specimen thickness<br />
down to 6mm. As the thickness of the specimen decreases, the lateral wave, diffracted echoes<br />
from the discontinuity and the back wall echo merge together and hence defect detection and
IGC<br />
<strong>Annual</strong> <strong>Report</strong> 2007<br />
characterization is not possible.<br />
This problem has been<br />
successfully overcome at the<br />
Quality Assurance Division<br />
using a novel combination of<br />
TOFD and immersion. The<br />
principle is illustrated as a<br />
schematic sketch in Fig.1.<br />
For initial studies, three<br />
stainless steel plates with<br />
artificial reference defects were<br />
chosen. Plate 1 was 10 mm<br />
thick and had five side drilled<br />
holes of 2 mm diameter at<br />
different locations. Plate 2 was<br />
5 mm thick with 5% and 10%<br />
notches and two side drilled<br />
holes (2 mm diameter) and<br />
Plate 3 was 3 mm thick with a<br />
5% and 10% notch. Since the<br />
plates were quite large and the<br />
region of interest was small, to<br />
maintain the required water<br />
path, a dam was constructed.<br />
Fig. 2(a) shows the<br />
experimental setup.<br />
Fig.1 Beam path and angle of propagation through water and<br />
material in the immersion TOFD experiment<br />
The parameters to be<br />
considered were thickness of<br />
the water column over the<br />
material and probe tilt (Fig.1).<br />
Based on the time of flight<br />
equations, the time difference<br />
between lateral wave and back<br />
wall echo was computed as a<br />
function of probe tilt <strong>for</strong><br />
specimens of different<br />
thickness. It was observed that<br />
as the probe separation and the<br />
propagation angle inside the<br />
material decreases, this time<br />
difference increases which<br />
leads to better spatial<br />
resolution (Table1).<br />
Fig.2 (a) Experimental setup (b) 3.15 mm thick welded hexagonal sheath<br />
(c) TOFD image of a welded plate having no defect (slop is due to<br />
curvature of the plate) and (d) TOFD images indicating lack of<br />
penetration and porosity.<br />
The required lower probe<br />
separations were not possible<br />
in conventional TOFD because<br />
of the size of the probes. Based<br />
on the experiments on the<br />
reference specimens, further<br />
examinations were carried out<br />
on welded specimens of<br />
thickness 3.15mm. These<br />
specimens pertain to the<br />
hexagonal sheath of the dummy<br />
fuel sub-assembly. The weld<br />
specimens had defects such as<br />
lack of penetration and porosity<br />
ENABLING TECHNOLOGIES 117
IGC<br />
<strong>Annual</strong> <strong>Report</strong> 2007<br />
Table 1 : Different parameters to be considered <strong>for</strong> immersion TOFD<br />
which were earlier confirmed<br />
through radiography. The<br />
combination of TOFD and<br />
immersion could pick up these<br />
defects, which was not possible<br />
with conventional TOFD<br />
method. Typical TOFD images<br />
are shown in Fig. 2 (c) and 2(d)<br />
respectively. The welded<br />
specimens were subjected to<br />
radiography and the<br />
radiographic images were<br />
processed with appropriate<br />
methodologies and dimensions<br />
of the defects estimated.<br />
Dimensional measurements<br />
from radiographs were<br />
compared with the dimensions<br />
from TOFD measurement. A<br />
very good correlation was<br />
obtained with errors being less<br />
than 5%.<br />
This experiment establishes<br />
that TOFD combined with<br />
immersion extends the limits of<br />
examination of conventional<br />
TOFD and is a novel solution<br />
<strong>for</strong> the examination of thin<br />
weldments.<br />
V.A.2. Infra Red Thermal Imaging of Weld Pool in<br />
Real Time during GTAW of Type 316 LN Stainless Steel<br />
In remote welding operations,<br />
on-line monitoring and control<br />
of Gas Tungsten Arc Welding<br />
(GTAW) process is very<br />
essential and a methodology is<br />
being established using IR<br />
Thermography. The infra red<br />
camera was mounted on the<br />
torch assembly to facilitate online<br />
monitoring of the welding<br />
process and determine surface<br />
temperature distribution<br />
surrounding the weld pool<br />
during GTAW. The interference<br />
from the arc light and the hot<br />
tungsten electrode on the<br />
image quality is minimized by<br />
using band pass filters. The<br />
instantaneous thermal images<br />
of the weld pool that were<br />
captured by the infra red<br />
camera was transferred to a<br />
computer. The infra red camera<br />
determines the surface<br />
temperature distribution of the<br />
plate by capturing the emitted<br />
energy within a wavelength<br />
band of 4 - 6 µm. Each scan of<br />
the camera was transferred as a<br />
frame consisting of<br />
320 x 240 discrete temperature<br />
measurements. Full frame<br />
analysis was carried out to<br />
determine the temperature<br />
surrounding the weld pool <strong>for</strong><br />
the entire length of the plate<br />
being welded and is shown in<br />
Fig. 1. This data was very useful<br />
in validating the heat flow<br />
118 ENABLING TECHNOLOGIES
IGC<br />
<strong>Annual</strong> <strong>Report</strong> 2007<br />
Fig. 1 Temperature distribution<br />
surrounding the weld pool<br />
models developed using FEM<br />
and also in identifying the<br />
various microstructural zones in<br />
a weldment. Weld bead width<br />
was measured and displayed<br />
on-line <strong>for</strong> the entire length of<br />
the weld as shown in Fig. 2.<br />
There was good correlation<br />
between thermal bead width<br />
and the actual bead width.<br />
Macroscopic temperature<br />
gradients determined using line<br />
scan technique was correlated<br />
with the variations in the depth<br />
of penetration. A fuzzy rule<br />
based control algorithm is<br />
being developed <strong>for</strong> on-line<br />
monitoring and control of<br />
GTAW in order to achieve the<br />
desired weld bead geometry.<br />
Full frame analysis was<br />
carried out to generate thermal<br />
signature images <strong>for</strong> detecting<br />
various weld defects such as<br />
Fig.2 Weld pool width <strong>for</strong> the<br />
entire weld length<br />
lack of penetration, lack of<br />
fusion, tungsten inclusion and<br />
porosity. These signature<br />
images are being used as<br />
reference images <strong>for</strong> on-line<br />
quality monitoring of the 316<br />
LN stainless steel weld during<br />
GTAW.<br />
V.A.3. Multi-NDE Techniques <strong>for</strong> Comprehensive<br />
Characterization of Microstructures in<br />
M250 Maraging Steel<br />
M250 maraging steel, by<br />
virtue of its excellent<br />
mechanical properties i.e.<br />
ultra-high yield strength<br />
combined with good fracture<br />
toughness, is preferred as<br />
structural material <strong>for</strong> critical<br />
applications in advanced<br />
technologies. Besides, its high<br />
strength to weight ratio, good<br />
weldability and easy<br />
machinability in solution<br />
annealed (SA) condition and<br />
dimensional stability during<br />
aging make this material an<br />
ideal choice <strong>for</strong> critical rocket<br />
motor casing applications in<br />
aerospace industries. The<br />
strength in aged condition is<br />
derived from the fine and<br />
coherent intermetallic<br />
precipitates, whereas low<br />
carbon martensitic structure<br />
provides the high fracture<br />
toughness. Over-aging results<br />
in coarsening of the<br />
intermetallic precipitates in<br />
addition to reversion of<br />
martensite to austenite which<br />
affects both tensile and fracture<br />
properties. Characterization of<br />
the complex microstructures<br />
generated in components<br />
during aging is very important<br />
<strong>for</strong> qualification of components<br />
integrity. Non-destructive<br />
evaluation (NDE) techniques<br />
show good potential <strong>for</strong> quick<br />
and reliable characterization of<br />
microstructures. Interaction of<br />
non-destructive interrogating<br />
media with complex<br />
microstructural features is<br />
different, with each<br />
NDE techniques giving<br />
ENABLING TECHNOLOGIES 119
IGC<br />
<strong>Annual</strong> <strong>Report</strong> 2007<br />
Table 1 : Relative comparison of sensitiveness of different NDE techniques <strong>for</strong><br />
characterization of ageing behaviour in maraging steel<br />
N-Non sensitive<br />
YY-More sensitive<br />
complimentary in<strong>for</strong>mation or<br />
confirming the observation of<br />
other techniques, this enhances<br />
the use of multiple techniques<br />
and adopting multi-parametric<br />
approaches is very attractive<br />
and is expected to enable very<br />
effective characterization of<br />
microstructures. In this study,<br />
NDE parameters such as<br />
ultrasonic velocity, magnetic<br />
Barkhausen emission (MBE)<br />
RMS voltage, eddy current (EC)<br />
Fig.1 Variation in hardness,<br />
ultrasonic wave velocity, and<br />
positron annihilation life time<br />
parameter with aging at 755 K.<br />
impedance magnitude,<br />
positron life-time and X-ray<br />
diffraction based austenite<br />
volume fraction have been<br />
employed to develop a<br />
comprehensive<br />
NDE<br />
Y-Sensitive<br />
Y?-Sensitive but requries precise measurements<br />
methodology<br />
<strong>for</strong><br />
characterization of ageing<br />
behaviour of M250 grade<br />
maraging steel aged at 755 K<br />
<strong>for</strong> different durations.<br />
The variations in hardness,<br />
ultrasonic longitudinal wave<br />
velocity and positron<br />
annihilation life time with aging<br />
duration are shown in Fig.1.<br />
The variations in hardness,<br />
MBE rms voltage, volume % of<br />
austenite (XRD based) and<br />
impedance amplitude with<br />
aging duration are shown in<br />
Fig.2. Ultrasonic velocity<br />
showed good promise in<br />
characterizing the intermetallic<br />
precipitation process and was<br />
able to pick up the austenite<br />
in<strong>for</strong>mation to some extent. Its<br />
drawback is with respect to<br />
obtaining any in<strong>for</strong>mation<br />
about the defect structure and<br />
early detection of initiation of<br />
austenite reversion. Hence, this<br />
technique is found to be very<br />
sensitive to monitor only the<br />
intermetallic precipitation<br />
behaviour. Positron annihilation<br />
studies were found to be very<br />
sensitive to changes in defect<br />
structure during initial aging<br />
and precipitation to some<br />
extent. Fig.3 shows the bright<br />
field TEM image of defects<br />
(dislocations) in solution<br />
annealed condition. The<br />
austenite reversion has<br />
insignificant effect on positron<br />
annihilation parameter. Hence,<br />
this technique can be used <strong>for</strong><br />
high sensitive characterization<br />
of defects such as vacancies or<br />
dislocations. MBE study showed<br />
good promise in identifying the<br />
non-magnetic austenite phase<br />
compared to the intermetallic<br />
precipitation and defect<br />
structure. EC technique had<br />
shown good promise in<br />
characterizing the austenitic<br />
reversion ahead of ultrasonic<br />
and almost on par with MBE.<br />
As this technique is more<br />
amenable to shop floor, it can<br />
be used <strong>for</strong> quick and reliable<br />
determination of volume % of<br />
austenite on shop floor as well<br />
as on components. The bright<br />
field TEM image showing<br />
Fig.1 Variation in hardness, MBE rms<br />
voltage, EC amplitude and<br />
volume % of austenite determined<br />
by XRD with aging at 755 K.<br />
120 ENABLING TECHNOLOGIES
IGC<br />
<strong>Annual</strong> <strong>Report</strong> 2007<br />
austenite and the intermetallics<br />
could be observed in Fig.4.<br />
XRD technique was found to be<br />
good in quantifying austenite<br />
Fig.3 Bright field image<br />
(showing high dislocation<br />
density) specimen solution annealed<br />
at 1093 K <strong>for</strong> 1 h<br />
followed by air cooling.<br />
but was unable to determine<br />
the austenitic initiation early<br />
due to low sensitiveness of the<br />
technique <strong>for</strong> austenite volume<br />
Fig.4 Bright field image of the<br />
specimen thermally aged at 755 K<br />
<strong>for</strong> 100 h followed by water<br />
quenching, showing long and patchy<br />
austenite (marked as A), patchy<br />
Ni 3 (Ti, Mo) (marked as B) and<br />
globular Fe 2 Mo (marked as C)<br />
fraction (less than 2 %).<br />
However, XRD techniques has<br />
been used as a benchmark <strong>for</strong><br />
quantitative estimation of<br />
volume fraction of reverted<br />
austenite using MBE and EC<br />
techniques. Table 1 brings out<br />
at a glance the relative<br />
capabilities of various NDE<br />
parameters employed <strong>for</strong><br />
characterization of various<br />
microstructural features in<br />
M250 grade maraging steel.<br />
Thus, by adopting multi-NDE<br />
approach, it is possible to get a<br />
comprehensive picture of<br />
interaction of interrogating<br />
media with microstructural<br />
features towards developing a<br />
robust methodology <strong>for</strong><br />
characterization<br />
of<br />
microstructures.<br />
V.A.4. A Novel Methodology based on Ultrasonic<br />
Attenuation to Characterize the Dynamically Recrystallized<br />
Microstructure in Alloy D9<br />
A new methodology based on<br />
ultrasonic C-scan presentation<br />
has been identified to image<br />
the microstructural evolution<br />
during dynamic recrystallization<br />
(DRX) of alloy D9. Hydraulic<br />
press <strong>for</strong>ging operations were<br />
carried out on 30 mm height<br />
and 20 mm diameter<br />
compression specimens at a<br />
mean strain rate of 0.22 s -1<br />
using a 250-ton triple-action<br />
hydraulic press. Four specimens<br />
were <strong>for</strong>ged at 1273 K <strong>for</strong><br />
different strains in the range of<br />
0.1 - 0.5. The in-house<br />
(a)<br />
developed ultrasonic C-scan<br />
imaging system 'ULTIMA 200'<br />
and a 6 MHz point focused<br />
(b)<br />
Fig. 1 C-scan image of the specimens <strong>for</strong>ged at 1273 K to<br />
a stain of (a) 0.2 and (b) 0.5<br />
ENABLING TECHNOLOGIES 121
IGC<br />
<strong>Annual</strong> <strong>Report</strong> 2007<br />
immersion transducer were<br />
used to acquire the data and<br />
obtain the C-scan images. The<br />
first backwall echoes obtained<br />
were gated to obtain the C-<br />
scan image corresponding to<br />
their amplitude. Electron back<br />
scattered diffraction (EBSD)<br />
data were collected using a<br />
TSL-OIM (orientation imaging<br />
microscopy) system on FEI<br />
Quanta 200 SEM operating at<br />
20 kV.<br />
From the ultrasonic study, it<br />
has been observed that the<br />
specimens with true strains of<br />
0.2 (Fig.1a) or lower did not<br />
show any variation in the<br />
amplitude of the ultrasonic first<br />
backwall echo. The specimen<br />
with 0.3 strain, on the other<br />
hand, showed visible variation<br />
in the C-scan image. However,<br />
this variation was not<br />
systematic. The specimen<br />
<strong>for</strong>ged to 0.5 strain could<br />
clearly bring out systematic<br />
variations in the amplitude of<br />
the first backwall echo. It<br />
exhibited higher amplitude of<br />
the first backwall echoes along<br />
one of the diagonals and one<br />
of the curved sides (marked as<br />
'A' and 'B' respectively in Fig.<br />
1b).<br />
Fig.2 Image quality (IQ) maps of hot de<strong>for</strong>med specimens at<br />
0.2 strain. Boundaries with more than 5º misorientation and the twin<br />
boundaries are respectively marked as dark and white lines<br />
Fig.3 (a) Image quality (IQ) map of specimen <strong>for</strong>ged to 0.5 strain.<br />
Graphics conventions are same as in figure 2. (b) Enclosed section of<br />
(a) is brought out (at a higher magnification) as IPF (inverse pole figure) map,<br />
with more than 5º boundaries marked as dark lines.<br />
(c) The 'necklace' grains (fine equiaxed grains around the grain<br />
boundaries) were partitioned from (b). Grains with less than 5 m size<br />
were considered as 'necklace' grains<br />
It has been observed in our<br />
recent study that attenuation of<br />
ultrasonic waves of a particular<br />
frequency in alloy D9 is mainly<br />
governed by grain size. The<br />
specimen with larger grain size<br />
has been found to scatter more<br />
as compared to the finer one.<br />
Accordingly, larger grain size<br />
regions lead to lower amplitude<br />
of the first backwall echoes and<br />
vice versa. This observation<br />
could be employed to analyze<br />
the findings of C-scan images.<br />
Since specimen with 0.2 strain<br />
did not show any perceptible<br />
variation in the amplitude of<br />
the first backwall echo, it is<br />
likely that this specimen<br />
contains almost uni<strong>for</strong>m grain<br />
size distribution. This could be<br />
122 ENABLING TECHNOLOGIES
IGC<br />
<strong>Annual</strong> <strong>Report</strong> 2007<br />
corroborated from the Image<br />
Quality (IQ) map (as obtained<br />
from EBSD imaging) of this<br />
specimen (Fig. 2). The higher<br />
amplitudes of the first backwall<br />
echoes along one of the<br />
diagonals and one of the<br />
curved sides at 0.5, on the<br />
other hand, indicate presence<br />
of finer grains. Such grains, on<br />
the other hand,<br />
can be related to<br />
de<strong>for</strong>mation and/or dynamic<br />
recrystallization. It needs to be<br />
noted that intense shear zone<br />
<strong>for</strong>mation is expected from<br />
strain heterogeneities along the<br />
diagonal. The <strong>for</strong>mation of<br />
intense shear zone along only<br />
one of the diagonals is<br />
attributed to the presence of a<br />
little skew in the de<strong>for</strong>mation.<br />
To corroborate this, EBSD scans<br />
were per<strong>for</strong>med on this<br />
de<strong>for</strong>med sample. The<br />
presence of necklace DRX<br />
grains could clearly be<br />
observed from the EBSD map<br />
(Fig. 3). The EBSD studies,<br />
thereby, substantiate that the<br />
ultrasonic C-scan system<br />
can be used <strong>for</strong><br />
imaging the variations in<br />
m i c r o s t r u c t u r e ,<br />
in particular grain<br />
size, in the specimens.<br />
Imaging of microstructural<br />
features through ultrasonic<br />
measurements is advantageous<br />
as the average of the<br />
microstructural features in the<br />
thickness direction is revealed<br />
by ultrasonic measurements as<br />
compared to only surface<br />
in<strong>for</strong>mation<br />
through<br />
metallographic techniques.<br />
Further, the C-scan image can<br />
also be converted to the image<br />
of average grain size, if a<br />
proper correlation between<br />
amplitude of the first backwall<br />
echo and grain size is<br />
established a priori <strong>for</strong> any<br />
material of investigation.<br />
V.B. Sensors<br />
V.B.1. Per<strong>for</strong>mance Evaluation of a Semiconducting Oxide Based Sensor<br />
<strong>for</strong> Measuring Trace Levels of Hydrogen in Argon Cover Gas<br />
of SOWART Facility<br />
For continuous monitoring the<br />
hydrogen levels in the argon<br />
cover gas over liquid sodium of<br />
Sodium Water Reaction Test<br />
Facility (SOWART), a hydrogen<br />
monitoring system using a<br />
thermal conductivity detector<br />
(TCD) has been installed and is<br />
in service. A thin film based<br />
palladium doped SnO 2<br />
semiconductor oxide sensor,<br />
shown in Fig.1 has also been<br />
installed in tandem with this<br />
TCD based system <strong>for</strong> its<br />
per<strong>for</strong>mance evaluation. It<br />
Fig.1 Photograph of SnO 2 sensor installed in SOWART<br />
ENABLING TECHNOLOGIES 123
IGC<br />
<strong>Annual</strong> <strong>Report</strong> 2007<br />
Fig.2 SnO 2 sensor output <strong>for</strong><br />
different concentrations of<br />
hydrogen in argon<br />
analyses<br />
hydrogen<br />
concentration of the argon<br />
carrier gas that exits from the<br />
nickel coil continuously. This<br />
sensor is operated at 623 K<br />
with a control cum signal<br />
processing unit designed and<br />
developed in-house by CIFD,<br />
CG . The output of the sensor<br />
varies linearly with hydrogen<br />
concentration in the range from<br />
5 to 70 ppm <strong>for</strong> H 2 , as shown<br />
by the calibration plot given in<br />
Fig. 2. The per<strong>for</strong>mance of the<br />
sensor has been under study <strong>for</strong><br />
nearly seven months, during<br />
which sodium in the loop had<br />
been refilled twice and dumped<br />
once. The background stability<br />
of the sensor during this seven<br />
months is ±1 ppm.<br />
After introducing the sensor in<br />
the loop, liquid sodium was<br />
filled in SOWART (after a<br />
shutdown duration of 46 days).<br />
The temperature of sodium was<br />
isothermally maintained at 573<br />
K <strong>for</strong> 70 h and was<br />
subsequently increased to 723<br />
K. The sensor output increased<br />
from a background value of<br />
0.03 V to 0.15 V, which,<br />
corresponds to about 14 ppm<br />
of H 2 as inferred from the<br />
calibration plot [Fig. 2].<br />
During the next sodium<br />
dumping, the sensor output<br />
increased to 0.18 V which<br />
corresponded to about 20 ppm<br />
of H 2 . During the second filling<br />
of sodium into the loop (after a<br />
shutdown duration of 20 days),<br />
0.5 V increase in the signal<br />
output was observed and this<br />
corresponded to > 70 ppm of<br />
H 2 . All these three observed<br />
transients are shown in Fig. 3.<br />
The sensor was calibrated onsite<br />
after these excursions and<br />
calibration trace obtained<br />
matched with the preinstallation<br />
calibration shown in<br />
Fig.2. This indicates that the<br />
calibration of the sensor<br />
towards<br />
different<br />
concentrations of hydrogen is<br />
stable over the duration.<br />
When the sodium in the loop<br />
is in dumped state, the nickel<br />
diffuser coil of the TCD based<br />
hydrogen sensing system is<br />
maintained at 423K. After the<br />
sodium filling of the loop, the<br />
temperature of the nickel coil is<br />
raised gradually to 773 K<br />
within about 2 h. The heat-up<br />
duration is ca. 2 h. Theoretical<br />
calculations showed that the<br />
equilibrium hydrogen<br />
concentration in the argon<br />
carrier gas inside the nickel coil<br />
would be at least 50% or above<br />
when its temperature increases<br />
above573 K. When the coil<br />
temperature reaches 773 K, the<br />
argon carrier gas that exits<br />
from the nickel diffuser coil is in<br />
complete equilibrium with<br />
hydrogen in argon cover gas.<br />
Based on these considerations,<br />
the following inferences can be<br />
drawn : a) there is an increase<br />
in hydrogen concentration in<br />
the cover gas of the sodium<br />
system during sodium filling<br />
process and the increase is<br />
found to be at least in the<br />
range of 5 to > 70 ppm and b)<br />
the changes in H 2<br />
concentration at these low<br />
levels are reliably detected by<br />
the semiconducting oxide<br />
based sensor.<br />
Fig.3 Response transients of SnO 2<br />
sensor during sodium filling<br />
campaigns<br />
124 ENABLING TECHNOLOGIES
IGC<br />
<strong>Annual</strong> <strong>Report</strong> 2007<br />
V.B.2. Development of PEM Based Three Electrode<br />
Amperometric Hydrogen Sensor with Control and<br />
Measurement Electronics<br />
Hydrogen sensors find<br />
application in many areas of<br />
fast reactor technology.<br />
Hydrogen is required to be<br />
monitored in the argon cover<br />
gas of fast reactors and also in<br />
the inert medium during sodium<br />
cleaning and sodium disposal<br />
operations. A fuel cell based<br />
amperometric hydrogen sensor<br />
in three electrode configuration<br />
has been developed and tested<br />
in chronoamperometric mode<br />
<strong>for</strong> hydrogen monitoring during<br />
the above processes. Three<br />
electrode amperometric<br />
sensors are expected to have<br />
better selectivity, stability and<br />
response behavior compared to<br />
two electrode sensors. A<br />
compact,<br />
portable,<br />
potentiostatic control and<br />
measurement electronics has<br />
Fig.1a Schematic of the hydrogen<br />
sensor<br />
Fig.1b Experimental set-up<br />
been developed <strong>for</strong> the three<br />
electrode sensor. This compact<br />
electronics realises in-situ<br />
industrial application of three<br />
electrode sensors and replaces<br />
the imported potentiostat which<br />
is general purpose in nature<br />
and is hence bulky and suitable<br />
only <strong>for</strong> laboratory<br />
applications. This is also an<br />
import substitution step. The<br />
circuit fixes the sensing<br />
electrode potential with respect<br />
to reference electrode. This is<br />
achieved using the feed back<br />
current between the sensing<br />
and reference electrode and by<br />
injecting the required current at<br />
the counter electrode in an<br />
analog loop. The sensor uses<br />
Nafion as proton exchange<br />
membrane (PEM) and platinum<br />
as electrodes. The sensor<br />
functions in fuel cell mode,<br />
H 2 /Pt//Nafion//Pt/O 2 . The<br />
reference electrode is a<br />
platinum wire at the counter<br />
electrode side. The supply of<br />
hydrogen at the sensing<br />
electrode is limited by a<br />
physical barrier incorporated at<br />
the sensing electrode. The<br />
counter electrode is exposed to<br />
air and the sensor functions as<br />
a 'self breathing' device<br />
requiring no air flushing at the<br />
counter electrode. Fig. 1 shows<br />
the schematic of the sensor and<br />
the photograph of the<br />
experimental setup. Fig. 2<br />
shows the response curve and<br />
calibration plot of the sensor.<br />
The above design opens venues<br />
to the development of multi<br />
potentiostat<br />
based<br />
electrochemical sensors with<br />
multi gas measurement<br />
capability.<br />
Fig.2a. The response curve of the<br />
sensor<br />
Fig.2b The calibration plot of<br />
the sensor<br />
ENABLING TECHNOLOGIES 125
IGC<br />
<strong>Annual</strong> <strong>Report</strong> 2007<br />
V.C. Electronics and Instrumentation<br />
V.C.1. Optimum Location of Core Monitoring Thermocouples<br />
Thermocouples housed in<br />
thermowells are provided in<br />
Control Plug (CP) <strong>for</strong><br />
continuous monitoring of<br />
sodium temperature at the exit<br />
of all fuel-subassemblies (FSA)<br />
and first row of blanketsubassemblies<br />
(BSA) in PFBR.<br />
These thermowells <strong>for</strong> the<br />
thermocouples are supported<br />
by the Core Cover Plate (CCP)<br />
and guided by Lattice Plate (LP).<br />
Sodium jet issuing out from the<br />
core impinges on thermowells,<br />
LP and CCP and gets deflected<br />
horizontally. This horizontal<br />
deflection leads to radial<br />
bending / flowering of the<br />
streamlines. This effect<br />
demands that thermocouples of<br />
various SA are required to be<br />
lowered sufficiently such that<br />
they are submerged in their<br />
respective streams. To measure<br />
the coolant temperature issuing<br />
out from various SAs, the<br />
thermocouple tips should be<br />
located as close as possible to<br />
the SA exit. But to aid undersodium<br />
viewing be<strong>for</strong>e fuel<br />
handling, the thermocouple tips<br />
are located at an axial distance<br />
of 100 mm from SA top (at<br />
operating temperature). It is<br />
very important to determine the<br />
temperature attenuation of the<br />
coolant streams at the It has been established that<br />
thermocouple tips through water can be used as<br />
experiments.<br />
analogous fluid to simulate the<br />
mixing phenomena of nonisothermal<br />
An experiment has been<br />
sodium jets if<br />
carried out in SAMRAT model to Reynolds (Re) number and<br />
determine the optimum Peclet (Pe) number are<br />
location of core temperature sufficiently large (Re > 20,000<br />
monitoring thermocouples and Pe > 600) both in<br />
above core top so that the SA prototype and model. The<br />
exit temperature can be experiments have been carried<br />
monitored accurately. SAMRAT<br />
is a 1/4 scale model of PFBR<br />
out in model satisfying the<br />
above similarity criteria.<br />
primary circuit. De-mineralized<br />
water is used as simulant fluid There is a provision to send<br />
in this model.<br />
water separately in few<br />
Though the hydraulic<br />
subassemblies at the last row of<br />
the fuel zone. The last row of<br />
properties of water are identical<br />
to that of sodium, the thermal<br />
properties are far from similar.<br />
fuel zone was selected <strong>for</strong> this<br />
experiment because maximum<br />
attenuation of temperature is<br />
Fig.1 Schematic showing retractable thermocouple location<br />
126 ENABLING TECHNOLOGIES
IGC<br />
<strong>Annual</strong> <strong>Report</strong> 2007<br />
expected in this row. Hence the<br />
optimum position of the<br />
thermocouple tip determined<br />
<strong>for</strong> this location will be<br />
conservative <strong>for</strong> the other inner<br />
rows. Hot water (≈ 338 K) was<br />
sent through one SA, whereas<br />
in the rest of the core, cold<br />
water was circulated. The<br />
attenuation of temperature at<br />
this thermocouple tip location<br />
by the neighbouring SAs was<br />
studied. A retractable<br />
thermocouple was inserted in<br />
this location from the CP top as<br />
shown in Fig.1. The height of<br />
the thermocouple tip above<br />
core top can be varied by<br />
traversing the thermocouple<br />
from CP top. From the<br />
statistical analysis of data the<br />
mean temperature as seen by<br />
each thermocouple was<br />
estimated. These temperature<br />
data are presented in a<br />
normalized <strong>for</strong>m to transpose<br />
the result into reactor case by<br />
substituting the prototype<br />
parameters. The normalization<br />
is done in the following<br />
manner.<br />
where,<br />
T = Mean temperature of the<br />
fluid as measured by the<br />
thermocouple mounted in CP<br />
T h = Mean temperature of the<br />
hot inlet fluid (Thermocouple<br />
mounted at the SA exit)<br />
Tc<br />
= Mean temperature of<br />
the cold inlet fluid<br />
(Thermocouple mounted at the<br />
SA exit)<br />
The normalized mean<br />
temperature ( )is<br />
plotted against the elevation of<br />
the thermocouple tip above<br />
core top <strong>for</strong> various<br />
experimental conditions. The<br />
result is presented Fig. 2. It can<br />
be seen from the above figure<br />
that normalized mean<br />
temperature is close to unity<br />
(which means the fluid<br />
temperature as measured by<br />
the thermocouple is almost<br />
equal to the SA exit<br />
temperature) at the core<br />
temperature monitoring point<br />
upto the height of 34 mm<br />
above core top in model and<br />
then it decreases gradually<br />
along the jet axis due to the<br />
increased mixing of the liquid<br />
streams. The corresponding<br />
height of the thermocouple tip<br />
in reactor is 136 mm (because<br />
the geometric scale of the<br />
model is 1:4). The normalized<br />
mean temperature is also<br />
independent of Re upto this tip<br />
elevation above core top.<br />
Fig.2 Variation in mean temperature along the jet axis (in model)<br />
ENABLING TECHNOLOGIES 127
IGC<br />
<strong>Annual</strong> <strong>Report</strong> 2007<br />
V.C.2. Development of Pulse Coded Safety<br />
Logic System <strong>for</strong> PFBR<br />
Reactor safety logic is designed<br />
to initiate safety action against<br />
Design Basis Events. The<br />
reactor is shutdown by deenergizing<br />
electromagnets and<br />
dropping the absorber rods<br />
under gravity. In PFBR,<br />
shutdown is effected by two<br />
independent shutdown systems,<br />
viz., Control and Safety Rod<br />
Drive Mechanism (CSRDM) and<br />
Diverse Safety Rod Drive<br />
Mechanism (DSRDM). Two<br />
separate safety logics are<br />
developed <strong>for</strong> CSRDM and<br />
DSRDM, i.e., Safety Logic with<br />
Fine Impulse Test (SLFIT) <strong>for</strong><br />
CSRDM, and Pulse Coded<br />
Safety Logic (PCSL) <strong>for</strong> DSRDM.<br />
The PCSL primarily utilizes the<br />
fact that the vast majority of<br />
faults in the logic circuitry result<br />
in static conditions at the<br />
output. It is arranged such that<br />
the presence of a dynamic logic<br />
signal is required to hold the<br />
shutdown actuators and any<br />
DC logic state will release<br />
them. It is a dynamic, selftesting<br />
logic and fail safe<br />
design.<br />
PCSL system will be<br />
introduced <strong>for</strong> the first time in<br />
Indian reactor. Being a safety<br />
critical system, PCSL system was<br />
developed in three phases. To<br />
demonstrate the principle of<br />
PCSL, a lab prototype PCSL<br />
system with 3 parameters was<br />
developed and tested<br />
successfully with actual EM coil.<br />
After completion of lab<br />
prototype, functional prototype<br />
PCSL System having all 14<br />
parameters required <strong>for</strong> PFBR<br />
was developed. It is<br />
implemented using hardware,<br />
not calling <strong>for</strong> software<br />
verification and validation.<br />
State-of-art technology has<br />
been used <strong>for</strong> PCSL system. To<br />
avoid clock failure, redundant<br />
clock oscillator has been used.<br />
The digital logic has been<br />
implemented in Complex<br />
Programmable Logic Devices<br />
(CPLD), achieving high<br />
reliability due to high level of<br />
integration, less number of<br />
interconnection and low power<br />
consumption. To improve<br />
further reliability, back plane<br />
arrangement was done to avoid<br />
loose interconnection. All the<br />
10 number of Printed Circuit<br />
Boards (PCB) are<br />
accommodated in a 19" sub<br />
rack. To drive the EM coil<br />
current, Power MOSFETs are<br />
used. To vary the current<br />
through EM coils, rheostats<br />
have been used. For current<br />
indication, Indication Alarm<br />
Meter (IAM) has been used<br />
which also processes the alarm<br />
to control room at low current.<br />
To improve reliability of the<br />
system, both the safety logic<br />
systems were linked optically.<br />
Being a digital logic, stuck at'1'<br />
and stuck at '0' fault may occur.<br />
Pulse pattern fault, latch test<br />
fault, power gate fault, trip<br />
parameter status annunciation<br />
and cross link between two<br />
safety logic faults are analyzed.<br />
To diagnoses all these types of<br />
faults, a diagnostic logic was<br />
designed and implemented.<br />
Diagnostic logic annunciates<br />
alarm locally through LEDs, to<br />
Control Room (CR) and Backup<br />
Control Room (BCR) through<br />
relays and to Distributed Digital<br />
Control System (DDCS) through<br />
opto-isolation. At the design<br />
stage, diversity between two<br />
safety logic systems is<br />
maintained using different<br />
design methodology, different<br />
components having different<br />
technology. The whole system<br />
was assembled in a 19" rack.<br />
To test the functionality of the<br />
system manual simulators were<br />
designed. The signal simulator<br />
simulates the trip signals from<br />
the reactor, control room<br />
simulator designed <strong>for</strong><br />
displaying CR related outputs<br />
and backup control room<br />
simulator designed <strong>for</strong><br />
128 ENABLING TECHNOLOGIES
IGC<br />
<strong>Annual</strong> <strong>Report</strong> 2007<br />
Fig.1 Industrial version of<br />
PCSL system<br />
displaying BCR related outputs.<br />
The functional test was<br />
completed successfully.<br />
The PCSL system is to be used<br />
in PFBR. It will be under<br />
industrial environment. Be<strong>for</strong>e<br />
putting the system under<br />
industrial environment, the<br />
entire qualification test has to<br />
be done. Finally an industrial<br />
version PCSL system was<br />
designed. Here all the aspects<br />
of industrial environment have<br />
been taken care from EMI/EMC<br />
to environmental qualification.<br />
In the design stage we have<br />
implemented all the required<br />
features. For EMI/EMC<br />
qualification of sub rack, all the<br />
PCBs have qualified <strong>for</strong> signal<br />
integrity, cross talk and EMI<br />
using Hyperlinx software and<br />
<strong>for</strong> thermal qualification;<br />
thermal analysis was done<br />
using Beta-soft software. The<br />
19" Sub rack which houses all<br />
the PCBs is also designed to<br />
qualify the above. Industrial<br />
version PCSL system (Fig.1) was<br />
implemented in a 19" rack of<br />
48U height. General<br />
arrangement of the system has<br />
been made to qualify the whole<br />
system <strong>for</strong> EMI/EMC and<br />
environmental qualification.<br />
V.C.3. Reliability Analysis of Safety Critical I & C<br />
Systems of PFBR<br />
PFBR contains many Safety<br />
Critical Systems like, Safety<br />
Logic Systems (Safety Logic with<br />
Fine Impulse Test <strong>for</strong> Shutdown<br />
system 1, Pulse Coded Safety<br />
Logic System <strong>for</strong> Shutdown<br />
system 2), Core Temperature<br />
Monitoring System, etc. <strong>Atomic</strong><br />
Energy Regulatory Board<br />
specifies target <strong>for</strong> the Safety<br />
Critical System. The probability<br />
of failure on demand of the<br />
system should be less than the<br />
target. During the design of a<br />
safety critical system, reliability<br />
target of the system will be<br />
considered among other<br />
requirements.<br />
The Instrumentations &<br />
Control systems important <strong>for</strong><br />
safety can be broadly classified<br />
into two categories, viz. i)<br />
Safety-Critical systems and ii)<br />
Safety-Related systems. The<br />
Safety Critical systems <strong>for</strong>m the<br />
second layer of defense and<br />
are provided to assure safe<br />
shutdown of the reactor,<br />
removal of heat from the<br />
reactor core during any<br />
deviation from normal<br />
operation and containment of<br />
radioactivity during accident<br />
conditions. The Safety Critical<br />
systems, <strong>for</strong> example, Core<br />
Temperature Monitoring<br />
system, require a very high<br />
reliability.<br />
Various reliability analysis<br />
techniques like Failure Modes<br />
and Effects Analysis (FMEA),<br />
Fault Tree analysis (FTA), Event<br />
Tree Analysis are per<strong>for</strong>med as<br />
a part of Probabilistic Risk<br />
Assessment. Relex Software,<br />
shown in Fig.1, is popularly<br />
used to per<strong>for</strong>m these analyses.<br />
FMEA is a bottom up approach<br />
where the failures of each<br />
component of the system are<br />
identified along with their<br />
modes of failures. Effects of<br />
those failure modes on the<br />
ENABLING TECHNOLOGIES 129
IGC<br />
<strong>Annual</strong> <strong>Report</strong> 2007<br />
system are analyzed. Fault Tree<br />
Analysis, shown in Fig.2, is a<br />
Top down approach, where the<br />
failure of system in a particular<br />
mode is taken as top event and<br />
the causes of that failure along<br />
with the interrelation between<br />
the causes are analyzed until<br />
we reach the basic causes.<br />
Apart from these qualitative<br />
methods there are many<br />
quantitative reliability analysis<br />
methods used to compare<br />
different topologies, and<br />
evaluate the probability of<br />
failure on demand.<br />
Calculation of Failure rate<br />
<strong>for</strong>ms the basis <strong>for</strong> Quantitative<br />
reliability analysis. For<br />
electronic components, US MIL<br />
217-F Notice-2 standard<br />
provides empirical <strong>for</strong>mulae to<br />
find out the failure rate.<br />
Reliability prediction of<br />
electronic components is done<br />
by Parts Stress Method or Parts<br />
Count Method. In case, <strong>for</strong> any<br />
component, if the failure rate is<br />
not available, failure rate data<br />
given by the manufacturer is<br />
used in the calculations. While<br />
arriving at the failure rate, the<br />
derating of the component,<br />
quality level, temperature and<br />
intended environment are taken<br />
into consideration.<br />
IEC 61508 provides<br />
guidelines <strong>for</strong> the determination<br />
of probability of unsafe state of<br />
the system. Using these<br />
guidelines, the probability of<br />
unsafe state can be calculated<br />
at different conditions.<br />
Verification and Validation of<br />
the Software and Hardware<br />
should be done to verify<br />
Fig.1 Example Fault Tree model<br />
whether the system is matching<br />
the requirements or not.<br />
The reliability analysis of<br />
Safety Logic Systems and Core<br />
Temperature Monitoring system<br />
proved the safety of the system<br />
theoretically. The results are<br />
used as inputs in the Level 1<br />
Probabilistic Safety Assessment<br />
of PFBR.<br />
V.C.4. Safety Logic with Fine Impulse Test<br />
System <strong>for</strong> PFBR<br />
PFBR is provided with two<br />
independent, fast acting and<br />
diverse shutdown systems<br />
namely SDS-1 & SDS-2 to<br />
detect any abnormalities in<br />
reactor core and to initiate<br />
safety action. Each system<br />
consists of sensors, signalprocessing<br />
systems, logic<br />
systems, drive mechanisms and<br />
absorber rods. The absorber<br />
rods of the first system are<br />
Control and Safety Rods (CSR)<br />
and that of the second are<br />
called as Diverse Safety Rods<br />
(DSR). There are nine CSR and<br />
three DSR. While CSR are used<br />
<strong>for</strong> startup, control of reactor<br />
power, controlled shutdown<br />
and SCRAM, the DSR are used<br />
only <strong>for</strong> SCRAM. The<br />
respective drive mechanisms<br />
are called as CSRDM &<br />
DSRDM. For SDS-1, Safety<br />
Logic with Fine Impulse Test<br />
(SLFIT) System is provided<br />
whereas <strong>for</strong> SDS-2, Pulse<br />
Coded Safety Logic (PCSL)<br />
System is provided.<br />
SLFIT system receives trip<br />
parameters from neutron flux<br />
monitoring, failed fuel<br />
detection, sodium flow<br />
monitoring, reactor inlet<br />
temperature monitoring systems<br />
130 ENABLING TECHNOLOGIES
IGC<br />
<strong>Annual</strong> <strong>Report</strong> 2007<br />
and per<strong>for</strong>ms logical<br />
operations to drive Electro-<br />
Magnet (EM) coils of Control &<br />
Safety Rods (CSRs). SLFIT<br />
system de-energizes the EM-<br />
Coils whenever a trip<br />
parameter crosses its threshold<br />
limits or there is a demand <strong>for</strong><br />
reactor shut down. The trip<br />
parameters are triplicated in<br />
nature i.e. Triple Modular<br />
Redundancy (TMR) concept is<br />
employed to achieve high<br />
reliability and availability. Being<br />
a safety critical system, features<br />
like Design Diversity,<br />
Independence, Isolation, High<br />
Reliability and Testability have<br />
been incorporated in the<br />
design and implementation of<br />
SLFIT System [Fig. 1 & 2].<br />
breaks or shorts in connecting<br />
paths on a circuit board, and<br />
other physical problems. ICs<br />
have also drastically reduced<br />
the amount of electrical power<br />
needed to per<strong>for</strong>m a given<br />
function.<br />
SLFIT system is built using<br />
VLSI technique. The digital<br />
logic circuits <strong>for</strong> the SLFIT<br />
System have been implemented<br />
using Very High Speed<br />
Integrated Circuits (VHSIC)<br />
Hardware Description<br />
Language (VHDL) and the<br />
designs are fused in to One-<br />
Time-Programmable (OTP)<br />
Field Programmable Gate Array<br />
(FPGA) Devices, which are<br />
based on anti-fuse technology.<br />
The EM-Coil drive circuit is<br />
built using Insulated Gate<br />
Bipolar Transistors (IGBTs).<br />
The probable faults in Digital<br />
ICs is stuck-at fault, which<br />
implies the fault effect to be a<br />
line segment stuck at logic 0 or<br />
1 (i.e. stuck-at 0 or stuck-at 1).<br />
The main building blocks <strong>for</strong><br />
SLFIT System are Signal<br />
Conditioning Circuits, 2/3-<br />
Logic Circuits, Grouping Logic<br />
Circuits, Timer & Latching<br />
Circuit, FIT Logic Circuit, FIT<br />
Logic (Diagnostics) Circuit and<br />
EM-Coil Drive Circuit.<br />
Due to the tremendous<br />
growth in Very Large Scale<br />
Integration (VLSI) technology,<br />
Integrated Circuits (ICs) have<br />
made digital systems more<br />
reliable by reducing the number<br />
of external interconnections<br />
from one device to another. In<br />
ICs the connections are internal<br />
to the ICs, where they are<br />
protected from poor soldering,<br />
Fig.1 Front view of the SLFIT system<br />
Fig.2 Rear view of the SLFIT system<br />
ENABLING TECHNOLOGIES 131
IGC<br />
<strong>Annual</strong> <strong>Report</strong> 2007<br />
For SLFIT System, stuck-at 1 is<br />
an unsafe fault, which needs to<br />
be detected on-line in a<br />
minimum possible time. To<br />
prevent Safety Logic System<br />
failing in unsafe mode, an online<br />
test facility i.e. Fine Impulse<br />
Test (FIT) logic is provided. FIT<br />
Logic monitors the health of<br />
Safety Logic System on-line and<br />
detects safe and unsafe<br />
failures. FIT logic injects short<br />
duration (1 ms) trip pulses<br />
periodically at the input of<br />
Safety Logic in required<br />
combinations and verifies the<br />
propagation of these pulses at<br />
the output of Safety Logic<br />
System. Each parameter is<br />
tested with a periodicity of 3<br />
minutes. Whenever a fault is<br />
detected, the in<strong>for</strong>mation is<br />
sent to the Control Room (CR)<br />
<strong>for</strong> further action.<br />
SLFIT system shall remain<br />
functional even under stringent<br />
environmental conditions.<br />
Hence, the system will be<br />
subjected to Electro Magnetic<br />
Interference (EMI) / Electro<br />
Magnetic Compatibility (EMC),<br />
Environmental and Seismic<br />
qualifications. Industrial<br />
Prototype of SLFIT System has<br />
been fabricated and testing is<br />
under progress.<br />
V.C.5. Development and Commissioning of Pulse Shape<br />
Discrimination Electronics <strong>for</strong> Phoswich Detector System<br />
Phoswich detectors [Thin<br />
NaI(Tl) + Thick CsI] are<br />
generally used <strong>for</strong> measuring X-<br />
ray or low energy gamma<br />
emitting radionuclide<br />
contamination in lungs. In<br />
phoswich detectors the<br />
interference due to high energy<br />
(HE) scatter component in low<br />
energy (LE) region is reduced<br />
using different schemes of pulse<br />
shape discrimination (PSD)<br />
electronics. The PSD electronics<br />
utilizes the difference in the<br />
decay time characteristics of<br />
two phosphors to discriminate<br />
the interactions of HE and LE<br />
photons. Previously a custom<br />
built electronics with discrete<br />
components was being used,<br />
which has suffered frequent<br />
failure of components, thereby<br />
resulting in poor per<strong>for</strong>mance<br />
and timing resolution. The new<br />
PSD electronics is configured<br />
using readily available nuclear<br />
electronic modules, which<br />
makes it convenient to replace<br />
any of the modules <strong>for</strong> easy<br />
maintenance.<br />
The phoswich is of SCIONIX<br />
make having 203 mm dia, 3<br />
Fig.1 Phoswich system electronics with typical signal details<br />
132 ENABLING TECHNOLOGIES
IGC<br />
<strong>Annual</strong> <strong>Report</strong> 2007<br />
Fig.2 Timing spectrum<br />
mm thick NaI(Tl) crystal<br />
coupled with 203 mm, 50 mm<br />
CsI(Tl) crystal and optically<br />
coupled to three matched 3"<br />
dia photomultiplier tubes (ETL<br />
9255). The detector has an<br />
ultra low background 0.5 mm<br />
thick beryllium entrance<br />
window. The new PSD, based<br />
on scintillation time<br />
comparison, uses the rise time<br />
difference in the signals of<br />
NaI(Tl) (250 ns) and CsI(Tl)<br />
(1100 ns) to produce a gating<br />
pulse to selectively choose the<br />
pulses due to LE photon<br />
interactions in NaI(Tl) alone.<br />
The schematic of the PSD<br />
electronics with typical signals<br />
is shown in Fig.1.<br />
The Pulse Shape Analyser<br />
(PSA), analyses the input pulses<br />
and generates two negative<br />
pulses, one at 90% peak<br />
amplitude labeled as "A" and<br />
another at selected fraction (B)<br />
of the peak amplitude labeled<br />
as "B". The outputs "A" and "B"<br />
from PSA are fed to the inputs<br />
of Time to Amplitude Converter<br />
(TAC) as "Start" and "Stop"<br />
pulses, respectively. This results<br />
in TAC unit generating a square<br />
pulse whose amplitude is<br />
proportional to the time<br />
difference between A & B.<br />
Hence, the LE photon<br />
interaction from NaI(Tl)<br />
generates pulses with lower<br />
amplitudes compared to the<br />
pulses from CsI(Tl). Once the<br />
amplitude of TAC pulses<br />
corresponding to NaI(Tl) or CsI<br />
is known, any of them can be<br />
selected <strong>for</strong> gating by using a<br />
SCA with properly selected LLD<br />
& ULD.<br />
Processing of pulses <strong>for</strong><br />
risetime analysis results a time<br />
delay in generating gate pulse.<br />
Typical time delay is observed<br />
to be 3.75 µs <strong>for</strong> NaI(Tl) pulses<br />
and 5.75 µs <strong>for</strong> CsI pulses.<br />
Every bipolar pulse from delay<br />
line amplifier is precisely<br />
delayed and then presented to<br />
MCA <strong>for</strong> analysis. One of the<br />
inputs of MCA coincidence<br />
circuit is the delayed pulse from<br />
delay amplifier and the other<br />
input is the gating pulse from<br />
the SCA. The input pulses to the<br />
delay amplifier are accepted<br />
<strong>for</strong> spectrum analysis only when<br />
the gating pulses occur<br />
simultaneously. This results in<br />
rejection of most of the<br />
unwanted high energy<br />
interactions, which will have a<br />
time characteristic of CsI(Tl)<br />
detector, thereby reducing the<br />
background considerably.<br />
The timing spectrum obtained<br />
with 137Cs source, with<br />
optimized PSD parameters, is<br />
shown in Fig.2. The figure of<br />
merit (M) <strong>for</strong> the obtained<br />
timing spectrum is estimated to<br />
be 3.0.<br />
Comparison of the peak<br />
position and the FWHM values<br />
obtained <strong>for</strong> 17 keV, 60 keV<br />
and 122 keV with and without<br />
PSD electronics clearly shows<br />
that PSD has not affected<br />
spectrum parameters. In order<br />
to quantitatively estimate the<br />
background reduction, spectra<br />
were obtained with and without<br />
PSD (Figure-3). The inclusion of<br />
PSD electronics has reduced<br />
the background from 9.5 cps to<br />
0.28 cps in 17 keV region and<br />
5.8 cps to 0.3 cps in 60 keV<br />
region. This results in an<br />
improvement in the MDA values<br />
by a factor of 2.<br />
A state of art pulse shape<br />
discriminator employing readily<br />
available nuclear electronics<br />
Fig.3 Background reduction with<br />
PSD electronics<br />
ENABLING TECHNOLOGIES 133
IGC<br />
<strong>Annual</strong> <strong>Report</strong> 2007<br />
modules was configured and<br />
optimized <strong>for</strong> using with<br />
phoswich based plutonium lung<br />
monitor. The PSD electronics<br />
has not altered any of the<br />
spectrum parameters like shape<br />
of spectrum, peak position and<br />
FWHM. The figure of merit<br />
obtained <strong>for</strong> the timing<br />
spectrum is 3.0. The<br />
background reduction obtained<br />
is 97% with PSD and with a<br />
signal loss of only 4%. This<br />
effective background reduction<br />
improves the MDA values by<br />
factor 2.<br />
V.C.6. Digital Design Verification<br />
For safety systems of nuclear<br />
reactors, electronic hardware<br />
systems are preferred to<br />
software systems wherever<br />
feasible. This is so because, <strong>for</strong><br />
software, terms like reliability<br />
and quality are difficult to<br />
quantify. EID has designed and<br />
developed a number of<br />
complex digital circuits using<br />
Very Large Scale Integration<br />
(VLSI) techniques <strong>for</strong> the Safety<br />
Systems of PFBR. These designs<br />
have been implemented using<br />
Very High Speed Integrated<br />
Circuit (VHSIC) Hardware<br />
Description Language (VHDL).<br />
These circuits have been tested<br />
extensively and found to<br />
function well. But here, since<br />
the hardware design was also<br />
done using a HDL, it was<br />
thought necessary to per<strong>for</strong>m<br />
extensive verification of the<br />
HDL code used in the design.<br />
There<strong>for</strong>e, a collaboration<br />
project was undertaken with<br />
Indian Institute of Technology,<br />
Madras (IIT-M) <strong>for</strong> the<br />
development of generic tools<br />
<strong>for</strong> the verification of VLSI<br />
designs made at centre. As part<br />
of the project, six VHDL designs<br />
were taken up <strong>for</strong> verification.<br />
The first phase included<br />
preparation of detailed design<br />
specifications, finalizing the test<br />
plans and providing other<br />
required inputs to the IIT-M<br />
team. For each design, a test<br />
plan was first prepared. After a<br />
few iterations to ensure that the<br />
test plan would really cover all<br />
the areas that need to be<br />
tested, it was approved by the<br />
<strong>IGCAR</strong> team. Following this<br />
was the design verification<br />
phase.<br />
The verification of the designs<br />
was per<strong>for</strong>med using e<br />
verification language in<br />
Specman Elite environment.<br />
The various components of the<br />
environment are shown in<br />
Fig.1.The`e ’verification<br />
Language can be used to<br />
construct components to do the<br />
following functions.<br />
Generation: e automates the<br />
generation of stimuli based on<br />
the constraints provided.<br />
Driving stimulus: e provides a<br />
simulator interface and the<br />
necessary mechanism to drive<br />
the generated test vectors into<br />
the DUT.<br />
Collecting output: After the<br />
stimulus is applied to the DUT,<br />
output is produced from the<br />
DUT. e provides a simulator<br />
interface and the necessary<br />
mechanism to receive data<br />
from the DUT<br />
Data checking: Data value<br />
checks compare the output<br />
data values against the<br />
expected data. Temporal<br />
assertions monitor the<br />
functional protocol at important<br />
interfaces. Temporal checking<br />
constructs are used to build<br />
protocol monitors.<br />
Coverage: Functional<br />
coverage tells the verification<br />
engineer if the test plan goals<br />
have been met.<br />
134 ENABLING TECHNOLOGIES
IGC<br />
<strong>Annual</strong> <strong>Report</strong> 2007<br />
Fig.1 Components of the verification environment<br />
Verification has been language significantly reduces<br />
completed <strong>for</strong> all the six the time needed to create a<br />
designs. The e verification verification environment and<br />
test suite, as well as enables the<br />
most modern and powerful<br />
verification methodologies.<br />
Using a high-level verification<br />
language that is combined with<br />
the built-in engines of a<br />
testbench automation tool, a<br />
project team can be more<br />
productive much sooner in the<br />
project schedule, thus reduce<br />
the time and resources needed<br />
<strong>for</strong> the verification environment<br />
and significantly increase the<br />
quality of the final product.<br />
V.C.7. Distributed Operator In<strong>for</strong>mation System <strong>for</strong><br />
Augmented Boron Enrichment Plant<br />
Fast Reactors require<br />
enriched 10B <strong>for</strong> control and<br />
shutdown rods and also <strong>for</strong><br />
detectors. Hence an ABEP has<br />
been designed and<br />
commissioned at <strong>IGCAR</strong>. The<br />
enrichment is based on Ion<br />
Exchange Chromatography<br />
Technique which requires<br />
accurate monitoring of process<br />
parameters such as pH,<br />
conductivity, level, flow etc. A<br />
computer based Operator<br />
In<strong>for</strong>mation System (OIS) with<br />
analysis package has been<br />
implemented by EID and the<br />
salient features of the system<br />
are described here.<br />
monitor all the plant<br />
parameters, track the progress<br />
of the process and store data<br />
<strong>for</strong> further analysis of the<br />
process.<br />
Features of OIS<br />
OIS scans 180 digital and 50<br />
analog signals at the interval of<br />
1Sec and 10 Sec respectively.<br />
Different <strong>for</strong>ms of displays are<br />
provided as mimic, bar chart,<br />
trend chart, alarm overview<br />
panel, Tabular, digital and<br />
summary of all signals. These<br />
displays are regrouped<br />
Operator in<strong>for</strong>mation system<br />
(OIS)<br />
The purpose of the OIS is to<br />
Fig.1 Architecture diagram of OIS<br />
ENABLING TECHNOLOGIES 135
IGC<br />
<strong>Annual</strong> <strong>Report</strong> 2007<br />
Fig.2 Photograph of the DAS<br />
dynamically as per the user<br />
needs. All the Input /Output<br />
cards and network are<br />
configurable. One year data<br />
and events are stored with<br />
mirroring <strong>for</strong> archival and<br />
retrieval. Hard copy of current<br />
alarm signals, events and all<br />
displays are provided. On line<br />
help is available <strong>for</strong> overall<br />
guidance.<br />
fiber optic Ethernet Local Area<br />
Network (LAN) with TCP.<br />
Network printer is used <strong>for</strong><br />
printing the alarm signals,<br />
events and displays. A<br />
dedicated printer is also<br />
provided <strong>for</strong> printing the events<br />
as and when they occur.<br />
DAS consists of in-house<br />
designed and developed<br />
68020 based CPU card,<br />
analog & digital input cards as<br />
in Fig. 2.<br />
Software<br />
The complete software of the<br />
OIS consists of four modules as<br />
follows.<br />
Embedded Software<br />
Communication<br />
Software<br />
Data management with<br />
storage and retrieval<br />
Data Presentation with<br />
Human Machine<br />
Interface (HMI)<br />
Embedded software which is<br />
running in DAS is written as per<br />
MISRA C guidelines and fused<br />
in EPROM. The main functions<br />
of DAS are scanning the input<br />
signals at regular intervals,<br />
packet <strong>for</strong>mation, sending the<br />
packets to all PDS connected in<br />
the LAN and configuring the<br />
I.O and network cards.<br />
Communication software<br />
provides communication<br />
between DAS and PDS by TCP.<br />
Data management module<br />
receives and validates the data<br />
and then processes the data to<br />
engineering unit. One-year<br />
data and events are stored with<br />
mirroring <strong>for</strong> fault tolerance<br />
which is used <strong>for</strong> analysis.<br />
Architecture of OIS<br />
The architecture of the OIS is<br />
shown in Fig 1.It is a physically<br />
and logically distributed system<br />
with real time computer, based<br />
on VME bus <strong>for</strong> data<br />
acquisition and PC based<br />
systems called as Process<br />
Display Stations (PDS) <strong>for</strong><br />
display as well as storage. Data<br />
Acquisition System (DAS) is<br />
located in local control room<br />
whereas PDS are located in the<br />
main control room and all the<br />
systems are interconnected by<br />
Fig.3 Mimic diagram<br />
136 ENABLING TECHNOLOGIES
IGC<br />
<strong>Annual</strong> <strong>Report</strong> 2007<br />
Security of OIS<br />
Only OIS application<br />
software will be running in PDS<br />
and all other applications are<br />
blocked. Password is provided<br />
<strong>for</strong> configuration, regrouping<br />
and to exit the application.<br />
Fig.4 Different <strong>for</strong>ms of displays<br />
Data presentation module<br />
provides HMI which has the<br />
following functions<br />
On-line Help<br />
Fig. 3 shows the typical mimic<br />
Display data in different diagram <strong>for</strong> high pressure<br />
<strong>for</strong>mats as shown in Fig. 3<br />
and Fig. 4<br />
stream. pH and Conductivity<br />
values are displayed as text <strong>for</strong><br />
Dynamic Regrouping<br />
each ion exchange columns.<br />
Diagnostics<br />
Text color indicates the status of<br />
Hard copy on demand the signal.<br />
Documentation & User Training<br />
A one day training<br />
programme on the I&C system<br />
was conducted <strong>for</strong> the benefit<br />
of the concern staff. Hardcopy<br />
and softcopy of all the<br />
documents and source code<br />
were handed over. Hands on<br />
training was given to all the<br />
users about the system in<br />
interactive manner. Hardware &<br />
software of the system were<br />
explained in detail. OIS <strong>for</strong><br />
ABEP has been installed,<br />
commissioned, & found to be<br />
working satisfactorily.<br />
V.C.8. An Intelligent Titrator <strong>for</strong> Quick Chemical<br />
Assay of Process Solutions<br />
Any service or quality control<br />
laboratory attached to a<br />
chemical plant or a dedicated<br />
facility, conventional or<br />
radiochemical, has to often<br />
carry out analyses of a few<br />
chemical species routinely at<br />
frequent intervals round-theclock<br />
following the same<br />
methodologies. Results provide<br />
in<strong>for</strong>mation with respect to<br />
variations in process<br />
parameters. Simplicity,<br />
reliability, speed, per<strong>for</strong>mance,<br />
remote adaptability and<br />
operator friendliness are the<br />
guiding factors behind choice<br />
of appropriate techniques and<br />
instruments <strong>for</strong> analytical work.<br />
An inexpensive but high<br />
per<strong>for</strong>ming and intelligent<br />
titrator from the Innovative<br />
Instrumentation Section, the<br />
laboratory creation of which<br />
based on the in-house<br />
developed pulsating type<br />
sensing devices, described in<br />
this article, can be the kind of<br />
instrument of choice <strong>for</strong> a set of<br />
chemical species which are<br />
ENABLING TECHNOLOGIES 137
IGC<br />
<strong>Annual</strong> <strong>Report</strong> 2007<br />
amenable <strong>for</strong> assay<br />
either by conductometric or<br />
potentiometric or by pH<br />
titrations. Miniature rapid<br />
titration units developed earlier<br />
with pulsating sensors were<br />
based on discrete addition of<br />
titrating solutions either in the<br />
<strong>for</strong>m of tiny droplets or through<br />
addition in small volume steps.<br />
These are general purpose and<br />
are being used extensively <strong>for</strong><br />
chemical characterisation in<br />
solutions through titrations<br />
involving acid-base, REDOX,<br />
complex <strong>for</strong>ming, precipitation,<br />
or exothermic/endothermic<br />
reactions <strong>for</strong> research and<br />
Fig.1 Schematic representation of a laboratory version<br />
of an intelligent titrator<br />
analytical work. The present<br />
development is targeted to<br />
meet repetitive analytical needs<br />
in industrial settings as<br />
mentioned<br />
above.<br />
The set up is shown<br />
schematically in Fig.1. An<br />
immiscible hydrocarbon liquid<br />
layer of fixed volume floats over<br />
an aqueous solution of the<br />
desired titrating agent on the<br />
right arm of a U-tube. The<br />
titrating solution is dispensed<br />
continuously under gravity at a<br />
flow rate of about 50 micro<br />
liters per second into the<br />
solution to be titrated through a<br />
needle when the normally<br />
closed solenoid valve is made<br />
to open. A laboratory made<br />
pulsating level sensor follows<br />
on-line the extent of volume<br />
dispensed as a function of time<br />
in one channel. The progress of<br />
reaction is monitored in<br />
another channel by making use<br />
of an appropriate pulsating<br />
sensor <strong>for</strong> conductometric or<br />
potentiometric or pH titration.<br />
The trains of digital pulses from<br />
the level and reaction<br />
monitoring sensors are fed to a<br />
PC via a laboratory made<br />
hardware interface <strong>for</strong> power<br />
supply, signal routing and<br />
control of the solenoid valves.<br />
The in-house developed<br />
software per<strong>for</strong>ms the following<br />
operations: (i) solenoid valve<br />
control, (ii) pulse counting <strong>for</strong><br />
frequency determination with<br />
138 ENABLING TECHNOLOGIES
IGC<br />
<strong>Annual</strong> <strong>Report</strong> 2007<br />
derivation of parameter values<br />
using the pre-established<br />
calibration relationships, (iii)<br />
real time graphic display of<br />
volume dispensed and progress<br />
of reaction in time domain till<br />
termination, (iv) unfolding of<br />
data in volume domain at the<br />
close, and (v) display of the<br />
titration plot with numerically<br />
fitted regions be<strong>for</strong>e and after<br />
the end point which is<br />
automatically derived from the<br />
intersections<br />
<strong>for</strong><br />
conductometric titrations, or<br />
display of titration plot with first<br />
derivative <strong>for</strong> locating the end<br />
point <strong>for</strong> potentiometric and pH<br />
titrations . A reservoir of<br />
titrating solution is placed<br />
above with another solenoid<br />
valve which automatically<br />
opens at the beginning of the<br />
next titration to fill the aqueous<br />
solution in the left arm up to a<br />
preset level be<strong>for</strong>e<br />
commencement of the fresh<br />
titration. The unit has also a<br />
built in feature <strong>for</strong> protection<br />
against drainage and overflow<br />
of liquid.<br />
screen captures are the titration<br />
plots <strong>for</strong> a typical REDOX and a<br />
pH titration respectively.<br />
Any titration can be<br />
completed with generation of<br />
reportable data in less than five<br />
minutes with this intelligent<br />
unit, and it is ready <strong>for</strong> next<br />
titration with the same titrating<br />
solution immediately. Thus it<br />
makes the job of repetitive<br />
analysis easy with minimum<br />
strain on the operator. The unit<br />
can also be used in batch mode<br />
<strong>for</strong> assay of different chemicals<br />
when each batch is specific <strong>for</strong><br />
a given chemical species. It<br />
takes maximum of about half<br />
an hour <strong>for</strong> setting up the same<br />
unit <strong>for</strong> titrations requiring a<br />
different titrating agent <strong>for</strong> a<br />
different batch, permitting<br />
multiple chemical species assay<br />
with one unit only, if necessary.<br />
However, when the need <strong>for</strong><br />
analysis is too frequent and<br />
urgent <strong>for</strong> a given chemical<br />
species, such a unit can be a<br />
dedicated one <strong>for</strong> that<br />
particular requirement.<br />
Partial screen views of three<br />
typical titrations carried out<br />
with this laboratory set up are<br />
shown together in Fig. 2. The<br />
first one is <strong>for</strong> determination of<br />
chloride in service water by<br />
conductometric titration<br />
following the precipitation<br />
reaction with dilute AgNO 3<br />
solution. The second and third<br />
Fig.2 Typical examples of displayed titration plots <strong>for</strong> different titrations<br />
in dilute solutions: I. Cl - Vs. A g NO 3 by conductometric titration;<br />
II. Fe +2 vs. Ce +4 by potentiometric titration; and III. An<br />
acid-base reaction by pH titration.<br />
ENABLING TECHNOLOGIES 139
IGC<br />
<strong>Annual</strong> <strong>Report</strong> 2007<br />
V.C.9. Wireless Signal Transmission from<br />
Pulsating Sensors<br />
The pulsating sensors, have<br />
several attractive features <strong>for</strong><br />
deployment besides their high<br />
per<strong>for</strong>mance. One such aspect<br />
is their adaptability in a simple<br />
way <strong>for</strong> pulse-by-pulse wireless<br />
transmission of primary signals<br />
in the <strong>for</strong>m of trains of digital<br />
pulses from the sensors to data<br />
receiving stations located<br />
elsewhere in a building or in<br />
fields. In-house development of<br />
appropriate<br />
wireless<br />
transmission and reception<br />
modules in support of the<br />
pulsating sensors is described<br />
here.<br />
The transmission and<br />
reception modules are<br />
designed in such a manner that<br />
the pulsed signal output<br />
profiles be<strong>for</strong>e transmission are<br />
practically reproduced during<br />
reception as if the signals were<br />
received by wired means,<br />
thereby making them<br />
indistinguishable <strong>for</strong> the<br />
subsequent signal handling and<br />
data processing systems which<br />
were earlier developed <strong>for</strong><br />
direct use. Transmission and<br />
receiver modules make use of<br />
available low power consuming<br />
5 V DC driven modulation and<br />
demodulation chips, enabling<br />
transmission on a carrier<br />
frequency of about 433 MHz<br />
falling under ISM band <strong>for</strong> use<br />
in industrial, scientific and<br />
medical applications.<br />
The developments have been<br />
made <strong>for</strong> two types of uses: (i)<br />
mains/battery operated<br />
transmitter - receiver pair <strong>for</strong><br />
use with one sensor at a time,<br />
usable fully <strong>for</strong> field<br />
applications, and (ii) transmitter<br />
- receiver pair <strong>for</strong> simultaneous<br />
use with seven pulsating<br />
sensors by time division<br />
multiplexing, mainly <strong>for</strong> use<br />
within a building. In the second<br />
type, the tasks of pulse<br />
counting, data processing and<br />
presentation are carried out at<br />
a signal receiving location by a<br />
PC, feeding output signals from<br />
the receiver directly through the<br />
parallel port. The block<br />
diagram of the transmitter and<br />
receiver modules made in the<br />
laboratory is given in Fig.1.<br />
Modules were made and<br />
tested with highly satisfactory<br />
results. Fig.2 shows seven<br />
different sensors which sense<br />
diverse parameters namely<br />
conductivity (in ch-2), chemical<br />
emf (in ch-3), pH (in ch-4),<br />
temperature (in ch-5) levels of<br />
a non-aqueous and aqueous<br />
liquids (in ch-6 and ch-7) and<br />
differential pressure (in ch-8),<br />
are connected to the transmitter<br />
module in one room. The<br />
transmitted pulsed signals are<br />
received in another location a<br />
few rooms apart. Signals are<br />
being processed and data are<br />
displayed in real time as<br />
histograms as well as in time<br />
dependent plots <strong>for</strong> all the eight<br />
Fig.1 Block diagram of the<br />
wireless transmitter and<br />
receiver modules <strong>for</strong><br />
simultaneous use with seven<br />
different pulsating sensors.<br />
140 ENABLING TECHNOLOGIES
IGC<br />
<strong>Annual</strong> <strong>Report</strong> 2007<br />
channels. Reference pulse<br />
frequency in ch-1 serves to<br />
assess the quality of<br />
transmission and also used as<br />
the marker <strong>for</strong> beginning and<br />
end of repetitive sequential<br />
transmission-reception cycles.<br />
Sensors were subjected to<br />
changes in respective<br />
parameters being sensed. Data<br />
received by wireless<br />
transmission (Fig.3) reflected<br />
the same profiles as imposed<br />
on each sensor at the source.<br />
Fig.2 Wireless transmission and reception of digital pulse signals from seven<br />
pulsating sensors within a building between two rooms.<br />
Fig.3 Profiles of different parameters as recorded in another room after<br />
wireless reception from seven pulsating sensors which were subjected to<br />
changes in respective parameters being sensed at the transmission end.<br />
A methodology <strong>for</strong> direct<br />
wireless transmission of signals<br />
from pulsating sensors has thus<br />
been demonstrated to work<br />
simultaneously with seven<br />
sensors using only one<br />
unidirectional communication.<br />
The low power transmission<br />
modules worked very well<br />
within a building and outside.<br />
The Ethernet enabled standalone<br />
embedded processors,<br />
already developed <strong>for</strong> the<br />
pulsating sensors, permit<br />
connectivity <strong>for</strong> on-line viewing<br />
and recording of data<br />
anywhere within the <strong>IGCAR</strong><br />
Intranet. The wireless feature<br />
will extend the above feature of<br />
wide connectivity <strong>for</strong> sensing<br />
and measurement by pulsating<br />
sensors in locations away from<br />
LAN access points such as<br />
within fume hoods or glove<br />
boxes or outside building<br />
premises.<br />
ENABLING TECHNOLOGIES 141
IGC<br />
<strong>Annual</strong> <strong>Report</strong> 2007<br />
V.C.10. Single Chip Embedded Experimental<br />
Automation Design<br />
An inexpensive embedded<br />
automation design <strong>for</strong> Raman<br />
spectrometer system shown in<br />
Fig.1, has built with a single<br />
Programmable System On-<br />
Chip (PSoC), a Cypress Micro<br />
System's mixed array<br />
microcontroller. This<br />
automation system allows the<br />
on-line acquisition of<br />
spectroscopic data and the<br />
control of the experimental<br />
setup operation, using PC as a<br />
window based graphical user<br />
interface (GUI). The menu<br />
driven user-friendly software in<br />
virtual instrument (VI) control<br />
program written in LabVIEW<br />
ver.7.1, a graphical language,<br />
interacts with the embedded<br />
single chip design <strong>for</strong> the total<br />
automation of the experiment.<br />
The user friendly menu driven<br />
virtual instrument program<br />
interacts with the embedded<br />
PSoC design through its USBserial<br />
interface.<br />
Fig.2 shows the front panel of<br />
the PSoC based menu driven<br />
user-friendly virtual instrument<br />
program with a acquired<br />
Raman spectrum in zinc<br />
cyanide, Zr(CN) 2 acquired in<br />
the range of 2200 cm -1 to 2240<br />
cm -1 <strong>for</strong> a preset time of 5<br />
seconds in steps of 0.5 cm -1 .<br />
The menu driven GUI program<br />
has the facilities like (i) storing<br />
the data in the user specified<br />
file path, (ii) loading the<br />
previous spectrum <strong>for</strong>m the<br />
user file path, (iii) automatically<br />
configure the initial, final and<br />
step wave number on the graph<br />
immediately after the user entry,<br />
(iv) print spectrum, (v) clear<br />
spectrum and (vi) functioning<br />
Fig.1 Block diagram of raman spectrometer experimental automation setup.<br />
142 ENABLING TECHNOLOGIES
IGC<br />
<strong>Annual</strong> <strong>Report</strong> 2007<br />
Fig.2 Virtual instrument program panel diagram <strong>for</strong> PSoC -Raman spectrometer automation design.<br />
as a rate meter <strong>for</strong> initial setting<br />
up of the laser intensity, slit<br />
widths, etc, in the spectrometer.<br />
The panel diagram includes<br />
user variable parameters like<br />
sample name, laser power,<br />
wave length, slits in<strong>for</strong>mation<br />
as a user file <strong>for</strong> proper<br />
documentation of the<br />
experiment.<br />
In PSoC, the main advantage<br />
is, one can program the choice<br />
of user required function<br />
module: Using PSoC designer<br />
tool, a blank PSoC chip has<br />
been programmed to count the<br />
detector pulses <strong>for</strong> the user<br />
preset time and controls the<br />
monochromator motor drive to<br />
move to the next user required<br />
wave number position. The<br />
count pulses have been<br />
transferred to PC memory<br />
through serial port. A 16 bit<br />
counter and a timer has been<br />
designed within the PSoC chip<br />
<strong>for</strong> counting the detector pulses<br />
from Raman setup <strong>for</strong> the user<br />
defined preset time. Interrupt<br />
handler routine in PSoC editor<br />
program, enables wider range<br />
of counting above 64k and<br />
preset time from milli-seconds<br />
to several hours, but uses only<br />
16 bit counter/ timer functions,<br />
by using interrupts through<br />
PSoC editor program written in<br />
'C' compiler.<br />
This simple and cost effective<br />
embedded design automation<br />
of Raman spectrometer setup<br />
using a single Programmable<br />
System on Chip (PSoC),<br />
interfaced with PC and<br />
controlled by the virtual<br />
instrument program provides<br />
wider range of counting and<br />
preset time and works under<br />
window environment of PC.<br />
This design approach can also<br />
be extended to other<br />
automation requirements<br />
involving event counting<br />
applications.<br />
ENABLING TECHNOLOGIES 143
Chapter -6<br />
BASIC RESEARCH<br />
VI.1. Field-Induced Extinction of Light in a<br />
Magnetic Nanofluid<br />
A magnetically triggered extinction of light in a disordered magnetic medium, i.e., a<br />
colloidal suspension of Fe 3 O 4 nanoparticles, has been observed. In this system, the size<br />
parameter and the magnetic permeability of the scatterer is tuned by changing the applied<br />
magnetic field. Both the <strong>for</strong>ward and backward scattered light intensity as a function of<br />
applied magnetic field and the critical magnetic fields where both the <strong>for</strong>ward and backward<br />
scattered light intensities drop to zero are measured.<br />
A stable colloidal suspension of magnetite (Fe 3 O 4 ) nanoparticles of average diameter<br />
6.7nm, coated with oleic acid and dispersed in kerosene is used. The organic layer thickness<br />
around the particles is about 1.5nm. The experimental setup is shown in Fig.1. The ferrofluid
IGC<br />
<strong>Annual</strong> <strong>Report</strong> 2007<br />
sample is taken in a quartz<br />
cuvette and kept inside a<br />
solenoid, where magnetic field<br />
is varied by changing the<br />
current passing through its coil<br />
using a DC power supply. The<br />
direction of magnetic field is<br />
parallel to the wave<br />
propagation. An amplitude and<br />
frequency stabilized polarized<br />
He-Ne laser (Spectra-physics)<br />
of wavelength 632.8 nm with<br />
an output power of 1 mW is<br />
used as the light source. The<br />
light intensity is measured by<br />
using a photomultiplier tube<br />
(Oriel). The output of the PMT<br />
is fed to readout through a<br />
current amplifier with variable<br />
gain. The analog output from<br />
the readout is connected to a<br />
12 bit analog to digital<br />
converter (ADC) that is<br />
interfaced with a computer. For<br />
observation, the light scattered<br />
from the sample is projected on<br />
a screen and recorded using a<br />
CCD camera. The transmitted<br />
light intensity through the<br />
samples has been acquired as<br />
a function of external magnetic<br />
field.<br />
Fig.2 shows the transmitted<br />
intensity as a function of<br />
external field <strong>for</strong> different<br />
magnetite volume fractions.<br />
The intensity plotted was the<br />
ratio of the intensity transmitted<br />
through the sample with and<br />
without magnetic field. Here,<br />
at lower concentrations, the<br />
transmitted light intensity<br />
remains constant upto a critical<br />
magnetic field (H C1 , shown by<br />
the dotted arrow) and above<br />
which the intensity starts to<br />
decrease drastically. At another<br />
critical magnetic field H C2 ,<br />
shown by the solid arrow in Fig.<br />
2, the transmitted light intensity<br />
becomes a minimum. Above<br />
H C2 , the transmitted light<br />
intensity increases slowly. The<br />
<strong>for</strong>ward scattering patterns<br />
from a magnetite suspension of<br />
0.0067 volume fraction of<br />
Fe 3 O 4 at various magnetic<br />
fields are shown in Figure 3.<br />
Here, the transmitted light<br />
intensity drops to zero at a<br />
magnetic field strength of<br />
115Gauss, above which the<br />
<strong>for</strong>ward scattered light shows a<br />
diffused ring like structure i.e.<br />
when the applied magnetic<br />
field is above H C2 . The ring<br />
becomes sharper as the<br />
magnetic field strength<br />
increases further.<br />
It has been found that both<br />
H C1 and H C2 follow a power law<br />
decay with volume fraction<br />
(H C ∞φ -x ) where the exponents<br />
are 0.423 and 0.283<br />
respectively. Also, with<br />
increasing concentration, the<br />
slope of the transmitted<br />
intensity curve (between H C1<br />
and H C2 ) increases. Without<br />
any external magnetic field, the<br />
magnetic moments of the<br />
scatterers are oriented in<br />
random direction. With the<br />
increase in magnetic field, the<br />
moments of the magnetic<br />
particles start to align along<br />
the direction of the magnetic<br />
field. The lengths of the chains<br />
Fig.1 A schematic of the experimental set up. The direction of the applied magnetic field is along the<br />
direction of propagation of the beam. P-polarizer, SC-sample cuvette, S-solenoid, M-mirror,<br />
PMT-photomultiplier tube and IF-interference filter.<br />
BASIC RESEARCH 145
IGC<br />
<strong>Annual</strong> <strong>Report</strong> 2007<br />
increase with increasing<br />
magnetic field till the path<br />
length of the sample cell. As<br />
the magnetic field is increased,<br />
the size of scatterers increases<br />
due to the <strong>for</strong>mation of<br />
doublets, triplets or very small<br />
chains, which changes the<br />
scatterers size. At the<br />
minimum transmitted intensity,<br />
the size distribution is such that<br />
the number of scatterers that<br />
satisfy the resonance becomes<br />
maximum. Such resonances<br />
should lead to a build up of<br />
standing waves inside the<br />
magnetic scatterer and<br />
trapping of light.<br />
conclusion, experimental<br />
evidence has been provided <strong>for</strong><br />
a magnetically tunable<br />
localization of light in a<br />
Transmitted Intensity (a.u)<br />
1.4<br />
1.2<br />
1<br />
0.8<br />
0.6<br />
0.4<br />
0.2<br />
0<br />
disordered magnetic medium,<br />
which offer promising<br />
applications in photonic<br />
devices.<br />
0.0016<br />
0.0033<br />
0.0049<br />
0.0067<br />
0.0084<br />
0.0176<br />
0.0276<br />
0 100 200 300 400<br />
Magnetic Field (Gauss)<br />
Fig.2 The <strong>for</strong>ward scattered light intensity as a function of applied<br />
magnetic field <strong>for</strong> magnetite based ferrofluid of different volume<br />
fractions of magnetic nanoparticles. The average particle<br />
diameter was 6.7nm.<br />
The <strong>for</strong>mation of the ring<br />
clearly establishes the<br />
<strong>for</strong>mation of such rod like<br />
structures along the direction of<br />
propagation of the light wave<br />
above H C2 . The scattered wave<br />
from a long cylinder<br />
(length>>radius) <strong>for</strong>ms conic<br />
sections on a screen placed<br />
perpendicular to the incident<br />
beam. The diffused ring at<br />
lower magnetic fields indicates<br />
the distorted columns due to<br />
weak magnetic dipolar<br />
attraction. As the magnetic field<br />
increases, both the average<br />
chain length and the chain<br />
number increase. At higher<br />
fields, the ring becomes<br />
sharper indicating the<br />
<strong>for</strong>mation of smooth surfaced<br />
columns as evident from the<br />
hexagonal symmetry. In<br />
H=0 G H=50 G<br />
H=85 G H=115 G<br />
H=140 G H=200 G<br />
Fig.3 The <strong>for</strong>ward scattering patterns from ferrofluids of 0.0067 volume fraction<br />
at various magnetic fields (a) 0, (b) 50 (c) 115 (d) 140 and (e) 200 Gauss.<br />
146 BASIC RESEARCH
IGC<br />
<strong>Annual</strong> <strong>Report</strong> 2007<br />
VI.2. Microstructural Studies of Nanocomposite Thin Films<br />
of Ni/ CrN Prepared by Magnetron Sputtering<br />
Synthesis of metal nitrides and<br />
metal / metal nitride<br />
composites is very challenging<br />
as they provide a good<br />
illustration how materials<br />
properties can significantly be<br />
improved. Combination of<br />
different materials creates<br />
interfaces whose properties and<br />
processing needs to be<br />
understood to apply these<br />
materials <strong>for</strong> technological<br />
applications. It is the objective<br />
of this work is to emphasize the<br />
importance of composite<br />
materials <strong>for</strong>med by metallic<br />
particles dispersed within<br />
another insulating or<br />
nanocrystalline (nc) matrix.<br />
Metal/nc-matrix interfaces play<br />
a key role in the understanding<br />
of many fundamental<br />
properties. These interfaces<br />
play a crucial role in a wide<br />
range of technological<br />
applications such as<br />
heterogeneous catalysis, fuel<br />
cells, microelectronics and<br />
optoelectronics, as well as<br />
structural components. In<br />
addition, the metallic content<br />
and particle size effect are<br />
important issues in the design<br />
of properties, <strong>for</strong> instance,<br />
mechanical properties. Previous<br />
experimental results of<br />
hardness of nanostructured<br />
metals or metallic superlattices<br />
clearly indicate that hardness<br />
increases with decreasing grain<br />
sizes following d -1/2 dependence<br />
known as the Hall-Petch effect.<br />
However, this trend is reversed<br />
<strong>for</strong> particle sizes less than<br />
20nm <strong>for</strong> which the hardness<br />
decreases due to a grain sliding<br />
process along particle<br />
boundaries. The increase in<br />
hardness is based on hindering<br />
of the movement of dislocations<br />
by the <strong>for</strong>mation of sharp<br />
interfaces between several<br />
nanometers of thin layers of<br />
materials with a large<br />
difference in elastic shear<br />
moduli.<br />
Nanocomposite coatings are<br />
deposited by a variety of<br />
techniques including hightemperature<br />
chemical vapor<br />
deposition (CVD) and lowtemperature<br />
reactive sputtering,<br />
activated reactive evaporation<br />
and plasma CVD. The plasma<br />
techniques provide, besides the<br />
low deposition temperature, the<br />
possibility to control the ion<br />
bombardment of the growing<br />
film which results in a smaller<br />
grain size, a less columnar<br />
structure and a controllably<br />
Fig.1(a) SEM micrograph of Ni/ CrN film prepared at 773 K at 10sccm, and (b) EDX analysis of the film.<br />
BASIC RESEARCH 147
IGC<br />
<strong>Annual</strong> <strong>Report</strong> 2007<br />
adjustable compressive stress.<br />
In the present work, we<br />
demonstrate the synthesis of<br />
Ni/CrN coatings prepared by<br />
magnetron sputtering as they<br />
impart properties such as<br />
improved wear resistance,<br />
good corrosion resistance, low<br />
friction coefficients, and<br />
attractive appearance.<br />
Intensity(a.u)<br />
2000<br />
0 sccm<br />
1600 2 sccm<br />
3sccm<br />
1200 5 sccm<br />
10 sccm<br />
800<br />
15 sccm<br />
(111)CrN<br />
(200)CrN/ (111)Ni<br />
(200)Ni<br />
DC magnetron sputtering<br />
from 50Wt% Ni- 50wt%Cr<br />
target of 32.5mm diameter and<br />
3 mm thickness was used to<br />
deposit the Ni/CrN coatings in<br />
the present study. The<br />
microstructural properties as a<br />
function of nitrogen flow rate<br />
and substrate temperatures<br />
were investigated using the<br />
(220)CrN<br />
(311)CrN / (220)Ni<br />
20 sccm<br />
400<br />
25 sccm<br />
0<br />
20 30 40 50 60 70 80 90<br />
Two Theta(degrees)<br />
(311)Ni<br />
Fig.2 XRD traces of the nanocomposite films as a<br />
function of nitrogen flow rates<br />
Fig.3 TEM microstructure of nanocrystalline composite film of Ni/CrN.<br />
The inset shows the diffraction pattern containing reflections of Ni and CrN.<br />
techniques of x-ray diffraction,<br />
scanning electron microscopy<br />
and<br />
microhardness<br />
measurements. SEM/EDX<br />
analysis indicated a fine<br />
distribution of particles (Fig.1a)<br />
and the composition of the<br />
films is close that of the target<br />
stoichiometry (Fig 1b). XRD<br />
analysis indicted that the films<br />
contained Ni, Cr 2 N and CrN<br />
<strong>for</strong> flow rates less than 2<br />
standard cubic centimeter per<br />
minute (sccm) and Ni and CrN<br />
<strong>for</strong> flow rates >2sccm ( Fig.2).<br />
The particle size of the CrN and<br />
Ni were found to be 5 nm and<br />
9.5-13 nm, respectively. The<br />
films deposited at 773 K<br />
showed that the particle size of<br />
the Ni was found to remain at 5<br />
nm, while the partcle size<br />
decreased from 13 nm to 9.5<br />
nm with increasing flow rate of<br />
nitrogen. A typical TEM bright<br />
field image of Ni/CrN film<br />
deposited on NaCl and the<br />
corresponding diffraction<br />
pattern (inset of Fig.3) confirms<br />
the XRD results.<br />
Nanoindentation<br />
measurements of the films<br />
showed hardness values of<br />
about 12 GPa which is<br />
significantly lower than the<br />
hardness of pure CrN (~ 20<br />
GPa) indicating that the<br />
composite coatings might have<br />
more ductility than that of pure<br />
intermetallic nitride phase.<br />
148 BASIC RESEARCH
IGC<br />
<strong>Annual</strong> <strong>Report</strong> 2007<br />
VI.3. Synthesis and Characterisation of<br />
Nanostructured Tin Coatings By Reactive Pulsed<br />
Laser Deposition Technique<br />
Pulsed Laser Deposition (PLD)<br />
is a versatile technique to grow<br />
high quality nanostructured<br />
coatings <strong>for</strong> several<br />
technological applications.<br />
Reactive Pulsed Laser<br />
Deposition (RPLD) offers<br />
additional advantage of<br />
synthesizing transition metal<br />
oxides, nitrides and carbides<br />
with tailored stoichiometric<br />
composition from elemental<br />
metallic target circumventing<br />
the need to prepare highly<br />
dense ceramic targets. In this<br />
technique, an ultra high pure<br />
reactive gas like nitrogen is<br />
bled into the ultra high vacuum<br />
(10 -7 mbar) deposition<br />
chamber through a high<br />
conductance molecular leak<br />
valve. Interaction of nitrogen<br />
gas with highly energetic<br />
axisymmetric<br />
and<br />
supersonically expanding laser<br />
plume containing titanium<br />
vapour plasma produces TiN<br />
clusters ranging from 10-15 nm<br />
size. Impact of such clusters on<br />
a silicon substrate produces<br />
well adherent nanostructured<br />
TiN coatings. It is also possible<br />
to synthesize functionally<br />
gradient nitride coatings<br />
through control of partial<br />
pressure of nitrogen in the<br />
vacuum chamber which in turn<br />
decides the N/Ti ratio.<br />
In order to implement the<br />
above experimental philosophy,<br />
an UHV compatible RPLD setup<br />
was indigenously set up. A<br />
photograph of the<br />
facility is shown in<br />
Fig. 1. The PLD chamber was<br />
pumped by a turbomolecular<br />
pumping system to a base<br />
pressure of 10 -7 mbar. The all<br />
metal chamber contains<br />
necessary optically transparent<br />
view ports <strong>for</strong> the transmission<br />
of laser beam. A Q-switched<br />
Nd:YAG laser with a<br />
wavelength of 1064 nm,<br />
repetition rate of 10 Hz, pulse<br />
energy up to 900 mJ and pulse<br />
width of 7 ns was used <strong>for</strong><br />
executing ablation of high pure<br />
metallic target in a reactive<br />
environment obtained from<br />
mass flow controlled delivery of<br />
gases. In a typical experiment<br />
aimed at optimizing synthesis<br />
conditions <strong>for</strong> nano-structured<br />
functionally gradient TiN<br />
coating, 4 layers of TiN coating<br />
were grown sequentially on a<br />
silicon substrate kept at 473 K.<br />
For each TiN layer extending to<br />
a thickness of 100 nm, a<br />
distinct partial pressure of N 2<br />
was used. In successive<br />
advancing layers, a gradually<br />
Fig.1 Reactive Pulsed Laser Deposition facility <strong>for</strong> synthesis of multilayer<br />
hard coatings (Insert) A-RPLD in progress B-RPLD grown TiN film<br />
BASIC RESEARCH 149
IGC<br />
<strong>Annual</strong> <strong>Report</strong> 2007<br />
rising partial pressure of<br />
nitrogen gas was maintained.<br />
The compositional depth profile<br />
of this multilayer architecture<br />
was analyzed by Secondary Ion<br />
Mass Spectrometry (SIMS) using<br />
Cs + primary ion beam. The Cs<br />
Ti + and CsN 2+<br />
quasimolecular<br />
complexes were monitored<br />
along with CsO + and CsSi + to<br />
get the compositional variation<br />
as a function of sputter depth.<br />
Fig. 2 shows the composition<br />
depth profiles <strong>for</strong> the elements<br />
Ti, Si, N and O. The N/Ti ratio<br />
increases with increase in<br />
deposition pressure from 5.0 ×<br />
10 -5 mbar, reaches a maximum<br />
<strong>for</strong> films deposited at<br />
5.0 × 10 -2 mbar and then<br />
declines owing to the<br />
preponderance of O 2 at higher<br />
Fig.2 SIMS depth profile of TiN multilayers grown sequentialy on Si<br />
substrate at various deposition pressures by RPLD<br />
Fig.3 High Resolution TEM image of the RPLD grown TiN film<br />
(Insert A) elasto-plastic de<strong>for</strong>mation profile obtained by<br />
nano-indentation (Insert B) selected area electron diffraction pattern<br />
pressures. Thus it can be<br />
concluded that the deposition<br />
pressure of ~10 -2 mbar is the<br />
optimal condition <strong>for</strong> growing<br />
stoichiometric nanostructured<br />
TiN coatings.<br />
The high resolution TEM<br />
image of the TiN film grown on<br />
a NaCl substrate at 2 × 10 -2<br />
mbar and the corresponding<br />
Selected Area Electron<br />
Diffraction (SAED) pattern is<br />
shown in figure 3. These studies<br />
indicated the <strong>for</strong>mation of films<br />
highly oriented in the <br />
and directions. The d-<br />
spacing calculated from the<br />
diffraction pattern matches well<br />
with the literature values<br />
reported in PCPDF data. A<br />
typical nanoindentation profile<br />
of 800 nm thick TiN film coated<br />
on silicon substrate at<br />
2.0× 10 -2 mbar is shown as an<br />
inset in the high resolution TEM<br />
m i c r o s t r u c t u r e .<br />
Nanoindentation studies of thin<br />
films, are aimed at providing<br />
better interpretations of the<br />
elastic modulus, yield strength,<br />
strain hardening and hardness<br />
of the surface only. The<br />
hardness and modulus of the<br />
film at a depth of 80 nm<br />
calculated from the loading<br />
and unloading profile using<br />
Oliver-Pharr technique is 20<br />
GPa and 231 GPa, respectively.<br />
Ef<strong>for</strong>ts are on to synthesize AlN,<br />
ZrN and NbN coatings in<br />
similar way with an aim to<br />
produce multilayered<br />
nanostructured films with<br />
heterolaminate architecture.<br />
150 BASIC RESEARCH
IGC<br />
<strong>Annual</strong> <strong>Report</strong> 2007<br />
VI.4. Long-range Attraction between Like-charged Colloids<br />
Among the various soft matter<br />
systems, charge-stabilized<br />
colloidal suspensions (e.g.,<br />
submicron sized polystyrene<br />
latex and silica particles<br />
dispersed in water) have gained<br />
recognition as tremendously<br />
useful model condensed matter<br />
systems because of their<br />
structural ordering and rich<br />
phase behavior. Hence, these<br />
systems are of considerable<br />
interest to study fundamental<br />
questions, which are also<br />
relevant <strong>for</strong> atomic systems.<br />
Understanding of this simple<br />
model system is far from<br />
complete with respect to the<br />
effective pair-potential U(r)<br />
between the charged colloids<br />
arising due to the basic<br />
A<br />
5 µm<br />
g(r)<br />
U(r)/k B<br />
T<br />
electrostatic interactions<br />
among the constituents. Using<br />
a confocal laser scanning<br />
microscope (CLSM) we probe<br />
charged latex suspensions and<br />
show that U(r) between likecharged<br />
particles exhibits a<br />
long-range attractive minimum<br />
when effective charge density of<br />
the particles is quite high. We<br />
also observe stable bound<br />
pairs. These observations<br />
provide a direct and<br />
unequivocal evidence <strong>for</strong> longrange<br />
attraction between likecharged<br />
colloidal particles.<br />
For a very dilute suspension,<br />
the pair-correlation function<br />
g(r) is directly related to the<br />
effective pair-potential U(r) by<br />
1.0<br />
0.8<br />
0.6<br />
0.4<br />
0.2<br />
0.0<br />
0 2 4 6 8 10<br />
r (µm)<br />
2.5<br />
2.0<br />
1.5<br />
1.0<br />
0.5<br />
0.0<br />
0 2 4 6 8 10<br />
r (µm)<br />
Fig.1 A. Confocal image of 780 nm polystyrene particles of low charge<br />
density. B. Pair-potential U(r) obtained from measured pair-correlation function<br />
g(r) shows screened Coulomb repulsion between like -charged particles<br />
B<br />
(1)<br />
Hence, U(r) can be obtained by<br />
measuring g(r). Digital video<br />
microscopy and optical tweezer<br />
techniques have been used in<br />
the past to measure g(r) by<br />
imaging the colloidal particles.<br />
However, only the particles<br />
close to the microscope coverglass<br />
could be imaged in these<br />
studies because of the limited<br />
depth of focus. The cover-glass<br />
has strong influence on U(r).<br />
Further, the attraction observed<br />
in these experiments is<br />
attributed to imaging artifacts<br />
and projection errors. Thus, to<br />
date, there is no direct<br />
experimental evidence <strong>for</strong><br />
existence of a long-range<br />
attractive term in the U(r) of<br />
like-charged colloids in a bulk<br />
suspension with monovalent<br />
counterions.<br />
Observation of long-range<br />
attraction in very dilute bulk<br />
suspensions requires setting-up<br />
right experimental conditions:<br />
(a) Particles of high effective<br />
charge density, are essential<br />
to increase the strength of<br />
attraction as well as to increase<br />
the counterion concentration in<br />
the medium, which mediate the<br />
attraction between like-charged<br />
particles. (b) Elimination of<br />
BASIC RESEARCH 151
IGC<br />
wall effects and (c) avoiding<br />
sedimentation of particles due<br />
to gravity. Highly charged<br />
polystyrene colloidal particles<br />
have been synthesized to<br />
increase the concentration of<br />
counterions and redispersed in<br />
a density-matched fluid (50:50<br />
H 2 O-D 2 O mixture) to eliminate<br />
sedimentation due to gravity.<br />
The effect of charged wall is<br />
eliminated by employing a<br />
CLSM <strong>for</strong> imaging the particles<br />
far away (> 200µm) from<br />
charged cover slip. The<br />
impurity ion concentration is<br />
minimized by completely<br />
deionizing the suspension using<br />
mixed-bed ion-exchange resins.<br />
The colloidal particles deep<br />
inside the suspensions are<br />
viewed with a fast (7.3<br />
frames/sec) scanning CLSM to<br />
obtain two dimensional (2D)<br />
A<br />
5 µm<br />
U(r)/k B<br />
T<br />
optical slices Several<br />
thousands of images as time<br />
series and several such series<br />
from different locations in the<br />
sample have been. In-plane<br />
g(r) has been obtained by<br />
determining the positions of the<br />
particles by image analysis in<br />
each frame, and then<br />
averaging over several<br />
thousands of such frames. The<br />
U(r) is obtained from the<br />
measured g(r) using Eq. 1. To<br />
establish that this methodology<br />
is free from imaging artifacts<br />
we first reproduce the standard<br />
result by preparing a very<br />
dilute deionized suspension<br />
(volume fraction φ = 0.0001,<br />
and diameter d = 780 nm) of<br />
latex particles of low surface<br />
charge density σ = 0.004<br />
µC/cm 2 . Only individual<br />
particles (Fig. 1A) undergoing<br />
Brownian motion are observed<br />
g(r)<br />
6<br />
4<br />
2<br />
σ e<br />
=2.7µC/cm 2<br />
σ e<br />
=0.3µC/cm 2<br />
0<br />
0 2 4 6 8<br />
1.5<br />
r (µm)<br />
1.0<br />
0.5<br />
0.0<br />
-0.5<br />
-1.0<br />
-1.5<br />
-2.0<br />
0 2 4 6 8<br />
r (µm)<br />
Fig.2A Pair correlation function g(r) and the corresponding pair-potential<br />
U(r) <strong>for</strong> particles of high charge density. 2B.U(r) shows a long-range<br />
attractive minimum R m ~ 1.45µm<br />
B<br />
<strong>Annual</strong> <strong>Report</strong> 2007<br />
and the U(r) (Fig. 1B) obtained<br />
from measured g(r) is found to<br />
be screened Coulomb repulsive<br />
and fits to the potential <strong>for</strong>m<br />
given by Derjaguin-Landau-<br />
Verwey-Overbeek theory.<br />
In dilute suspension of high<br />
charge density ( σ = 2.7<br />
µC/cm 2 ) latex particles we<br />
observe stable bound pairs<br />
(Fig. 2A) and higher order<br />
particle clusters. These<br />
observations provide direct<br />
evidence <strong>for</strong> existence of longrange<br />
attraction between likecharged<br />
colloids. Existence of<br />
such stable bound pairs implies<br />
an attractive minimum Um with<br />
magnitudes of the order of<br />
thermal energy k B T or more in<br />
the pair-interaction U(r)<br />
between the like-charged<br />
particles. The magnitude of U m<br />
and the interparticle distance<br />
Rm at which this attractive<br />
minimum occurs, have been<br />
measured by obtaining U(r)<br />
using Eq. (1). The g(r) and U(r)<br />
<strong>for</strong> two samples with charge<br />
densities σ = 2.7 and 0.3<br />
µC/cm 2 are shown in Fig. 2.<br />
The pair- potential U(r) clearly<br />
shows an attractive minimum<br />
(Fig. 2B) at an interparticle<br />
distance of about 1.45 m<br />
which is really long-ranged as it<br />
corresponds to about 2.4 times<br />
the diameter (d = 600nm) of<br />
the particles. Further, the well<br />
depth (Fig. 2B) is found to be<br />
larger (Um ~ 1.82 kBT) <strong>for</strong><br />
152 BASIC RESEARCH
IGC<br />
<strong>Annual</strong> <strong>Report</strong> 2007<br />
particles of σ = 2.7 µC/cm 2 as<br />
compared to that <strong>for</strong> particles<br />
with σ = 0.3 C/cm 2 .<br />
Measured experimental U(r)<br />
data was found to fit to the<br />
following empirical expression<br />
U(r)=A(exp(-κr)/r) - B exp(-κr),<br />
where the constants A, B<br />
represent the strength of<br />
repulsive and attractive<br />
components of the interaction,<br />
respectively and κ -1 represents<br />
the range of interaction.<br />
Present measurements thus<br />
confirm the existence of a<br />
long-range attractive term in<br />
the effective pair-potential<br />
between like-charged colloids.<br />
The monovalent counterion (H +<br />
ions) concentration is increased<br />
in the system by increasing the<br />
charge density on the particles.<br />
The attraction is believed to<br />
arise from the counterions<br />
mediation between the<br />
macroions.<br />
VI.5. Soft Modes and NTE in Zn(CN) 2 from Raman<br />
Spectroscopy and First Principles Calculations<br />
Vibrational spectroscopy is an<br />
excellent tool to study the<br />
mechanism of thermal<br />
expansion, especially in<br />
materials that exhibit the<br />
anomalous behaviour of<br />
negative thermal expansion<br />
(NTE). Zn(CN) 2 is reported to<br />
exhibit one of the largest NTE<br />
coefficient over a wide<br />
temperature range. As some<br />
vibrational modes in a material<br />
can be optically inactive, or<br />
have low Raman scattering<br />
cross section, leading to low<br />
intensity Raman lines, it is not<br />
always possible to study the<br />
complete set of vibrational<br />
modes of a material<br />
experimentally. Hence, we need<br />
to simulate the phonon<br />
dispersions at different<br />
pressures using ab-initio<br />
methods and calculate the<br />
mode Gruneisen parameters of<br />
all the phonons as required <strong>for</strong><br />
calculation of thermal<br />
expansion coefficient.<br />
First-principles, ab-initio<br />
density functional calculations<br />
are per<strong>for</strong>med at different<br />
pressures and phonon<br />
dispersions calculated using<br />
frozen phonon approximation<br />
with SIESTA code. Norm<br />
conserving pseudopotentials in<br />
the generalized gradient<br />
approximation are used in<br />
calculations. A X 3 X 3 X 3<br />
supercell of Zn(CN) 2 unit cell is<br />
used <strong>for</strong> determining the<br />
Fig.1 Behaviour of observed Raman modes at different pressures.<br />
Inset shows pressurevariation <strong>for</strong> the calculated mode frequencies.<br />
BASIC RESEARCH 153
IGC<br />
<strong>Annual</strong> <strong>Report</strong> 2007<br />
Energy (cm -1 )<br />
2300<br />
2200<br />
600<br />
500<br />
400<br />
300<br />
200<br />
100<br />
0<br />
R<br />
Γ<br />
relaxed atomic configuration<br />
and phonon frequencies at<br />
different<br />
pressures.<br />
Calculations are per<strong>for</strong>med on<br />
8 8 8 k-point grid, with 350<br />
Rydbergs energy cutoff, using a<br />
16-node Linux cluster. Extra<br />
care is taken to ensure that<br />
inter-atomic <strong>for</strong>ces in the<br />
relaxed structure remain below<br />
10 -6 eV/Å, as otherwise phonon<br />
dispersion at ambient pressure<br />
shows imaginary frequencies.<br />
Thermal expansion coefficient<br />
is calculated from Gruneisen<br />
parameters of all modes.<br />
Phonon eigenvectors are used<br />
<strong>for</strong> assignment of phonon<br />
modes. Soft phonon modes<br />
contributing to NTE are<br />
identified from the high<br />
pressure experiments and<br />
simulations. Zn(CN) 2 procured<br />
X<br />
M<br />
Fig.2 Calculated phonon dispersion curve <strong>for</strong> Zn(CN) 2<br />
at ambient pressure<br />
Γ<br />
from Alfa-Aesar (purity ><br />
99.5%), is loaded into a Mao-<br />
Bell type diamond anvil cell<br />
with methanol-ethanol (4:1)<br />
mixture as pressure transmitting<br />
medium. Ruby fluorescence is<br />
used to measure pressure.<br />
Raman spectra are recorded at<br />
different pressures in the<br />
backscattering geometry using<br />
the 488-nm line of an argon<br />
ion laser, using a double<br />
monochromator, and detected<br />
with a cooled photomultiplier<br />
tube operated in the photon<br />
counting mode. The spectral<br />
range covered is 10-2400 cm -1<br />
that also includes the<br />
C≡N stretch mode around<br />
2220 cm -1 .<br />
Figure1 depicts the phonon<br />
frequency (ω) vs. pressure (P)<br />
<strong>for</strong> the three modes observed<br />
by Raman spectroscopy. Inset<br />
shows the behaviour of the<br />
calculated mode frequencies.<br />
Fig.2 shows the phonon<br />
dispersion obtained <strong>for</strong><br />
Zn(CN) 2 from simulation at<br />
ambient pressure. Each of the<br />
mode frequencies in Fig.1 inset<br />
correspond to those at the Γ<br />
point in the phonon dispersion.<br />
It has been suggested that<br />
ZnC 4 /N 4 rigid units are<br />
responsible <strong>for</strong> NTE. But our<br />
results show that only the C≡N<br />
bond can be treated as rigid<br />
unit and the soft<br />
modes correspond to the<br />
librational and translational<br />
modes of C≡N bond,<br />
with librational modes<br />
contributing more to thermal<br />
expansion. Out of the eleven<br />
zone-centre optical modes, six<br />
modes exhibit negative<br />
Gruneisen parameter. The<br />
value of thermal expansion<br />
coefficient, , calculated from<br />
the Gruneisen parameters is in<br />
excellent agreement with<br />
experimental value. A rapid<br />
disordering of the lattice is<br />
found above 1.6 GPa from x-<br />
ray diffraction. The<br />
present calculations and<br />
measurements provide the first<br />
insight into the relative role of<br />
the different phonons in<br />
causing negative thermal<br />
expansion in Zn(CN) 2 .<br />
154 BASIC RESEARCH
IGC<br />
<strong>Annual</strong> <strong>Report</strong> 2007<br />
VI.6. <strong>Atomic</strong> Scale Study of Negative Thermal<br />
Expansion in Zirconium Tungstate<br />
Vast majority of materials<br />
have a positive coefficient of<br />
expansion and their volume<br />
increases upon heating.<br />
Zirconium tungstate (ZrW 2 O 8)<br />
exhibits negative thermal<br />
expansion (NTE) isotropically<br />
over the temperature range 4 to<br />
1000 K, whose mechanism is<br />
yet to be completely<br />
understood. It was earlier<br />
understood that a large<br />
transverse vibration of the<br />
oxygen atom in the middle of<br />
the W-O-Zr linkage, which<br />
requires corresponding<br />
rotations of the polyhedra, is<br />
the primary origin of NTE in this<br />
material due to unconstrained<br />
feature of the structure. It<br />
becomes essential to study the<br />
local structure at Zr and /or W<br />
sites <strong>for</strong> obtaining the<br />
structural variations of<br />
ZrO 6 /WO 4 polyhedra towards<br />
a better understanding of NTE<br />
in this system<br />
ZrW 2 O 8 is a cubic compound<br />
consisting of a three<br />
dimensional network of corner<br />
linked ZrO 6 octahedra and<br />
WO 4 tetrahedra, with the latter<br />
having one non-bridging W-O<br />
bond. We probe at Zr sites (as<br />
WO 4 are more rigid than ZrO 6 )<br />
by looking at the variation of<br />
quadrupole parameters of<br />
probe atoms occupying Zr sites<br />
using Perturbed Angular<br />
Correlation (PAC) which is a<br />
hyperfine interaction technique.<br />
We have carried out 181 Hf/ Ta<br />
based PAC spectroscopy on this<br />
system to probe local structure<br />
at ZrO 6 . Using this technique<br />
Electric Field Gradient (EFG)<br />
tensors at the site(s) of<br />
occupancy of probe atoms are<br />
deduced. Principal component<br />
of EFG tensor is proportional to<br />
the quadrupole frequency (νQ)<br />
and is inversely proportional to<br />
Zr-O bond length. Asymmetry<br />
parameter (ratio of relative<br />
0.1<br />
0.0<br />
-0.1<br />
-0.2<br />
0.1<br />
0.0<br />
-0.1<br />
-0.2<br />
T m<br />
=250 K<br />
T m<br />
=560 K<br />
R(t)<br />
0 20 40<br />
time (ns)<br />
change of other two<br />
components of EFG and the<br />
principal component) is<br />
sensitive to orientation<br />
distortion if any associated with<br />
ZrO 6 .<br />
A few representative time<br />
dependent anisotropy spectra<br />
R(t) and their Fourier trans<strong>for</strong>m<br />
P(ω) are shown in Fig.1.<br />
Analysis of the spectra shows<br />
that there are four distinct Zr<br />
sites experiencing distinct<br />
quadrupole parameters such as<br />
quadrupole frequency,<br />
asymmetry parameters. The<br />
fraction which is predominant<br />
0.05<br />
0.00<br />
0.03<br />
0.02<br />
0.01<br />
0.00<br />
P(ω)<br />
0 2<br />
ω (GHz)<br />
Fig.1 Representative TDPAC spectra and their fourier trans<strong>for</strong>ms <strong>for</strong><br />
measurements carried out at 250 K and 560 K.<br />
BASIC RESEARCH 155
IGC<br />
<strong>Annual</strong> <strong>Report</strong> 2007<br />
f 1<br />
(dl/l) PAC<br />
f 2<br />
f 3<br />
f 4<br />
1.0<br />
0.8<br />
0.6<br />
0.4<br />
0.5<br />
0.4<br />
0.3<br />
0.2<br />
0.1<br />
0.2<br />
0.04<br />
0.02<br />
0.00<br />
-0.02<br />
-0.04<br />
0.4<br />
0.3<br />
0.2<br />
0.1<br />
240 280 320 360 400 440<br />
Temperature (K)<br />
at 250 K is interpreted to be<br />
due to probe atoms occupying<br />
regular ZrO 6 . This is supported<br />
by a point charge model based<br />
computation of EFG carried out<br />
by us. Based on the values of<br />
quadrupole parameters it is<br />
interpreted that the other three<br />
sites are associated with probe<br />
atoms occupying contracted<br />
and distorted ZrO 6 . An<br />
increase in the fractions<br />
experiencing<br />
higher<br />
quadrupole frequncies at<br />
higher temperature is seen in<br />
Fig 2.<br />
280 350 420 490<br />
Temperature (K)<br />
Fig.2 Variation of fractions of probe atoms associated with distinct ZrO 6<br />
octahedra. Notice the increase in the fraction corresponding to distorted<br />
octahedra, f 2 with increase of temperature. Shown in the<br />
inset is the fractional change in the average Zr-O distance,<br />
dl/l with temperature.<br />
Shown in Fig.2 is the variation<br />
of the fractions<br />
with the measurement<br />
temperature. f 1 representing the<br />
regular ZrO 6 octahedra<br />
decreases (Cf. Fig.2) while the<br />
other fractions increase with<br />
temperature. PAC spectra and<br />
the results in terms of variation<br />
of quadrupole parameters with<br />
temperature are repeatable at<br />
room temperature after in-situ<br />
measurements till 600 K. This<br />
means that the observed<br />
quadrupole parameters are<br />
due to different equilibrium<br />
configurations that ZrO 6 take<br />
as a consequence of inward<br />
rotations of polyhedra. Plotted<br />
at the top inset in Fig. 2 is the<br />
variation of dl/l with<br />
temperature. The mean value<br />
of Zr-O bondlength is obtained<br />
as the average of the negative<br />
cubic root of quadrupole<br />
frequencies weighted with<br />
respect to corresponding values<br />
of the fractions. Slope of the<br />
plot represents the coefficient<br />
of thermal expansion which is<br />
found to be negative<br />
having a value of<br />
approximately -6x10 -5 K -1 .<br />
This implies that the existence<br />
of higher frequency<br />
components and importantly an<br />
increase in the magnitudes of<br />
these fractions is essential to<br />
obtain a negative slope in the<br />
variation of mean Zr-O<br />
bondlength with temperature.<br />
This means that the existence of<br />
fractions other than f1 which<br />
represent contracted and<br />
distorted ZrO 6 octahedra<br />
caused by the inward rotations<br />
of polyhedra is essential <strong>for</strong><br />
understanding negative thermal<br />
expansion in zirconium<br />
tungstate. Thus this atomic<br />
scale study provides a proof<br />
that an effective contraction of<br />
distinct ZrO 6 octahedra due to<br />
inward rotations of polyhedra<br />
accompanied by distortions is a<br />
very important factor<br />
contributing <strong>for</strong> the observed<br />
NTE in these systems.<br />
156 BASIC RESEARCH
IGC<br />
<strong>Annual</strong> <strong>Report</strong> 2007<br />
VI.7. Synthesis of sp 3 Bonded Carbon in Laser Heated<br />
Diamond Anvil Cell at 14 GPa and above 2273 K<br />
There is intense scientific as<br />
well technological interest in<br />
hard ceramics prepared by<br />
various techniques, such as<br />
high<br />
pressure-high<br />
temperature, chemical vapour<br />
deposition etc. Diamond,<br />
diamond like carbon (DLC),<br />
cubic BN, boron carbides, TiN,<br />
etc are some such well known<br />
materials. The applications of<br />
superhard, super high thermal<br />
conductivity and super low<br />
friction of various <strong>for</strong>ms of<br />
carbon are well known.<br />
Synthesis of these carbon <strong>for</strong>ms<br />
starting from various precursors<br />
such as graphite, fullerenes,<br />
nanotubes etc., under the<br />
action of pressure and<br />
temperature, is a frontline<br />
research area. The DLC<br />
materials are hard, amorphous<br />
and contain a significant<br />
fraction of sp 3 bonded carbon<br />
atoms. Depending on the<br />
pressure and temperature<br />
conditions of synthesis, these<br />
can contain fully or partially<br />
amorphous and diamond<br />
crystallites. Here, the synthesis<br />
of various sp 3 bonded phases of<br />
graphite under the action of<br />
high pressure and high<br />
temperature is reported.<br />
The experiment was carried<br />
using a laser heated diamond<br />
anvil cell (LHDAC) facility<br />
developed in our laboratory. It<br />
consists of a Mao-Bell type<br />
diamond anvil cell (DAC) in<br />
which a tiny sample was<br />
squeezed to very high pressure<br />
in an inert pressure transmitting<br />
medium like Ar. A high power<br />
CO 2 ( λ=10.6µm) laser beam<br />
is focused onto the pressurized<br />
sample through the diamond<br />
window to heat it very high<br />
temperatures. The pressure and<br />
temperature achieveable with<br />
this set up are 100 GPa and<br />
5000K respectively. The DAC,<br />
mounted on a nanomover<br />
translation stage, can be<br />
moved in steps as small as 10<br />
nm with respect to the focused<br />
laser spot. By the controlled<br />
movement of the DAC stage,<br />
various regions of the sample<br />
are subjected to laser heating.<br />
During the process of heating,<br />
the sample inside the DAC and<br />
the focused laser spot can be<br />
viewed on the PC screen with<br />
the help of a CD imaging<br />
system. Temperature and<br />
pressure are the two crucial<br />
parameters that have to be<br />
measured in a LHDAC facility.<br />
Temperature measurement is<br />
done by recording the blackbody<br />
radiation spectrum of the<br />
hot microscopic sample and<br />
utilizing Planck's law. Pressure is<br />
measured using the well-known<br />
ruby fluorescence method, in<br />
which the calibrated<br />
wavelength shifts of the ruby R 1<br />
and R 2 fluorescence peaks are<br />
employed. The black body<br />
radiation of the sample and<br />
also the ruby fluorescence<br />
spectrum are recorded by a<br />
LN 2 -cooled CCD based<br />
spectrometer (M/s Jobin-Yvon).<br />
Since graphitization of<br />
diamond takes place at<br />
~900K, sufficient thermal<br />
insulation has to be provided to<br />
the diamonds. For this purpose,<br />
Argon gas is used as pressure<br />
transmitting media, which also<br />
acts as a good thermal<br />
insulator and IR window.<br />
A small chip of pyrolitic<br />
graphite of size~70 x 70 x 30<br />
Fig.1 The micro-Raman<br />
spectrographs obtained from the<br />
granular region of the graphite<br />
sample after laser heating showing<br />
signatures of diamond (Raman<br />
peak at 1331 cm-1) and DLC.<br />
BASIC RESEARCH 157
IGC<br />
<strong>Annual</strong> <strong>Report</strong> 2007<br />
Fig.2 Secondary electron images of<br />
the laser heated graphite shows<br />
micron size diamond crystals<br />
embedded in graphite and DLC<br />
materials.<br />
µm was mounted on a small<br />
crystal of ruby to insulate it<br />
from the diamond in a stainless<br />
steel gasket hole of diameter<br />
~150µm along with ruby<br />
crystals of size ~10-15µm <strong>for</strong><br />
pressure calibration. The<br />
graphite sample was<br />
pressurised to ~ 14 GPa and<br />
the CO 2 laser was focused on it<br />
<strong>for</strong> heating. The sample was<br />
rastered with respect to the<br />
laser beam by manipulating the<br />
nanomover system <strong>for</strong> uni<strong>for</strong>m<br />
heating. After sufficient heating,<br />
pressure was released and the<br />
sample was retrieved <strong>for</strong><br />
characterization. In order to<br />
investigate further micro-<br />
Raman was carried out by<br />
focusing the incident laser<br />
beam on various regions of the<br />
sample. The micro Raman<br />
spectrum obtained from the<br />
region of granular structure is<br />
shown in Fig.1. It clearly shows<br />
the features of sp bonded<br />
3<br />
carbon that is both diamond<br />
and DLC. SEM images revealed<br />
that several microcrystal of<br />
diamond have grown in a<br />
matrix of graphite and DLC as<br />
shown in Fig.2. The<br />
observation of diamond and<br />
DLC is quite interesting as it<br />
provides further impetus to our<br />
pursuit in the exploration of<br />
superhard phases. Further<br />
experiments using C 60 instead<br />
of graphite is being carried out<br />
to explore the predicted<br />
ultrahard phases.<br />
VI.8. Two Detector Coincidence Doppler Broadening<br />
Studies on Bulk Nickel Silicides<br />
Positron annihilation<br />
spectroscopy (PAS) is a unique<br />
defect characterization tool,<br />
which relies on the propensity<br />
of positrons to become<br />
localized in open-volume<br />
regions of a solid. In the<br />
conventional Doppler<br />
broadening spectroscopy, a<br />
single Ge detector records the<br />
Doppler broadened energy<br />
spectrum of the annihilation<br />
gamma rays (511 keV), but the<br />
spectrum suffers from high<br />
background contributions. The<br />
core annihilation events<br />
contributing to high momentum<br />
region (520 - 540 keV) overlap<br />
with the background region.<br />
This region contains<br />
in<strong>for</strong>mation pertaining to the<br />
core-electrons, using which one<br />
can deduce elemental specific<br />
in<strong>for</strong>mation. To overcome the<br />
difficulty associated with the<br />
large background contributions<br />
in the high momentum region,<br />
the annihilation spectra are<br />
recorded using two Ge<br />
detectors in coincidence mode.<br />
In this way, the peak to the<br />
background ratio is<br />
dramatically improved in the<br />
tail region and the contribution<br />
of the core electrons can be<br />
easily extracted. This is<br />
demonstrated in Fig. 1, where a<br />
conventional single detector<br />
spectrum <strong>for</strong> Si sample is<br />
Counts (arb. units)<br />
10 6<br />
10 5<br />
10 4<br />
10 3<br />
10 2<br />
10 1<br />
480 490 500 510 520 530 540<br />
γ-ray energy (keV)<br />
Fig.1 Comparison between a<br />
conventional doppler spectrum (blue)<br />
and a coincident doppler spectrum<br />
(red) recorded on Si. Note the large<br />
reduction in the background (520 to<br />
540 keV) in coincidence doppler<br />
spectrum<br />
158 BASIC RESEARCH
IGC<br />
<strong>Annual</strong> <strong>Report</strong> 2007<br />
shown along with two-detector<br />
coincidence spectrum. As can<br />
be seen, the peak (511 keV) to<br />
background (around 530 keV)<br />
ratio is about 10 2 <strong>for</strong> single<br />
detector, while it is about 10 5<br />
<strong>for</strong> coincidence mode. Thus,<br />
the Coincidence Doppler<br />
method allows to analyze the<br />
high momentum regions with<br />
much better precision, enabling<br />
chemical sensitivity.<br />
A two detector coincidence<br />
system has been setup<br />
consisting of a pair of HPGe<br />
detectors, spectroscopy<br />
amplifiers and ADC's and a<br />
MCA capable of acquiring the<br />
coincident spectrum. The Ge<br />
detectors are of 30 % efficiency<br />
having an energy resolution of<br />
1.27 keV and 1.5 keV at 662<br />
keV γ-ray. Fig. 2 shows a twodimensional<br />
spectrum recorded<br />
on Si (100). The channel<br />
numbers (converted to<br />
annihilation energies) of the<br />
two detectors <strong>for</strong>m the<br />
horizontal and vertical axes of<br />
the figure. The horizontal and<br />
the vertical bands correspond<br />
to the intensities of the<br />
annihilation gamma rays of the<br />
individual detector. The intense<br />
peak at the center corresponds<br />
to the counts <strong>for</strong> E 1 =E 2 = 511<br />
keV. The elliptical region<br />
extending diagonally with<br />
E 1 +E 2 = 1022 keV originates<br />
from the coincidence events<br />
and corresponds to the<br />
annihilations with high<br />
momentum electrons. This<br />
region is nearly background<br />
free.<br />
Coincidence Doppler<br />
measurements have been used<br />
to investigate Nickel Silicides.<br />
The ratio of the measured<br />
Doppler curve in Ni, NiSi and<br />
NiSi 2 , with respect<br />
to Si is shown in<br />
Fig. 3. The Ni curve<br />
shows a maximum around<br />
p L = 13 x 10 -3 m 0 c which<br />
corresponds to annihilation of<br />
4<br />
positrons with 3d electrons and<br />
the broadening of the curve is<br />
due to the contribution from the<br />
more localized 3p electrons.<br />
Unlike the Ni curve, the NiSi<br />
and NiSi 2 do not exhibit a<br />
maximum around 13 x 10 -3<br />
m o c, implying that the<br />
contributions from 3d electrons<br />
have decreased. It may be<br />
noted that there is a distinct<br />
maxima arising around 27 x<br />
10 -3 m 0 c <strong>for</strong> NiSi and NiSi 2 .<br />
This may be attributed to<br />
positron annihilation with 3p<br />
electrons thus bringing out the<br />
potential of coincidence<br />
Doppler measurements in<br />
distinguishing annihilations<br />
from both NiSi and NiSi 2 .<br />
These experiments illustrate the<br />
efficacy of coincidence Doppler<br />
broadening technique, that<br />
facilitates measurement of<br />
Doppler broadening spectrum<br />
with a high peak-tobackground<br />
ratio to probe the<br />
high momentum regions.<br />
Ni<br />
NiSi<br />
NiSi 2<br />
Ratio to Si<br />
3<br />
2<br />
1<br />
Fig.2 A two dimensional display of the coincident events<br />
collected on Si (100). A total of 3 x 10 7 counts are<br />
accumulated in the spectrum.<br />
0 10 20 30 40<br />
p L<br />
(10 -3 m o<br />
c)<br />
Fig.3 Ratio of the experimental curves<br />
with respect to Si.<br />
BASIC RESEARCH 159
IGC<br />
<strong>Annual</strong> <strong>Report</strong> 2007<br />
VI.9. Eigen Vector Based Approach <strong>for</strong> Enhancement<br />
of NDE Images of Defects<br />
Non-destructive evaluation<br />
(NDE) is used <strong>for</strong> detection and<br />
imaging of defects in materials.<br />
In ferromagnetic materials such<br />
as carbon steel, impedance<br />
change in eddy current (EC)<br />
probe due to defects and<br />
permeability variations are<br />
usually of same phase angle<br />
and this makes even the multifrequency<br />
methods inadequate<br />
to suppress the noise due to<br />
permeability variations. The<br />
impedance changes due to the<br />
permeability variations are<br />
incoherent whereas the<br />
impedance changes due to<br />
defects extend spatially<br />
depending on the foot-print of<br />
the eddy current probe used.<br />
Similarly, the magnetic leakage<br />
flux (MFL) from deep-surface<br />
defects is feeble and contains<br />
undesirable and incoherent<br />
noise from variations in<br />
magnetic permeability, surface<br />
roughness and stress. Utilising<br />
the incoherent nature of noise,<br />
an innovative approach based<br />
on Eigen value and Eigen<br />
vector (Eigen pair) has been<br />
developed and has been<br />
successfully applied to EC and<br />
MFL images of defects in<br />
carbon steel.<br />
In this approach, the energy<br />
packing property of the Eigen<br />
values is effectively utilized to<br />
suppress incoherent noise and<br />
to reconstruct images. This<br />
approach<br />
involves<br />
determination of Eigen pairs of<br />
image covariance matrix and<br />
reconstruction of images after<br />
considering the significant<br />
Eigen pairs having the<br />
maximum in<strong>for</strong>mation of the<br />
defects. The insignificant Eigen<br />
pairs representing mostly the<br />
incoherent noise due to<br />
permeability variations are<br />
ignored in the reconstruction<br />
during the inverse trans<strong>for</strong>m.<br />
The per<strong>for</strong>mance of the<br />
approach is assessed on eddy<br />
current images of surface<br />
defects in 25 mm thick carbon<br />
steel plate and on MFL images<br />
of deep-surface defects in 12<br />
mm thick carbon steel plates.<br />
A carbon steel plate<br />
(thickness 25 mm) consisting of<br />
a hole and a notch is used in<br />
the studies. Using a 3.5 mm<br />
diameter surface absolute eddy<br />
current probe, images of 2.5<br />
mm diameter hole (depth 0.25<br />
mm) and a notch (length 10<br />
mm, width 0.5 mm, and depth<br />
0.5 mm) are obtained at an<br />
excitation frequency of 50 kHz.<br />
Using a C-core electromagnet<br />
(4A current) and high-sensitive<br />
Fig.1 Raw eddy current image of a 0.25 mm deep hole in carbon steel plate (left) and the image after<br />
reconstruction after taking the most significant Eigen value (right).<br />
160 BASIC RESEARCH
IGC<br />
<strong>Annual</strong> <strong>Report</strong> 2007<br />
GMR sensor, MFL images of<br />
notches (length 15 mm, width<br />
0.5 mm) located at 3.1 mm,<br />
6.3 mm and 8.6 mm below the<br />
surface of 12 mm thick carbon<br />
steel plates are obtained. The<br />
EC and MFL images are used<br />
<strong>for</strong> validation of the Eigen<br />
vector approach.<br />
Typical EC raw image of 0.25<br />
mm deep hole and the<br />
reconstructed image are shown<br />
in Fig.1. The MFL images of<br />
deep-surface notch located at<br />
8.6 mm below surface and that<br />
of 1.1 mm deep surfacebreaking<br />
notch are show in<br />
Fig.2 along with the<br />
reconstructed images by the<br />
Eigen vector approach. As can<br />
be observed, there is a<br />
significant enhancement in the<br />
quality of EC and MFL images<br />
after processing.<br />
The quality of reconstruction<br />
has been assessed by<br />
determining an empirical<br />
parameter called, noise<br />
reduction factor (NRF) which is<br />
the ratio of average noise<br />
amplitude in a defect-free<br />
region in a raw image to that of<br />
the same region in<br />
reconstructed image. The NRF<br />
is found to be high when the<br />
most significant Eigen pair is<br />
used <strong>for</strong> reconstruction.<br />
However, when more Eigen<br />
pairs are included in the<br />
reconstruction, NRF is found to<br />
decrease. This is due to the fact<br />
that the smaller Eigen pairs<br />
which contain the incoherent<br />
noise in<strong>for</strong>mation of magnetic<br />
permeability variations<br />
contribute to the reconstruction<br />
process resulting in image<br />
degradation.<br />
This approach has enabled<br />
reliable detection of deepsurface<br />
notch located at 8.6<br />
mm below surface. More than<br />
1.6 times improvement in<br />
signal-to-noise ratio has been<br />
Fig.2 Raw (top) and processed (bottom) MFL images of a notch located 8.6 mm below surface<br />
and a 1.1 mm deep surface-breaking notch in carbon steel plates.<br />
BASIC RESEARCH 161
IGC<br />
<strong>Annual</strong> <strong>Report</strong> 2007<br />
observed after processing. This<br />
approach is very attractive <strong>for</strong><br />
processing NDE images<br />
affected by incoherent noise<br />
due to local variations in<br />
material properties, coupling<br />
etc. and particularly useful <strong>for</strong><br />
processing images from regions<br />
in operating components <strong>for</strong><br />
detection of very shallow and<br />
incipient fatigue cracks that<br />
disturb structural integrity. This<br />
approach can also be applied<br />
to other types of NDE images<br />
<strong>for</strong> enhancing the sensitivity <strong>for</strong><br />
detection and improving the<br />
accuracy <strong>for</strong> sizing the defects.<br />
Further, the reconstructed<br />
images can be used as input<br />
images <strong>for</strong> artificial intelligent<br />
schemes <strong>for</strong> quantitative<br />
characterization of defects.<br />
VI.10. Indigenous Development of Thermoluminescence<br />
and Long Afterglow Phosphors<br />
Synthesis of highly sensitive CaSO 4 : Dy TLD phosphor by a novel<br />
co-precipitation technique<br />
Thermo luminescence (TL), is<br />
a luminescence phenomenon<br />
observed when a crystalline<br />
solid exposed to ionising<br />
radiation is thermally<br />
stimulated, liberates some of<br />
the charge carriers (electrons or<br />
holes) that are trapped at<br />
lattice imperfections in the<br />
crystal. TL materials are widely<br />
used <strong>for</strong> personnel monitoring<br />
of radiation workers due to its<br />
reliability, sensitivity and cost<br />
effective availability. In India,<br />
about one lakh radiation<br />
workers use the TL badge<br />
based on CaSO 4 :Dy Teflon<br />
discs <strong>for</strong> personnel monitoring<br />
and about 100 kg of this<br />
phosphor is being made<br />
annually <strong>for</strong> this purpose.<br />
Presently, this phosphor<br />
is synthesised by re<br />
crystallization technique<br />
in which Gypsum<br />
(CaSO 4 .2H 2 O) with activator<br />
(Dysprosium oxide) is dissolved<br />
in concentrated sulphuric acid<br />
completely and then totally<br />
evaporated to dryness using a<br />
distillation unit in a fume hood.<br />
This technique requires the<br />
evaporation of one litre of<br />
H 2 SO 4 to get 100 g of<br />
CaSO 4 :Dy phosphor.<br />
For the first time, a simplified<br />
co-precipitation technique has<br />
been developed <strong>for</strong> the<br />
CaSO 4 :Dy phosphor synthesis<br />
which circumvents the<br />
cumbersome procedure used<br />
so far. In the new coprecipitation<br />
technique,<br />
radiation dosimetry grade<br />
CaSO4:Dy crystals are<br />
precipitated from the solution<br />
containing dissolved CaSO 4<br />
and Dy 2 O 3 using a liquid at<br />
room temperature. New recipe<br />
of CaSO 4 :Dy based on coprecipitation<br />
technique is not<br />
only economical but also<br />
compatible <strong>for</strong> large scale<br />
production. The TL glow curves<br />
of the phosphor prepared by<br />
co-precipitation and<br />
conventional method are<br />
compared in the Fig. 1. The<br />
main advantages of this coprecipitation<br />
technique over the<br />
conventional re-crystallization<br />
technique of phosphor<br />
preparation are (i) preparation<br />
time is very less. (ii) quantity of<br />
concentrated H 2 SO 4<br />
evaporated is insignificant (iii)<br />
higher TL sensitivity - 20% more<br />
than that of presently used<br />
material (iv) better glow curve<br />
structure (v) lesser glow peak<br />
shift and better linearity to<br />
gamma dose and (vi) uni<strong>for</strong>m<br />
crystal morphology and lower<br />
grain size - all grains are mostly<br />
162 BASIC RESEARCH
IGC<br />
<strong>Annual</strong> <strong>Report</strong> 2007<br />
cuboidal in shape, quite<br />
uni<strong>for</strong>m and small (average size<br />
about 25 micron), suitable <strong>for</strong><br />
manufacturing teflon discs in<br />
as-prepared <strong>for</strong>m whereas the<br />
presently used conventional<br />
phosphors are mostly (90%)<br />
above 75 micron and has to be<br />
ground <strong>for</strong> dosimetric<br />
applications.<br />
Long afterglow phosphors<br />
Phosphorescence (or<br />
afterglow) refers to the light<br />
emission at room temperature<br />
from a phosphor that persists<br />
Fig.1 Comparison of TL glow curves<br />
of CaSO 4 :Dy phosphor<br />
after removal of the excitation<br />
source. Presently oxide based<br />
phosphors like aluminates and<br />
Fig.2 Afterglow spectra of<br />
(a) combustion (b) solid-state<br />
synthesis<br />
silicates are widely used as<br />
afterglow materials. Rare earth<br />
doped long glow aluminate<br />
phosphors find application in<br />
various fields due to their high<br />
quantum efficiency and long<br />
persistence time. This <strong>Centre</strong><br />
has developed one such longafterglow<br />
phosphor,<br />
Sr 4 Al 14 O 25 :Eu 2+ ,Dy 3+ .<br />
This phosphor was<br />
synthesized through both solid<br />
state reaction and combustion<br />
synthesis routes. In case of solid<br />
state reaction, boric acid flux<br />
was added to facilitate the<br />
product synthesis at low<br />
temperature. To improve the<br />
afterglow (AG) characteristics<br />
of the phosphor,<br />
the stoichiometry was varied<br />
by taking different<br />
Sr/Al molar ratios.<br />
The luminescence properties of<br />
Eu 2+ in Sr 4 Al 14 O 25 :Eu 2+ ,Dy 3+<br />
was also studied by substituting<br />
Sr with other divalent cations<br />
like Ca, Ba and Zn.<br />
Photoluminescence (PL)<br />
intensity of both the strontium<br />
deficit and rich phosphors were<br />
enhanced in non-stoichimoetric<br />
(NS) host whereas no definite<br />
correlation was observed<br />
between the AG intensity and<br />
non-stoichiometry. NS<br />
compositions led to the<br />
<strong>for</strong>mation of different phases /<br />
compounds of strontium<br />
aluminates which resulted in<br />
either blue or green shift of the<br />
PL emission. However, the<br />
afterglow emission was not<br />
affected by the NS. Similarly the<br />
divalent ion substitutions also<br />
led to the <strong>for</strong>mation of different<br />
aluminate compounds which<br />
could change the PL and<br />
afterglow characteristics<br />
significantly. Interestingly at<br />
higher concentration of Ca in<br />
the aluminate, the host exhibits<br />
emission peaks at 440 and 530<br />
nm. The blend of these lights<br />
produces the white afterglow<br />
emission. Silver doping in this<br />
host enhanced the afterglow<br />
intensity by nearly 10 times by<br />
decreasing the trap depth and<br />
increasing the trap density but<br />
no significant change in the PL<br />
or AG intensity was observed in<br />
the presence of sodium. The<br />
afterglow and PL emission of<br />
the phosphor synthesized<br />
through combustion route was<br />
better than that<br />
prepared through solid-state<br />
method (Fig.2). The<br />
greenish-blue AG from<br />
Sr 4 Al 14 O 25 :Eu 2+ ,Dy 3+ as shown<br />
in Fig. 3 persists <strong>for</strong> more than<br />
7 h. The indigenous phosphor<br />
developed by us gives an<br />
equivalent intense emission and<br />
its afterglow persistence time is<br />
comparable to that of the<br />
commercial ones.<br />
Fig.3 Visually observed afterglow<br />
from Sr 4 Al 14 O 25 :Eu 2+ ,Dy 3+<br />
BASIC RESEARCH 163
IGC<br />
<strong>Annual</strong> <strong>Report</strong> 2007<br />
VI.11. Indigenous Development of X-ray Imaging Plate<br />
Based on Photostimulated Luminescence Phosphor<br />
For over 100 years, X-ray<br />
radiography has relied on film<br />
as the image detection and<br />
display medium. Recently,<br />
photographic films are being<br />
gradually replaced by imaging<br />
plates (IP) based on photo<br />
stimulated luminescence (PSL)<br />
storage phosphors, mainly,<br />
BaFBr:Eu 2+ . These are superior<br />
to conventional X-ray film due<br />
to high detective quantum<br />
efficiency, wide dynamic range<br />
and reusability. IPs made of<br />
BaFBr:Eu 2+ are used worldwide<br />
in hospitals and in several other<br />
applications such as X-ray<br />
diffraction, auto radiography,<br />
transmission electron<br />
microscopy etc. Computed<br />
Radiography (CR) using PSL<br />
technique allows the<br />
radiological community to go<br />
digital. By image processing of<br />
the actually acquired data,<br />
superior image quality can be<br />
obtained. Hence multiple<br />
exposures are not needed.<br />
Comparatively, the non-linear<br />
film response implies that X-ray<br />
exposures must be chosen quite<br />
carefully to avoid over or under<br />
exposures. Further benefit of<br />
CR is that the digital data can<br />
be easily transmitted to other<br />
places to seek specialist's<br />
opinion.<br />
With the aim of indigenously<br />
developing an X-ray imaging<br />
plate, high sensitive BaFBr:Eu 2+<br />
storage phosphor has been<br />
successfully synthesized recently<br />
using high temperature solid<br />
state diffusion route in a<br />
reducing atmosphere. The PSL<br />
spectra of the BaFBr:Eu 2+<br />
synthesised are comparable to<br />
that of commercial IP (Fuji)<br />
after irradiation. A broad<br />
stimulation spectrum in 480 -<br />
650 nm region corresponding<br />
to the depopulation of the<br />
electrons trapped at F(Br-)<br />
centers is observed. Fluorineexcess<br />
non-stoichiometric,<br />
BaF 1.015 Br 0.985 :Eu 2+ showed<br />
maximum PSL with 590 nm<br />
light stimulation. The<br />
stimulated luminescence<br />
process in this phosphor can be<br />
explained on the basis of the<br />
presence of interstitial fluorine<br />
ions (F I-<br />
) and bromine ion<br />
vacancies prior to X-irradiation<br />
(during crystal growth) in nonstoichiometric<br />
materials as<br />
shown in Fig. 1a. On X-<br />
irradiation, electrons dislodged<br />
Ba 2+ F -<br />
Br -<br />
Ba 2+ F - Br -<br />
Ba 2+ F - Br -<br />
Ba 2+ F -<br />
F I<br />
-<br />
Eu 2+ F -<br />
Br -<br />
Ba 2+ Br -<br />
F 2<br />
-<br />
Eu 2+ F - e -<br />
Ba 2+ F 2<br />
-<br />
(300 nm)<br />
Br -<br />
Eu 2+ F - e -<br />
(a) Be<strong>for</strong>e irradiation (b) On X-irradiation (c) On photo stimulatiion<br />
(~400nm)<br />
Fig.1 Proposed model of PSL process in BaF 1.015 Br 0.985 : Eu 2+<br />
164 BASIC RESEARCH
IGC<br />
<strong>Annual</strong> <strong>Report</strong> 2007<br />
Fig.2 Skull phantom image using Kodak IP (14) and <strong>IGCAR</strong> IP (13)<br />
-<br />
from F I get trapped at bromine<br />
ion vacancies thereby <strong>for</strong>ming<br />
F(Br-) centers. The interstitial<br />
fluorine atoms thus <strong>for</strong>med<br />
combine with the lattice fluorine<br />
-<br />
ions to <strong>for</strong>m molecular ions, F 2<br />
(H type center), whose presence<br />
on x-irradiation was detected by<br />
ESR (Fig. 1b). In the proposed<br />
model, F I-<br />
ions act as hole traps<br />
and bromine vacancies act as<br />
electron centers. On photo<br />
stimulation, the electrons<br />
released from F(Br-) centers<br />
recombine with holes trapped<br />
at F 2 - centers, which results in<br />
intrinsic (self-trapped exciton)<br />
emission (~300 nm) which is<br />
characteristic of the BaFBr host<br />
(Fig. 1c). This radiatively excites<br />
the Eu 2+ ions thereby causing<br />
PSL emission around 400 nm.<br />
The merits of the proposed<br />
mechanism are: it explains why<br />
only fluorine excess compounds<br />
cause intense PSL, it provides a<br />
charge compensation<br />
mechanism arising out of the<br />
presence of bromine vacancies,<br />
it supports the experimentally<br />
-<br />
observed F 2 centers on X-<br />
irradiation in fluorine excess<br />
BaFBr, and above all it brings<br />
the material back to its initial<br />
state on photo stimulation.<br />
An imaging plate has been<br />
made with the help of M/s<br />
Kiran X-ray screens Ltd,<br />
Mumbai using the indigenously<br />
synthesized storage phosphor. A<br />
comparative skull phantom<br />
image was recorded using a<br />
commercial scanner and a<br />
commercial Kodak IP as well as<br />
the IP made from the storage<br />
phosphor synthesized at <strong>IGCAR</strong><br />
at the same X-ray exposure<br />
parameters (Fig. 2). All the<br />
salient features of the image<br />
are seen in the IP made from<br />
our phosphor. The sensitivity is<br />
comparatively good but the<br />
contrast needs improvement.<br />
The grain morphology is<br />
uneven and higher than the<br />
desired value, which causes<br />
uneven light scattering that<br />
reduces the image contrast.<br />
Modified synthesis techniques<br />
and grinding procedure of the<br />
phosphor developed recently<br />
have improved the grain<br />
morphology (grain size ~ 20<br />
µm). Recent ef<strong>for</strong>ts in preparing<br />
the phosphor in large scale with<br />
a simple and cost effective<br />
technique using the local make<br />
chemicals have been<br />
successful. Manufacturing more<br />
number of test IPs and<br />
comparative studies with<br />
commercial IPs are in progress.<br />
BASIC RESEARCH 165
IGC<br />
<strong>Annual</strong> <strong>Report</strong> 2007<br />
VI.12. X-ray Diffraction Studies using Imaging Plate as<br />
an Area Detector<br />
Imaging plate based X-ray<br />
area detectors were initially<br />
used <strong>for</strong> protein crystallography<br />
in the 1980s and more recently,<br />
their use has extended to smallmolecule<br />
structural analyses<br />
and powder diffractometry. The<br />
usage of imaging plate is<br />
particularly advantageous <strong>for</strong><br />
the characterization of<br />
polycrystalline materials since it<br />
permits simultaneous collection<br />
of many orders of Bragg<br />
reflections. There is also a<br />
significant size advantage<br />
compared to CCD based area<br />
detector. In addition to the<br />
enormous reduction of data<br />
acquisition time <strong>for</strong> analyses,<br />
two-dimensional diffraction<br />
patterns contain much more<br />
in<strong>for</strong>mation than conventional<br />
linear scans (i.e. - 2 scans)<br />
collected using standard<br />
powder diffractometers. Two<br />
dimensional diffraction patterns<br />
of polycrystalline samples<br />
typically consist of concentric<br />
(Debye-Scherrer) rings<br />
produced by the superposition<br />
of reflections from many<br />
crystals illuminated by the X-ray<br />
beam, which are oriented with<br />
a set of (hkl) crystallographic<br />
planes oriented to fulfill the<br />
Bragg condition. Depending on<br />
sample characteristics, these<br />
rings might be continuous or<br />
spotty and display specific<br />
variation in the intensities along<br />
them. These features contain<br />
important in<strong>for</strong>mation about<br />
the microstructure of the<br />
sample: grain size, preferential<br />
orientation, mosaicity, stress<br />
etc. Additionally, twodimensional<br />
patterns can be<br />
converted into conventional<br />
linear scans by radial or<br />
azimuthal integration of pixel<br />
intensities. The generated linear<br />
scans can be processed as<br />
usual <strong>for</strong> mineral phase<br />
identification, crystallinity or<br />
Rietveld refinement studies.<br />
Nevertheless, during this data<br />
reduction procedure, most of<br />
the in<strong>for</strong>mation regarding the<br />
microstructure of the material is<br />
lost. Hence to get the full<br />
advantage of two-dimensional<br />
diffraction <strong>for</strong> polycrystalline<br />
materials we have to extract the<br />
in<strong>for</strong>mation contained in the<br />
two dimensional diffraction<br />
patterns. Here we are reporting<br />
the diffraction experiment<br />
results obtained using the<br />
imaging plate as an area<br />
detector <strong>for</strong> both single crystal<br />
and powder experiments. The<br />
imaging plate reader has 5<br />
mega pixel resolution <strong>for</strong> 250<br />
mm X 200 mm size plate with<br />
each pixel size of 100 the<br />
data file size is 10 Mbytes.<br />
Fig.1 Laue diffraction pattern of a Si single crystal obtained using the<br />
Imaging plate as an area detector (the plate read using reader developed<br />
at MSD <strong>IGCAR</strong>). The inset shows the maximum zoom of a diffraction point<br />
and its intensity profile in surface and line plot.<br />
Laue X-ray diffraction is<br />
historically the first diffraction<br />
method <strong>for</strong> structural<br />
166 BASIC RESEARCH
IGC<br />
<strong>Annual</strong> <strong>Report</strong> 2007<br />
characterization of the crystals<br />
and even today it is the first step<br />
in assessing the crystal quality.<br />
In the Laue camera, instead of<br />
the photographic X-ray film an<br />
imaging plate cut in a circular<br />
shape is loaded and covered<br />
with an opaque paper. The<br />
exposed plates are scanned to<br />
obtain the image. The Laue<br />
diffraction pattern <strong>for</strong> Si crystal<br />
in both transmitted and back<br />
reflected geometries are given<br />
in Fig.1. The inset in Fig. 1<br />
shows the enlarged view of a<br />
particular Laue spot which<br />
depends on the nature of the<br />
crystal.<br />
The powder XRD experiment<br />
was carried out using the<br />
imaging plate <strong>for</strong> a BaF 2<br />
standard sample. The sample<br />
was kept in front of the<br />
collimator in Debye Scherrer<br />
geometry and the imaging plate<br />
kept at a distance of 77.6 mm<br />
from the sample. Mo K X-ray<br />
°<br />
with a wavelength of 0.709 A is<br />
used <strong>for</strong> this experiment. The<br />
Fig.2 Powder diffraction pattern of BaF 2 sample; with some isolated<br />
diffraction spots along the Debye rings indicated using the small circles<br />
in the images. The blue circle and the arc shows the psi angle<br />
XRD image obtained is shown<br />
in figure 2. The sample was<br />
well powdered be<strong>for</strong>e carrying<br />
out the diffraction experiment.<br />
In spite of this there are a few<br />
isolated diffraction spots<br />
(shown by the circles in the<br />
image) in the powder pattern<br />
indicating the coarse grained<br />
nature of the sample. This 2D<br />
pattern is converted into a 1D<br />
pattern by azimuthal integration<br />
of pixel intensities from 0 to<br />
360° and by increasing the<br />
radius value from the centre of<br />
the concentric rings to the edge<br />
of the plate (2000 units). The<br />
center point of the rings is<br />
identified by triangulation of<br />
Fig.2 Powder diffraction pattern of BaF 2 sample; with some isolated<br />
diffraction spots along the Debye rings indicated using the small circles<br />
in the images. The blue circle and the arc shows the psi angle<br />
three points of any one of the<br />
rings. This centre is a crucial<br />
factor in the 1D data quality<br />
hence its accurate location is<br />
essential. In order to compare<br />
the integrated data with that<br />
collected using a standard<br />
powder diffractometer (with a<br />
point detector), the intensity of<br />
every 2 step is normalized by<br />
the number of pixels<br />
contributing to it. Also in the<br />
converted data there is high<br />
background hence it is<br />
removed from the image using<br />
an algorithm. The as acquired<br />
XRD image and the background<br />
subtracted image are shown in<br />
Fig. 2 and the inset (intensity<br />
plot along the circumference of<br />
the ring) shows the coarse<br />
grained nature in the sample.<br />
The converted 1D pattern<br />
be<strong>for</strong>e and after removing the<br />
background is shown in figure<br />
3. The conclusion is that if<br />
there is a single crystal<br />
diffractometer with area<br />
detector like imaging plate the<br />
same could be used <strong>for</strong> powder<br />
diffraction experiments.<br />
BASIC RESEARCH 167
IGC<br />
<strong>Annual</strong> <strong>Report</strong> 2007<br />
VI.13. Identification and Localization of Dipoles<br />
<strong>for</strong> Magnetoencephalography<br />
Magnetoencephalography<br />
(MEG) is a technique <strong>for</strong> noninvasive<br />
functional imaging<br />
of the brain using<br />
Superconducting Quantum<br />
Interference Devices (SQUIDs).<br />
In MEG, the neural current<br />
sources have to be determined<br />
based on the magnetic field<br />
distribution measured outside<br />
the brain. To obtain an<br />
approximate solution to this<br />
inverse problem, the brain is<br />
typically modeled as a set of<br />
concentric spheres and the<br />
neural currents that cause the<br />
magnetic field are represented<br />
as current dipoles which are<br />
either rotating or stationary.<br />
The identification of the<br />
locations of dipoles and their<br />
temporal characteristics<br />
(rotating and non-rotating) in<br />
the presence of noise has been<br />
done using the MUltiple Signal<br />
Classification (MUSIC)<br />
approach. With the<br />
development of SQUID sensors<br />
at <strong>IGCAR</strong> and setting up of<br />
MEG facility, these results will<br />
be of practical importance <strong>for</strong><br />
the analysis of MEG signals.<br />
The radial component of the<br />
magnetic field b r produced<br />
outside the skull at (xn',yn',zn')<br />
by a set of equivalent current<br />
dipoles of strength qi's situated<br />
inside the cortex at (xi,yi,zi)<br />
can be written as a product of<br />
a gain matrix M and the<br />
column vector Q representing<br />
their strength (Fig.1).<br />
For four dipoles, 118<br />
measurement locations and<br />
100 time slices, b r is a<br />
118x100 matrix, M is a<br />
118x12 matrix and Q is a<br />
12x100 matrix. To simulate a<br />
realistic measurement, we add<br />
to b r a Gaussian noise term<br />
with mean zero and variance<br />
10% of the maximum magnetic<br />
field due to the source to<br />
obtain the noisy data matrix b rn .<br />
An approximate solution to<br />
the problem of deducing the<br />
locations and the strengths of<br />
the equivalent current dipoles<br />
can be obtained by minimizing<br />
the residual error between the<br />
simulated magnetic field b rn<br />
and the calculated field. If brn<br />
is decomposed into [UΣV T ] by<br />
singular value decomposition<br />
(SVD) and is seen to have a<br />
rank r, then the<br />
noise subspace can<br />
be approximated by<br />
U m-r U T m-r (U m-r is the matrix<br />
containing of m-r columns at<br />
the extreme right of the<br />
decomposed matrix U). To find<br />
the dipole locations by MUSIC<br />
approach,Gi, the single dipole<br />
Table 1 : Results of inversion calculation <strong>for</strong> four dipoles with 10% noise.<br />
168 BASIC RESEARCH
IGC<br />
<strong>Annual</strong> <strong>Report</strong> 2007<br />
gain vector is decomposed into<br />
[UiΣiVi T ] and the matrix<br />
comprising of first three column<br />
vectors of Ui is represented as<br />
Uiq which is the signal<br />
subspace. In MUSIC, the anticorrelation<br />
cost function matrix<br />
J is the product of signal<br />
subspace and noise subspace.<br />
To identify the positions<br />
of the dipoles, the<br />
minimum eigenvalue of<br />
the cost function.<br />
T<br />
J ls =λmin (Ui q U m-r U T m-r Ui q )<br />
Matrix J is evaluated in the<br />
region of interest and peaks in<br />
Fig.1 Spherical model of head with cortex as an annular shell.<br />
The magnetic field is measured on the surface of a concentric<br />
hemisphere using SQUID sensor.<br />
the inverse of this function J ls<br />
are identified to indicate the<br />
position of the dipoles, thus<br />
avoiding any apriori<br />
assumption of number of<br />
dipoles. If the dipole is rotating<br />
then all the eigenvalues of the<br />
cost function matrix J are zero<br />
which imply that trace of J is<br />
zero. Thus identification of<br />
rotating and non rotating<br />
dipoles can be done just by<br />
evaluation of J alone.<br />
Fig.2 Inverse of cost function (Jls) plot w.r.t the scan coordinates showing the<br />
presence of all the four dipoles both rotating and non-rotating and their<br />
locations<br />
Fig.3 Inverse of trace of the cost function matrix J w.r.t scan coordinates<br />
showing presence of only two rotating dipoles and<br />
their respective locations<br />
Results of numerical simulations<br />
Human head is modeled as a<br />
sphere of radius 12 cm with<br />
the cortex as a shell having a<br />
radius 8 cm and thickness 2 cm<br />
(Fig 1). Four current dipoles<br />
are positioned within the cortex<br />
in the upper hemisphere. The<br />
strengths of first two dipoles are<br />
assumed to evolve in time with<br />
the functional dependence of<br />
the <strong>for</strong>m t.exp(γ- t) with different<br />
time constants γ. The other two<br />
dipoles are assumed to rotate<br />
with different frequencies. The<br />
magnetic field due to these four<br />
dipoles were calculated at 118<br />
measurement locations on the<br />
surface of a concentric upper<br />
BASIC RESEARCH 169
IGC<br />
<strong>Annual</strong> <strong>Report</strong> 2007<br />
hemisphere of radius 13 cm in<br />
100 time slices. 10% Gaussian<br />
noise with mean zero is added<br />
to the computed data to obtain<br />
the b rn matrix. By using the<br />
MUSIC approach described<br />
above locations of all the<br />
dipoles are identified as shown<br />
in Fig.2. with characteristic<br />
rotating dipoles being identified<br />
after plotting the inverse of<br />
trace of the cost function matrix<br />
J as shown in Fig.3. It is seen<br />
from the results presented in<br />
Table -1that the locations of the<br />
dipoles identified by this<br />
inversion algorithm are<br />
accurate to within 2 mm within<br />
the cortex even in the presence<br />
of 10% noise.<br />
VI.14. A Novel Technique to Irradiate Blood Cells<br />
in vitro with Alpha Radiation <strong>for</strong> Cytogenetic Aanalysis<br />
The need <strong>for</strong> determining a required <strong>for</strong> purposes of<br />
reliable Radiobiological radiation protection, human<br />
Effectiveness (RBE) value <strong>for</strong> blood cells need to be<br />
alpha exposures has become<br />
important as reported literature<br />
values vary widely. Moreover,<br />
increasing nuclear reprocessing<br />
irradiated in vitro. However,<br />
unlike gamma radiation, due to<br />
the low penetrating power of<br />
alpha rays, it has always been a<br />
facilities the world-over calls <strong>for</strong> challenge <strong>for</strong> radiation<br />
measures to estimate alpha biologists to handle alpha<br />
radiation doses during a sources. A simple technique to<br />
criticality accident such as the irradiate human blood<br />
one that occurred at lymphocytes in vitro using<br />
Tokaimura, Japan, in 1999. In radon gas emanating from a<br />
order to construct doseresponse<br />
solid radium source has been<br />
curves and calculate<br />
RBE factors <strong>for</strong> risk estimation<br />
designed and developed. The<br />
difficulties in delivering and<br />
Fig.1 Blood irradiation using the radon source<br />
estimating exact activity<br />
concentrations have been<br />
handled in a unique and safe<br />
way. Such a method was used<br />
to score chromosome<br />
aberrations induced by radon<br />
and progeny.<br />
Radon exposure<br />
The radon source used in the<br />
present study was procured<br />
from Pylon (Canada). The<br />
assembly used <strong>for</strong> irradiation is<br />
shown in Fig 1. Activity was<br />
determined using a custom<br />
designed Lucas cell (Fig.2).<br />
The radon concentration and<br />
doses were calculated using the<br />
equations:<br />
Activity (Bq/m 3 )= 0.06967 x<br />
(-0.00012584 x DT)<br />
NC/ Eff x 0.14 e x 1<br />
- e (-0.00012584 x CT) Metaphases<br />
prepared by standard culturing<br />
methods were captured using a<br />
Metaphase finder<br />
(Metasystems, Zeiss) available<br />
at RSD. (Fig.3).<br />
170 BASIC RESEARCH
IGC<br />
<strong>Annual</strong> <strong>Report</strong> 2007<br />
Highlights of the new technique<br />
The new technique designed<br />
to irradiate blood, medium and<br />
other cells has features such as:<br />
(a) portable alpha irradiation<br />
Fig.2 Lucas cell<br />
facility, unlike those designed<br />
earlier, (b) safe to handle as it<br />
does not involve liquid alpha<br />
source, (c) can be easily set up<br />
and dismantled, (d) samples<br />
can be irradiated under sterile<br />
conditions and (e) the<br />
irradiation procedure gives a<br />
4∏ geometry making it easier to<br />
apply Marinelli <strong>for</strong>mula <strong>for</strong><br />
dose calculations.<br />
The irradiation facility also<br />
serves as an excellent in vitro<br />
method to characterize the<br />
Fig.3 Microscope equipped with the<br />
metaphase finder<br />
DNA damaging effects of<br />
radon and its progeny, which is<br />
known to be a major cause of<br />
lung cancer among miners and<br />
people living in areas with high<br />
natural background radiation.<br />
VI.15. Vaporization Study of Ru-Te Binary System by<br />
Knudsen Effusion Mass Spectrometry<br />
Continuing the high<br />
temperature chemistry research<br />
on systems involving the fission<br />
product tellurium and the SS<br />
clad components or other<br />
fission products, a vaporization<br />
thermodynamic study of the Ru-<br />
Te binary system has been<br />
conducted at <strong>IGCAR</strong> by using<br />
Knudsen effusion mass<br />
spectrometry. The only<br />
condensed phase known to<br />
exist in this system is RuTe 2 and<br />
no report of mass<br />
spectrometric investigation exits<br />
<strong>for</strong> this system. Four samples<br />
were employed <strong>for</strong> this study,<br />
two having compositions 40.0<br />
and 50.5 at.% Te and<br />
corresponding to the two-phase<br />
field (Ru + RuTe 2 ) and the other<br />
two having compositions 69.5<br />
and 71.5 at. %Te and<br />
corresponding to the two-phase<br />
field (RuTe 2 + Te).<br />
The experiments can be<br />
broadly classified into three<br />
series: 1) many runs of<br />
temperature dependence<br />
measurements on (Ru + RuTe 2 )<br />
two-phase field samples (860-<br />
1030 K), interposed between<br />
pressure<br />
calibration<br />
measurements on elemental<br />
tellurium and occasionally on<br />
silver; 2) continuous<br />
measurements on (RuTe +<br />
2 Te)<br />
two-phase field samples at<br />
various isothermal sections as<br />
the shift in the composition<br />
(towards Ru-rich values) and<br />
consequently the phase fields,<br />
too, were occurring; and 3)<br />
temperature dependence<br />
measurements on the end<br />
products of series-2<br />
experiments - to examine or<br />
rather confirm whether the<br />
results are in accord with results<br />
of series-1 experiments. Te 2 (g)<br />
being the sole identifiable<br />
vapor species, measurements in<br />
all three series were per<strong>for</strong>med<br />
<strong>for</strong> most part on the ionic<br />
species Te 2+<br />
, and sometimes on<br />
the fragmentation product Te +<br />
also. Fig.1 shows the results of<br />
a temperature dependence run<br />
(series-1) <strong>for</strong> Te + and Te 2+<br />
at an<br />
electron impact energy of ~ 30<br />
eV. Fig. 2 shows the results of a<br />
homogeneity range experiment<br />
BASIC RESEARCH 171
IGC<br />
<strong>Annual</strong> <strong>Report</strong> 2007<br />
(series-2). A temperature cycle<br />
imposed on the sample after it<br />
exited the RuTe 2 single phase<br />
region revealed that I(Te 2+<br />
) at<br />
980 K was consistent in both<br />
decreasing and increasing<br />
temperature directions.<br />
The results of series-1<br />
experiments yielded a<br />
p(Te 2 )-T relation <strong>for</strong> Te 2 (g) and<br />
∆rHm o (T) <strong>for</strong> the incongruent<br />
vaporization reaction: RuTe 2 (s)<br />
= Ru(s) + Te 2 (g). The series-2<br />
experiments, mainly per<strong>for</strong>med<br />
to be able to determine the Teand<br />
Ru-rich boundary<br />
compositions of RuTe 2 phase,<br />
gave somewhat disconcerting<br />
results, the Te-rich boundary<br />
values showing some<br />
dependence on the starting<br />
composition or the amount. The<br />
Ru-rich boundary values are<br />
relatively consistent (i.e. within<br />
the uncertainties associated<br />
with such experiments) and<br />
close to stoichiometric value,<br />
which we assumed while<br />
evaluating the series-1 data. It<br />
is now proposed to conduct a<br />
few more experiments on at<br />
least two newer compositions<br />
(one, only slightly Te-rich<br />
relative to the hitherto reported<br />
Te-rich boundary composition,<br />
and the other 73.5 at.% Te) to<br />
examine the reason <strong>for</strong><br />
dependence of Te-rich<br />
boundary values on the starting<br />
composition.<br />
log{[I(Te 2<br />
+<br />
)/I<br />
o<br />
](T/K)}<br />
log{[I(Te 2<br />
+<br />
)/I<br />
o<br />
](T/K)}<br />
2.0<br />
1.5<br />
1.0<br />
0.5<br />
0.0<br />
-0.5<br />
-1.0<br />
-1.5<br />
-2.0<br />
2.0<br />
1.5<br />
1.0<br />
0.5<br />
0.0<br />
-0.5<br />
-1.0<br />
-1.5<br />
-2.0<br />
605 K<br />
Te 2<br />
+<br />
Te +<br />
9.5 10.0 10.5 11.0 11.5 12.0<br />
700 K<br />
635 K 650 K<br />
10 4 (K/T)<br />
820 K<br />
750 K<br />
900 K<br />
980 K<br />
980 K<br />
(RuTe 2<br />
+Te) RuTe 2<br />
(Ru+RuTe 2<br />
)<br />
400 600 800 1000 1200 1400 1600<br />
Time (minutes)<br />
Temp range : 860-1030 K<br />
Fig.1 Temperature dependence of ion intensitied of T e<br />
+<br />
and T e2<br />
+<br />
at ~30 ev<br />
980 K<br />
980 K<br />
960 K<br />
1000 K<br />
Fig.2 variation of 1 (Te 2+<br />
) as a function of time at different temperatures;<br />
composition of the sample 69.5 at % Te<br />
172 BASIC RESEARCH
Chapter -7<br />
INFRASTRUCTURE FACILITIES<br />
VII.1. Fabrication of Beam Chamber and Cryostat<br />
Vacuum Plumbing Lines <strong>for</strong> VECC, Kolkata<br />
Three numbers of Beam chamber plumbing lines and one number of Cryostat vacuum<br />
plumbing line (Fig.1) were fabricated meticulously <strong>for</strong> VECC, Kolkata, <strong>for</strong> the large super<br />
conducting cyclotron facility K500, which is planned to provide accelerated particle<br />
energies <strong>for</strong> frontline experiments at par with their international counterparts to our<br />
nuclear physicists.<br />
These Beam chamber and Vacuum plumbing lines are designed to connect with Turbo<br />
pump & Pumping modules to operate in the pressures < 1 x 10 -6 mbar and 5.0 x 10 -8<br />
mbar respectively.
IGC<br />
<strong>Annual</strong> <strong>Report</strong> 2007<br />
Each plumbing line consists<br />
of 12 components made of<br />
SS316 material, The Overall<br />
size of the assembly is 2232 x<br />
1155 mm. The critical<br />
requirement is leak tightness of<br />
the assemblies in the order of 1<br />
x 10 -10 mbar * l /s and 100 %<br />
radiography on all welds.<br />
To achieve this task,<br />
meticulous process planning,<br />
selection of the optimum<br />
parameters <strong>for</strong> machining the<br />
components precisely in<br />
different machines to meet the<br />
stringent dimensional<br />
tolerances were selected.<br />
Fig.1 Beam chamber and cryostat vacuum plumbing lines<br />
Unique layout was prepared to Liquid Penetrant Inspection,<br />
<strong>for</strong> each assembly, stage 100% Radiography and Final<br />
inspection , fit up of Assembly was subjected to<br />
components, assembly and Helium leak test to 1 x 10⁻¹⁰<br />
welding by GTAW process was mbar * l /s and found<br />
used to minimize distortion. All satisfactory.<br />
the weld joints were subjected<br />
VII.2. Machining of Iron Thimbles <strong>for</strong> Fabrication of<br />
Electrochemical Carbon Meters<br />
Thirty numbers of Amco Iron<br />
thimbles were machined<br />
precisely <strong>for</strong> fabrication of<br />
electro chemical carbon meters<br />
(Fig.1). The thimbles are made<br />
up of soft Armco Iron material<br />
of size OD 19mm, ID 16mm<br />
and 90mm length. The critical<br />
dimension of 0.5mm wall<br />
thickness was standardized <strong>for</strong><br />
rapid diffusion of carbon<br />
through iron thimbles. Mockups<br />
were carried out to<br />
establish process sequence and<br />
machining parameters to<br />
achieve the critical requirement<br />
of 0.5 mm uni<strong>for</strong>m wall<br />
thickness, close dimensional,<br />
Fig.1 Machined iron thimbles<br />
geometrical tolerances and machine the OD of soft iron<br />
surface finish. The critical thimble to achieve 0.5 mm<br />
machining of ID 16 mm ± 0.01 uni<strong>for</strong>m wall thickness and to<br />
mm was achieved by prevent possible damage<br />
progressive machining using during machining and achieved<br />
drilling, hole mill cutter and the dimensions within the<br />
boring tool. A mandrel was tolerance of 0.01 mm.<br />
designed to suit ID and used to<br />
174 INFRASTRUCTURE FACILITIES
IGC<br />
<strong>Annual</strong> <strong>Report</strong> 2007<br />
VII.3. Manufacture of In-core Neutron Detector<br />
Assembly <strong>for</strong> PFBR<br />
PFBR in-core neutron detector<br />
assembly (Fig.1) was precisely<br />
manufactured meeting the<br />
stringent specifications <strong>for</strong><br />
testing High Temperature<br />
Fission Chambers (HTFC) and<br />
neutronic channels of PFBR and<br />
to compare the results with the<br />
output from FBTR neutronic<br />
channels to assess its<br />
per<strong>for</strong>mance characteristics.<br />
This test set up consists of two<br />
major sub assemblies, namely<br />
inner rod assembly and outer<br />
sheath assembly comprising 22<br />
numbers of precisely machined<br />
components made of AISI 316<br />
material. The overall length<br />
and diameter of assembly are<br />
5950.0 mm and 101.0 mm<br />
respectively. Manufacturing of<br />
this assembly requires precision<br />
machining of components to<br />
comply with the stringent<br />
dimensional, geometrical<br />
tolerances, surface finish and<br />
also the best methodology to<br />
assemble the machined<br />
components. Machining of<br />
outer sheath of length 5950.0<br />
mm and OD 101.0 mm was a<br />
critical job due to its<br />
slenderness, very low wall<br />
thickness and bends in the raw<br />
material 100NB Sch.80 SS316<br />
pipe. Be<strong>for</strong>e machining, the<br />
pipe was straightened using a<br />
specially designed set up and<br />
hydraulic press. To machine the<br />
slender pipe in lathe machine,<br />
considering the low wall<br />
thickness and length, the<br />
machining parameters were<br />
optimized and the machining<br />
carried out in six steps to<br />
prevent buckling, puncturing<br />
and possible damage during<br />
machining. Ultrasonic thickness<br />
gauge was used in-situ to<br />
measure the uni<strong>for</strong>m thickness<br />
along the length of pipe.<br />
Machining of shielding shell<br />
top of dia 85mm and length<br />
1821 mm with 7mm O-ring<br />
groove on the circumference at<br />
3 places were critical feature of<br />
machining and it was<br />
successfully machined and<br />
achieved the dimensions with in<br />
the tolerance of 0.01mm. The<br />
assembly was carried out in<br />
nuclear clean hall. Segmental<br />
and sequential GTA welding<br />
techniques with controlled heat<br />
input was adopted <strong>for</strong> all the<br />
weld joints to minimize<br />
distortion and achieved the<br />
concentricity of 0.50mm <strong>for</strong><br />
inner rod assembly and 1.22<br />
mm <strong>for</strong> Outer sheath assembly.<br />
All the components were<br />
inspected at stages and at the<br />
final stage. Weld joints were<br />
subjected to liquid penetrant<br />
inspection and 100%<br />
radiography inspection. Helium<br />
leak test was conducted and<br />
achieved the overall leak rate<br />
of 10 -10 std.atm-cc/sec against<br />
the design requirement of 10 -7<br />
std.atm-cc/sec.<br />
Fig.1 Neutron detector holder<br />
assembly<br />
INFRASTRUCTURE FACILITIES 175
IGC<br />
<strong>Annual</strong> <strong>Report</strong> 2007<br />
VII.4. Revamping and Upgradation of<br />
Cooling Towers<br />
Central Water Chilling Plant<br />
(CWCP) is responsible <strong>for</strong> air<br />
conditioning and ventilation of<br />
various laboratories of <strong>IGCAR</strong>.<br />
The CWCP operates<br />
continuously in round the clock<br />
shifts to ensure uninterrupted<br />
and reliable chilled water<br />
supply <strong>for</strong> air conditioning of<br />
various labs and buildings at<br />
<strong>IGCAR</strong>. The CWCP comprises<br />
of six no. centrifugal chillers<br />
and allied accessories like<br />
condenser water pump, chilled<br />
water pump, cooling towers etc.<br />
There are two cooling towers of<br />
eight cells each at CWCP,<br />
<strong>IGCAR</strong> to cool the condenser<br />
water of centrifugal chillers.<br />
The per<strong>for</strong>mance of cooling<br />
towers had deteriorated<br />
resulting in frequent<br />
maintenance and high energy<br />
consumption. It has been<br />
observed that during summer<br />
all the 16 cells are put into<br />
service to remove the heat load<br />
of just three chillers and to<br />
maintain the condenser water<br />
inlet temperature within<br />
permissible limit of 305 K. The<br />
per<strong>for</strong>mance of the cooling<br />
towers was evaluated and it was<br />
found that the effectiveness of<br />
the cooling tower is below 40%.<br />
Poor per<strong>for</strong>mance of the<br />
cooling towers has resulted in<br />
Table1 : Cooling tower specification<br />
310 K<br />
310 K<br />
305 K<br />
305 K<br />
301.3 K<br />
301.3 K<br />
5 K at 301.3 K 5 K at 301.3 K<br />
high condenser water inlet run 3-4 chillers and the current<br />
temperature, which eventually taken by each fan is 13 A (8<br />
caused surging in the chillers kW) against 16 A (9.8 kW)<br />
and high-energy consumption. resulting in substantial savings<br />
Also, the wooden fills and in energy.<br />
structures got aged resulting in<br />
frequent maintenance. Hence,<br />
it was decided to upgrade and<br />
revamp the cooling towers as<br />
per the following specification<br />
in Table 1.<br />
After revamping it was found<br />
that 10-12 cells are sufficient to<br />
176 INFRASTRUCTURE FACILITIES
IGC<br />
<strong>Annual</strong> <strong>Report</strong> 2007<br />
VII.5. Variable Refrigerant Flow Air-conditioning System<br />
Variable Refrigerant Flow<br />
(VRF) air-conditioning system<br />
has been introduced <strong>for</strong> the<br />
first time in <strong>IGCAR</strong> at Boron<br />
Enrichment Plant and HASL.<br />
The capacity of the systems is<br />
26TR in each building (Fig.1).<br />
The VRF AC systems are the<br />
next generation in intelligent<br />
and energy efficient airconditioning.<br />
A VRF system<br />
typically consists of an outdoor<br />
unit (Fig.1)with multiple<br />
compressors and different types<br />
of indoor units <strong>for</strong> different<br />
zones or areas (Fig.2 ). It also<br />
comes with a highly<br />
sophisticated electronic control<br />
centre to enable zone wise<br />
climatic control. The VRF<br />
systems offer a wide range of<br />
indoor units wall mounted<br />
splits, ceiling mounted splits,<br />
ductable units, cassettes,<br />
concealed units, etc. The VRF<br />
systems offer immense benefits<br />
such as optimal control of<br />
Fig.1 12.8 TR (16 HP) Outdoor unit<br />
individual spaces, energy<br />
efficiency, compatibility with<br />
Building Management System<br />
(BMS) compatibility, and ample<br />
choice and flexibility in<br />
designing the air-conditioning<br />
system to suit space and<br />
interiors. The VRF systems can<br />
operate at ambient temperature<br />
as high as 325 K<br />
Fig.2 Typical indoor units - Ceiling &<br />
Wall mounted<br />
VII.6. Unique Experience in Installing, Testing and<br />
Commissioning Aerial Bunched Cables<br />
The power supply to<br />
Anupuram Township is being<br />
fed from Central Switching<br />
Station and the present peak<br />
load demand is about 1 MVA. It<br />
is proposed to have further<br />
house construction at<br />
Anupuram cater to the<br />
requirement of BARCF, BHAVINI<br />
and <strong>IGCAR</strong>. The load growth<br />
during 11 th and 12 th plan is<br />
expected to be about 3 MVA.<br />
There are two independent 11<br />
kV feeders to Anupuram, which<br />
feeds the total power<br />
requirement of Anupuram<br />
Township. At a time only one of<br />
the feeders will be in service<br />
and the other feeder will be<br />
kept in hot standby mode. Prior<br />
Fig.1 Cross section of the<br />
ABC cable<br />
INFRASTRUCTURE FACILITIES 177
IGC<br />
<strong>Annual</strong> <strong>Report</strong> 2007<br />
Fig.2 ABC cable suspended from<br />
spun pole<br />
to 1990 both the feeders were<br />
of Overhead line (OH). One of<br />
the feeders was changed from<br />
OH line to Under Ground (UG)<br />
cable in 1995 except the region<br />
in which it crosses the<br />
Buckingham canal. The other<br />
feeder remained as OH line till<br />
2005. The main problem faced<br />
with the OH line is the frequent<br />
tripping during cyclonic and<br />
rainy season either due to flash<br />
over or mechanical damage to<br />
the insulators. The mechanical<br />
breakdown of the porcelain<br />
insulators also contributed to<br />
the trips. In order to improve<br />
the reliability of power supply to<br />
Anupuram, it was decided to<br />
convert the existing OH line to<br />
UG Cable including the partial<br />
OH line in the other feeder.<br />
It was not possible to convert<br />
the entire stretch of the OH line<br />
to UG cable due to site<br />
constraints especially cross over<br />
across the Buckingham canal.<br />
The existing state government<br />
rule restricts the use of UG<br />
cable across the BC. They<br />
specify that the minimum<br />
clearance between the<br />
conductor/cable and water<br />
surface during high tide should<br />
not be less than 6 meters. As<br />
the possibility of widening and<br />
deepening of the canal is not<br />
ruled out, it is not advisable to<br />
provide UG cable. Since the<br />
UG cable is not designed to<br />
take self weight and wind load,<br />
the usage of Aerial Bunched<br />
Cables (ABC) was only option<br />
<strong>for</strong> the application.<br />
ABC is a very novel concept<br />
<strong>for</strong> over head, power<br />
distribution. Compared to<br />
conventional OH line, ABC<br />
provides higher safety and<br />
reliability, lower power losses<br />
and ultimate system economy<br />
by reducing installation,<br />
maintenance and operational<br />
cost. ABC is the best choice <strong>for</strong><br />
power distribution in congested<br />
urban areas with narrow lanes<br />
and by lanes. It is also used in<br />
terrains and bushy area where<br />
excavation is difficult. There are<br />
three of four cores <strong>for</strong> the cable<br />
and the cores are bunched<br />
around a bare messenger<br />
conductor. The messenger<br />
conductor provides the<br />
mechanical strength and takes<br />
care of the wind load. The<br />
typical cross section of the<br />
conductor including the method<br />
of suspension is shown in the<br />
Fig.1. The resistivity of the<br />
messenger conductor also shall<br />
be very low so as to provide low<br />
resistance path <strong>for</strong> the current<br />
flow during unbalanced<br />
loading and during fault<br />
conditions.<br />
After the choice of ABC is<br />
finalized, interaction with the<br />
manufacturers was pursued and<br />
a detailed specification and<br />
estimation was prepared. The<br />
usage of the ABC cable was<br />
limited <strong>for</strong> a size 70 sq. mm<br />
cable. Since we are planning to<br />
design the system <strong>for</strong> a peak<br />
load of 5 MVA by considering<br />
the future growth, the minimum<br />
conductor size needed is<br />
185 sq. mm. An estimate<br />
showed that the cost of using<br />
ABC cable is very high<br />
compared to UG cable <strong>for</strong> the<br />
entire length. Based on further<br />
review, it was decided to use<br />
ABC cable <strong>for</strong> a stretch of 500<br />
m across the canal and <strong>for</strong><br />
about 300 m in the village<br />
where it is not possible to lay<br />
UG cable (Typical Cross section<br />
of the ABC cable is shown in<br />
Fig.1).<br />
Design of ABC cable and<br />
pole supports<br />
By considering the load<br />
growth, the minimum<br />
conductor size was fixed as<br />
185 sq. mm. The messenger<br />
size depends on the maximum<br />
span length and the sag<br />
permissible <strong>for</strong> the above span.<br />
The span length is 70 m and<br />
178 INFRASTRUCTURE FACILITIES
IGC<br />
<strong>Annual</strong> <strong>Report</strong> 2007<br />
the permissible sag is 6 m<br />
above the water surface. By<br />
considering a wind velocity of<br />
150 km/h and a safety factor of<br />
2 the messenger size is fixed as<br />
150 Sq. mm. Each core of the<br />
cable is constructed similar to<br />
an XLPE cable and is screened<br />
with thin copper flat and having<br />
extruded outer sheath. The<br />
outer sheath along with the<br />
black tape protects the cable<br />
against UV radiation while<br />
exposed to sunlight.<br />
Special type suspension<br />
clamps and end clamps<br />
required to support it from the<br />
poles are available in India.<br />
Rein<strong>for</strong>ced Cement Concrete<br />
(RCC) poles are being used <strong>for</strong><br />
suspending transmission lines<br />
and its designed load is only up<br />
to 500 kg. Due to its limited<br />
load bearing capacity, the<br />
usage of RCC pole is not found<br />
to be feasible. Further enquiry<br />
resulted in the selection of Spun<br />
poles <strong>for</strong> this special<br />
application. These poles are<br />
manufactured by a special<br />
process and the load bearing<br />
capacity is up to 1000 kg. The<br />
poles were load tested at<br />
factory site and found suitable<br />
<strong>for</strong> our application. In order to<br />
improve the safety margin extra<br />
stay sets were provided (the<br />
Fig.2 shows the details of ABC<br />
Suspension from Spun pole).<br />
Supply, installation testing<br />
and commissioning of the cable<br />
The cable was manufactured<br />
by M/s Torrent cables<br />
according to our specification<br />
and was tested at factory to<br />
ensure that it meets the<br />
required specifications. The<br />
spun poles were manufactured<br />
by M/s CPC & Co, Madras and<br />
were erected at site by means<br />
of special tackles and tools.<br />
The ABC cable was joined with<br />
UG cable using special straight<br />
through joints. The entire<br />
system is commissioned and is<br />
in service <strong>for</strong> more than six<br />
months.<br />
VII.7. Biometric Attendance Recording System<br />
A Biometric Attendance<br />
Recording system consisting of<br />
37 RFID (Radio Frequency<br />
IDentification) cum hand<br />
geometry readers located at<br />
various buildings of <strong>IGCAR</strong> and<br />
2 servers, all connected over<br />
the campus back bone network<br />
was installed and<br />
commissioned dispensing with<br />
the old manual system of<br />
registers & punching machines.<br />
The main advantages of the<br />
new system are accurate<br />
attendance logging <strong>for</strong> the<br />
complete spectrum of<br />
employees, elimination of proxy<br />
punching and finally security. ICNo., Name, Division,<br />
RFID cards issued to the Section, reference hand<br />
employees store employee's template along with two 48 bit<br />
Fig.1 Architecture of biometric recording system<br />
INFRASTRUCTURE FACILITIES 179
IGC<br />
<strong>Annual</strong> <strong>Report</strong> 2007<br />
reports by means of employee<br />
login facility.<br />
Fig.2 Employee registering attendance through biometric system<br />
secure keys. These two keys<br />
ensure the security of data<br />
stored in the card and make the<br />
card tamper proof. The system<br />
architecture is shown in Fig.1.<br />
individual PCs connected on<br />
the <strong>IGCAR</strong> intranet. The web<br />
server provides various reports<br />
related to the entire centre or a<br />
particular section / Division /<br />
The servers acquire<br />
Group depending the official<br />
accessing the reports. Thus all<br />
transaction data from all the 37<br />
readers and store them in the<br />
ORACLE database. The server<br />
also contains a web server<br />
which can be accessed via the<br />
the senior officials are provided<br />
with Username and a password<br />
<strong>for</strong> monitoring the attendance<br />
of staff reporting to them. Apart<br />
from this, all the employees<br />
standard web browser of also can access their individual<br />
Readers are having the facility<br />
to store 10,000 transactions<br />
even in the case of failure of<br />
communication <strong>for</strong> a long time.<br />
Also all the readers are<br />
provided with redundant power<br />
supply (battery which can<br />
operate <strong>for</strong> a period of 8 hours<br />
incase failure of mains supply)<br />
and the servers are provided<br />
with UPS which shall provide<br />
backup <strong>for</strong> a period of 4 hours<br />
incase of power failure. All the<br />
RFID cum biometric reader's<br />
clocks are updated by the<br />
server every 10 seconds,thus<br />
the time stamping of all the<br />
transactions from the readers<br />
shall have the same Real Time<br />
Clock (RTC). Figure 2 shows an<br />
employee registering<br />
attendance using new biometric<br />
system.<br />
VII.8. Monitoring of Coastal Waters: Occurrence of<br />
Trichodesminum erythraeum (Ehr.) Bloom<br />
in the Coastal Waters of Kalpakkam<br />
Trichodesmium erythraeum, a<br />
marine cyanobacterium, is an<br />
important nitrogen-fixer in the<br />
sea. It is one of the common<br />
bloom-<strong>for</strong>ming species found in<br />
tropical and sub-tropical<br />
waters, particularly in the<br />
eastern tropical Pacific and<br />
Arabian Sea, contributing ><br />
30% of the algal blooms.<br />
Estimated global nitrogen<br />
fixation by Trichodesmium<br />
bloom (~ 42 Tg N yr-1) and<br />
during nonbloom conditions (~<br />
20 Tg N yr-1) suggests that it is<br />
likely to be the dominant<br />
organism in the global ocean<br />
nitrogen budget. In the east<br />
coast of India, phytoplankton<br />
blooms are common during<br />
February to May when the<br />
prevailing hydrobiological<br />
conditions are relatively stable.<br />
During this period, due to the<br />
180 INFRASTRUCTURE FACILITIES
IGC<br />
<strong>Annual</strong> <strong>Report</strong> 2007<br />
Fig. 1 Yellowish-green streaks of trichodesmium observed<br />
in the coastal waters of Kalpakkam<br />
western Bay of Bengal current<br />
(WBC) a phenomenon called<br />
upwelling occurs bringing<br />
highly nutrient enriched bottom<br />
water to the surface and thus<br />
found to enhance<br />
phytoplankton growth. During a<br />
regular coastal water<br />
monitoring program, a<br />
prominent discolouration of the<br />
surface water was noticed in<br />
the coastal waters of<br />
Kalpakkam on 16 th March<br />
2007. The bloom was very<br />
dense and created yellowishgreen<br />
coloured streaks (Fig.1)<br />
of about 5 m width and<br />
extended to a few hundred<br />
metres. The phytoplankton<br />
responsible <strong>for</strong> discolouration<br />
was identified as<br />
Trichodesmium erythraeum<br />
(Fig.2). Although, bloom of<br />
Noctiluca scintillans and<br />
Asterionella glacialis has been<br />
reported in the coastal waters<br />
of the Kalpakkam, there has<br />
been no report of 'green tide'<br />
<strong>for</strong>mation by Trichodesmium<br />
erythraeum. One of the<br />
interesting features of this<br />
bloom was that it was sighted<br />
only <strong>for</strong> one day and drastically<br />
declined on the next day with<br />
negligible Trichodesmium cell<br />
density. Such a sudden<br />
appearance and decline in<br />
bloom <strong>for</strong>ming organisms in<br />
general and Trichodesmium in<br />
particular is very peculiar and<br />
interesting. The three different<br />
phases of a typical<br />
phytoplankton bloom such as,<br />
the exponential phase (log<br />
phase), peak & senescent<br />
phase (lag phase) could not be<br />
seen during this observation as<br />
usually observed <strong>for</strong> any<br />
bloom. Its appearance if<br />
continued <strong>for</strong> a relatively longer<br />
period, could have significantly<br />
affected not only the<br />
commercially important marine<br />
species but also the lives of<br />
people who consume fishes. As<br />
this species has been identified<br />
as toxic and reported to<br />
contain neurotoxin commonly<br />
associated with paralytic<br />
shellfish<br />
poisoning.<br />
Interestingly, the bloom was<br />
sighted just after the southwest<br />
to northeast monsoon transition<br />
during which the current<br />
direction changes from<br />
equator-ward to pole-ward in<br />
Bay of Bengal. Close<br />
monitoring of the coastal<br />
waters during this period with<br />
respect to chemical and<br />
biological characteristics<br />
revealed significant changes in<br />
its quality. An abrupt increase<br />
in ammonia and phosphate<br />
content was noticed on the day<br />
of bloom. Phosphate values<br />
reached a maximum of 2.56<br />
µmol l -1 with the peak<br />
coinciding with the day of<br />
highest cell density. This<br />
appears to be about 10 times<br />
higher than the normal<br />
phosphate values encountered<br />
Fig.2 A bunch of trichodesmium erythraeum diatoms<br />
INFRASTRUCTURE FACILITIES 181
IGC<br />
<strong>Annual</strong> <strong>Report</strong> 2007<br />
in the coastal waters.<br />
Concentration of ammonia was<br />
unexpectedly high (126.72<br />
µmol l -1 ) on the day of bloom,<br />
which could be ascribed to the<br />
diazotrophic nature of<br />
Trichodesmium, which depicts<br />
its ability to produce ammonia<br />
from dinitrogen through the<br />
process of nitrogen fixation.<br />
This level of ammonia if<br />
sustained <strong>for</strong> a longer period<br />
could seriously affect the fish<br />
population. There<strong>for</strong>e it is<br />
imperative to monitor coastal<br />
waters at a regular and close<br />
frequency to observe any subtle<br />
change in its physico-chemical<br />
and biological characteristics<br />
due to such natural events as<br />
above.<br />
VII.9. Development of Medicinal Plants at <strong>IGCAR</strong><br />
Herbal remedies have<br />
become increasingly popular as<br />
more and more people are<br />
health conscious and seek<br />
natural and safer products. This<br />
statement holds greater<br />
significance when it comes to a<br />
society dedicated to science<br />
and technology. In our fast<br />
track life searching <strong>for</strong> new<br />
horizons and venues of nuclear<br />
energy; keeping in mind the<br />
prime health of our community<br />
cultivation of medicinal herbs<br />
have been initiated in the<br />
<strong>IGCAR</strong> project site.<br />
With the natural green<br />
habitats shrinking day-by-day it<br />
is most appropriate that<br />
cultivation and conservation of<br />
medicinal plants <strong>for</strong> the benefit<br />
of human beings has been<br />
thought of at this site.<br />
India is bestowed with a<br />
treasure of medicinal<br />
plants.The Indian system of<br />
medicine has identified around<br />
15000 medicinal plants of<br />
which 500 species are<br />
commonly used in the<br />
preparation of medicinal drugs.<br />
Fig.1Scoparia Dulsis<br />
(curing diabetes)<br />
Fig.2 Asparagus Racemosus<br />
(<strong>for</strong> urinary problem)<br />
Fig.3 Andragraphics Paniculata<br />
(snake bite)<br />
Fig.4 Talinum Triangulare (remote<br />
blood clot)<br />
182 INFRASTRUCTURE FACILITIES
IGC<br />
<strong>Annual</strong> <strong>Report</strong> 2007<br />
Nearly 7000 medicinal<br />
plants are being used in<br />
Ayurveda medicines, 700 in<br />
Unani medicine, 600 in Sidha<br />
medicine, 450 in homeopathy<br />
and 30 in modern medicines.<br />
Some of the important herbal<br />
plants in the project site and its<br />
uses have been described<br />
below.<br />
The idea of cultivating mainly<br />
is to create awareness not only<br />
among the scientists, personnel<br />
but also among the children in<br />
the vicinity. Plants mentioned<br />
above are cultivated as part of<br />
Phase-I program which is<br />
already completed. A separate<br />
area of 8000sqm is identified<br />
<strong>for</strong> the purpose of medicinal<br />
garden consisting of varieties<br />
of herbal plants. Besides<br />
medicinal drugs, these plants<br />
are also used in various<br />
industries <strong>for</strong> producing other<br />
herbal products.<br />
VII.10. Library Document Management System<br />
During the 10th plan period,<br />
Scientific In<strong>for</strong>mation Resource<br />
Division (SIRD) has procured<br />
around 4500 reports and<br />
digitized more than 5500<br />
documents on Fast Reactor<br />
Technology.<br />
Digitization and subsequent<br />
management documents need<br />
a specified software system<br />
which can manage and provide<br />
access to the relevant<br />
documents to multiple users.<br />
OmniDocs is a scalable,<br />
secure, multi-user Document<br />
Management and Workflow<br />
system. It allows users to<br />
manage image as well as<br />
electronic documents in a<br />
single central repository. It<br />
provides a central facility to<br />
store documents that can be<br />
accessed and shared between<br />
multiple users, across<br />
departments, multiple<br />
locations, and the entire<br />
enterprise. It manages the<br />
entire Document Lifecycle<br />
process.<br />
Document Management System at SIRD<br />
SIRD has made the document<br />
management systems web<br />
accessible with graphical user<br />
interface that supports extensive<br />
Document Management and<br />
workflow operations such as<br />
document acquisition, scanning<br />
support, and annotation<br />
support. It also helps online<br />
<strong>for</strong>m processing, automatic<br />
data capture, version control,<br />
and document delivery <strong>for</strong><br />
efficient document processing.<br />
INFRASTRUCTURE FACILITIES 183
AWARDS & HONOURS<br />
Dr. Anish Kumar, Metallurgy & Materials Group has been selected <strong>for</strong> the prestigious INSA Young<br />
Scientist Award <strong>for</strong> the year 2007<br />
Dr. Baldev Raj has been honored with the prestigious Padmashri Award by Government of India. He has<br />
received the Meritorious Contribution Award <strong>for</strong> 2006 from NACE International India Section. He has been<br />
awarded the prestigious the National Metallurgist Award-2007 (<strong>Research</strong>-Academy) by Ministry of Steel,<br />
Govt. of India and Indian Institute of Metals. He has been awarded the prestigious Life Time Achievement<br />
Award of Indian Institute of Welding. He has also received Stanley Ehrilich Gold Medal during the National<br />
Symposium on Acoustics (NSA-2007),<br />
Dr. P. Chellapandi, Reactor Engineering Group has been awarded "Mechanical Engineering Design<br />
Award - 2006" by The Institution of Engineers, India.<br />
Shri. S.C. Chetal, Reactor Engineering Group has been conferred National Design Award by The Institution<br />
of Engineers, India.<br />
Shri. Chittaranjan Das, Metallurgy & Materials Group has been selected <strong>for</strong> the ASM young<br />
metallurgist award, Chennai chapter<br />
Dr. U. Kamachi Mudali, Corrosion Science & Technology Division has been elected as a Fellow of the<br />
Indian Institute of Metals <strong>for</strong> 2006.<br />
Dr. C.K.Mukhopadhyay, Non-Destructive Examination Division has been selected to receive the ISNT<br />
National NDT Award under the category excellence in contribution to research &<br />
development, jointly sponsored by ISNT & M/s. Electronic & Engineering Co., Mumbai, <strong>for</strong> the year 2007.<br />
Shri. R. Natarajan, Reprocessing Group has been awarded INS - Award - 2006 by Indian Nuclear Society.<br />
Dr. S. Ningshen has been awarded the NACE International India Section (NIIS) Best Ph.D award in the<br />
field of Corrosion Science <strong>for</strong> the Year 2007.<br />
Mrs. B. Sasi, Non-destructive Evaluation Division has been awarded R.Chandrasekhar Memorial Prize <strong>for</strong><br />
Best Industry-oriented research work during National Seminar on Physics & Technology of Sensors<br />
(NSPTS-12) held during March 2007 at Mumbai.<br />
Shri. Sumantra Mandal from Materials Development and Characterisation Group has been selected <strong>for</strong><br />
INAE Young Engineer Award <strong>for</strong> the year 2007.<br />
Dr. A. K. Tyagi, Materials Science Division has been awarded the MRSI Medal<br />
Materials <strong>Research</strong> Society of India (MRSI).<br />
<strong>for</strong> the year 2008 by<br />
Dr. Vidhya Sundararajan, Strategic & Human Resources Planning Section has received the Tamil Nadu<br />
Young Women Scientist Award <strong>for</strong> the year 2006.<br />
Dr. M. Vijayalakshmi, Physical Metallurgy Division has been awarded the Metallurgist of the Year Award<br />
<strong>for</strong> the year 2007 by Ministry of steels and Indian Institute of Metals.<br />
<strong>IGCAR</strong> has won the First Prize <strong>for</strong> the category "Mass Awareness Campaign" <strong>for</strong> the year 2006-07. The<br />
apex national PR body, Public Relations Society of India (PRSI) has honoured the <strong>Centre</strong> <strong>for</strong> its team<br />
ef<strong>for</strong>ts in the mass campaign <strong>for</strong> the role of Fast Breeder Reactors in ensuring the energy security <strong>for</strong> India.<br />
184
PUBLICATIONS - 2007<br />
Journal Publications<br />
Journal Publications(IN-Press)<br />
408<br />
269<br />
Publications<br />
Procedings<br />
Internal <strong>Report</strong>s<br />
in Conference<br />
84<br />
435<br />
BOOKS<br />
1. B.P.C. Rao, "Practical Eddy Current Testing", Series editors: BaldevRaj and B. Venkatraman,<br />
Narosa publishing house, New Delhi, 2007.<br />
2. Frontiers in Design of Materials, Baldev Raj, S.Ranganathan, S.L.Mannan, K. Bhanu Sankara Rao,<br />
M.D.Mathew and P.Shankar (Eds.), (2007), Series in Metallurgy and Materials Science, University<br />
Press, Hyderabad.<br />
3. P. Kalyanasundaram, C.K. Mukhopadhyay and S.V. Subba Rao, "Practical Acoustic Emission",<br />
Series editors: Baldev Raj and B. Venkatraman, Narosa publishing house, New Delhi, 2007.<br />
4. Nuclear Fuel Cycle Technologies: Closing the Fuel Cycle, Ed. Baldev Raj and P.R. Vasudeva Rao,<br />
BRNS, Mumbai (2006).<br />
5. Advances in Materials Characterization, G. Amarendra, Baldev Raj and M. H. Manghnani (Eds.)<br />
(2007), University Press, Hyderabad.<br />
PATENTS<br />
1. C. Ramesh, N. Murugesan, S.Velmurugan, A. A.M. prince, V. Ganesan, S. V. Narasimhan,<br />
A Measuring system <strong>for</strong> on-line measurement of corrosion rate of metals in an aqueous<br />
medium, Patent No. 204092, Date of Grant: 26-12-2006.<br />
2. Title of the Invention: High Strength and Highly Precipitated Austenitic Stainless, Steels,<br />
Inventors : Kinkar Laha, Junro Kyono and Norio Shinya Japanese Patent No: 3975275<br />
185
Colloquia, Seminars and Conferences - 2007<br />
IGC Colloquia<br />
1. Nuclear Fusion as a Future Energy Resource by Dr. D.D.Sood, Former Director,<br />
RC &IG, BARC on 2, Jan 2007.<br />
2. India's Nuclear Power Programme-Yesterday, Today and Tomorrow by Shri S. K. Jain,<br />
Chairman & Managing Director, NPCIL on 31, Jan 2007.<br />
3. Vignettes of Indian Armed Forces by Lt.Gen. B.J.Gupta, Commandant, Defence Services<br />
Staff College, Wellington, Tamil Nadu on 19, Feb 2007.<br />
4. Recent Advances in Computational Science and Engineering by<br />
Shri. H.S. Kushwaha , Director, HS&EG,BARC- 16, Mar 2007.<br />
5. Role of Satish Dhawan Space <strong>Centre</strong> - Space Port of India in the Indian Space Program &<br />
Space Capsule Recovery Experiment by Dr.K.Viswanathan -SHAR,ISRO on 19, Mar2007.<br />
6. In principle predictability of earthquakes by Prof. G.Ananthakrishna , IISc,Bangalore on<br />
4, Jul 2007.<br />
7. Plant Life Management of Nuclear Power Plants by Dr. Philip Tipping , Senior Scientific<br />
Officer, Swiss Federal Nuclear Safety Inspectorate , SWITZERLAND on 11, Oct 2007.<br />
8. Nuclear and Non-Nuclear Safety Basis by Dr. J.C.Laul, Los Alamos National Laboratory,<br />
Los Aalmos, New Mexico, USA on 31, Oct 2007.<br />
9. A Historical Review of Reactor Safety by Prof. Bal Raj Sehgal, Nuclear Power Safety<br />
Royal Institute of Technology , Alba Nova University Center , Stockholm, Sweden on<br />
7, Nov 2007.<br />
10. Structure of the <strong>Atomic</strong> Nucleus and Origin of the Universe by Dr. Dominique Goutte,<br />
Director, Dept. of Energy in the French Ministry of <strong>Research</strong> (<strong>for</strong>mer Director of GANIL)<br />
at Caen on 26, Nov 2007.<br />
11. Photonic Band Gap Materials: Semiconductors of Light by Prof. Sajeev John ,<br />
Department of Physics, University of Toronto, Ontario, CANADA , on 24, Dec 2007.<br />
Special Lectures<br />
12. Personality Development and Stress Management by Dr.Sambanthan on 10, Feb 2007.<br />
13. Remote Sensing from Orbital Plat<strong>for</strong>ms <strong>for</strong> Evaluation of Natural Resources by<br />
Dr.P.Manavalan , ISRO, Bangalore organised by Indian Association <strong>for</strong> Radiation<br />
Protection on 15, Feb 2007.<br />
14. Complexation of Actinides in Solution : Thermodynamic Measurements and Structural<br />
Characterisation - Seaborg Memorial Lecture by Dr. Linfeng Rao,Senior Scientist LBNL,<br />
Berkeley,USA 21-22, Feb 2007.<br />
15. Special Lecture by Dr. Kamala Selvaraj, Modern Developments in Treatment of infertility<br />
on the Occasion of International Women's Day on 8, Mar 2007.<br />
16. Engineering Village-2, Elsevier Talk on 17, Apr 2007.<br />
17. Science and Spirituality: A Modern Look at Ancient Indian View Point by<br />
Prof. T.R. Anantharaman on 28, Jun 2007.<br />
18. Enrichment of Boron <strong>for</strong> Fast Reactor Control Rod Application, IE Colloquium by<br />
Dr. C. Anand Babu, Head, ST&HD, FRTG on 29, Jun 2007.<br />
19. Global Warming by Dr.Shankar , IMSc., Chennai organized by Tamil Nadu Science Forum<br />
on 2, Oct 2007.<br />
20. Resuscitation of Sudden Cardiac Arrest, World Anesthesia Day - Lecture by<br />
Dr. K.Mathiyalagan organized by AARCO on 16, Oct 2007.<br />
21. Measuring and Assessing Science, Vikram Sarabhai Memorial Lecture by<br />
Prof. P. Balaram, Director, IISc. on 18, Dec 2007.<br />
186
Seminars, Workshops and Meetings<br />
22. Technical Meeting (Third <strong>Research</strong> Co-ordination Meeting) of the CRP on Studies of<br />
Advanced Reactor Technology Options <strong>for</strong> Effective Incineration of Radioactive Waste<br />
Hosted by <strong>IGCAR</strong> at Chennai, 15-19, Jan 2007.<br />
23. Industrial Training Course on Intelligent Instrumentation System 22-26, Jan 2007.<br />
24. CEA-<strong>IGCAR</strong> Technical Seminar on LMFBR Safety Aspects Related to Severe Accidents,<br />
Kalpakkam, 12-16, Feb 2007.<br />
25. DAE Anu Week Celebrations - 2007 at VIT University, Vellore, 13-17, Feb 2007.<br />
26. Quality Circle Case Study by Star and Samurai QCs on 8, Mar 2007.<br />
27. Seminar on Emerging Trends in Electron Microscopy, IIM and <strong>IGCAR</strong> on 22, Mar 2007.<br />
28. Workshop on Synthesis and Characterisation of Advanced Functional Materials,<br />
26-28, Mar 2007.<br />
29. Seminar on "Technological Developments in CaSO4:Dy TLD Phosphor and BaFBr:Eu<br />
Image Storage Phosphor" by Dr. A.R. Lakshmanan, President, IARP, Kalpakkam Chapter<br />
and Former Head, Radiation Dosimetry Section, RSD, <strong>IGCAR</strong> on 11, Apr 2007.<br />
30. International Workshop on Imaging NDE-2007, 25 - 28, Apr 2007.<br />
31. ASTM Standards Workshop organised by <strong>IGCAR</strong> and Anna University on 6 Jun 2007.<br />
32. Training Programme on "Disaster Management", 22-23, Jun 2007.<br />
33. Management of Water Resource and Nuclear Waste Repository, on 27, Jun 2007.<br />
34. Quality Circle Case Study by M.S. Ashok Leyland, Chennai on 6 Jul 2007.<br />
35. "Web Tools and IT Enabled Services" - Pre-conference Tutorial, READIT-2007 on<br />
11, Jul 2007.<br />
36. READIT-2007 - Conference on In<strong>for</strong>mation to Knowledge: Technology and Professionals,<br />
Kalpakkam, 12-13, Jul 2007.<br />
37. DAE Workshop on "Nuclear Energy <strong>for</strong> National Development and Environmental<br />
Sustainability" (WONDER - 2007) at Chennai, 19-21, Jul 2007.<br />
38. In<strong>for</strong>mation Security from Obscurity to Knowledgeable Practice by Shri Sekhar<br />
Sethuraman, Head, IT Security - Greater Asia, LexisNexis on<br />
31, Jul 2007.<br />
39. Colloquium on Evaluation of Quality Circles on 27, Sep 2007.<br />
40. Quality Circles <strong>Annual</strong> Meet (QCAM-2007) 6 - 7, Sep 2007.<br />
41. Discussion Meeting on Fusion Reactor Materials and Manufacturing Technologies,<br />
Kalpakkam on 14, Sep 2007.<br />
42. Hindi Fortnight - 2007 , 14-24, Sep 2007.<br />
43. Training Program on "Web Design <strong>for</strong> Knowledge Exchange" organised by AARCO &<br />
<strong>IGCAR</strong> , 17 -22, Sep 2007.<br />
44. Convergence of Technologies <strong>for</strong> Rapid Development: Institution of Engineer's Day<br />
Celebrations on 8, Oct 2007.<br />
45. AIM -<strong>IGCAR</strong> Academia Meet on 12, Oct 2007.<br />
46. 14th National Convention of Electro Chemists, 6 - 7, Dec 2007.<br />
47. Workshop on Industrial Safety, 28-29, Nov 2007.<br />
48. CEA-<strong>IGCAR</strong> Technical Seminar on Liquid Metal Fast Reactor Safety Functions<br />
Strategy - Experience and Strategy <strong>for</strong> Future Plants. Kalpakkam, 19-21, Dec 2007.<br />
Nurturing Activities<br />
49. Summer Training in Physics and Chemistry (STIPAC 07), a six weeks summer training<br />
programme in Physics and Chemistry <strong>for</strong> final year M.Sc., (Physics/Chemistry) students from<br />
28, May 2007 to 6, Jul 2007.<br />
50. Graduation Day Celebration of Training School at <strong>IGCAR</strong> on 4, Sep 2007.<br />
51. Professor Brahm Prakash Memorial Materials Quiz-2007, an annual event of Materials Quiz<br />
organized <strong>for</strong> students of Class XI and XII, An International Event, on 13, Oct 2007.<br />
52. SIRD - Quiz on 5, Dec 2007.<br />
187
NEWS & EVENTS<br />
Memorandum of Understanding between <strong>IGCAR</strong> and UGC-DAE-CSR - January 16, 2007<br />
Dr. Baldev Raj, Director, <strong>IGCAR</strong> and Dr.<br />
Praveen Chaddah, Director, UGC- DAE-<br />
CSR following the signing of MoU<br />
between <strong>IGCAR</strong> and UGC-DAE CSR..<br />
A Memorandum of Understanding between <strong>IGCAR</strong> and UGC-DAE<br />
CSR was signed on January 16, 2007, at Kalpakkam. Under this<br />
agreement, <strong>IGCAR</strong> will open its medium sized, but high<br />
technology facilities <strong>for</strong> University researchers to promote<br />
collaborative research in the area of Physical, Chemical and<br />
Engineering Sciences. This MoU envisages the creation of a UGC-<br />
DAE CSR Node at Kalpkkam, that will house high-end research<br />
facilities that would be open to University researchers. The Node<br />
would help to foster an active collaboration between DAE and<br />
the academic institutions through the involvement of young<br />
research scholars.<br />
Joint Meeting of the Indian Nuclear Society and American Nuclear Society -<br />
January 19-20, 2007<br />
A Delegation of the American Nuclear Society (ANS) visited Kalpakkam during January 19-20,<br />
2007. The ANS delegation was led by Dr. Harold McFarlane, President, ANS and the INS delegation<br />
was led by Dr. Placid Rodriguez, President, INS. The ANS delegation consisted of Dr. Harold Finley<br />
McFarlane, President, American Nuclear Society; D-ALD, INL, Dr. James Lake, Past President, ANS;<br />
Battelle Executive, Dr. Alireza Haghighat, Chairman, NEDHO; Chair NE Dept. University of Florida,<br />
Dr. Arvind Kumar, Chair NE Dept. University of Missouri, Mr. Arthur DiGiovine, Vice-President,<br />
Studsvik ScandPower, Inc., Dr. Atambhir Singh Rao, Int'l Committee, ANS; Nuclear Energy<br />
Directorate, IAEA, Dr. Samit Bhattacharyya, President, RENMAR and Dr. Dennis Berry, Director,<br />
Nuclear Programs, Sandia. The INS delegation consisted of Dr. Placid Rodriguez, President, Indian<br />
Nuclear Society, Mumbai, Shri S.C. Chetal, Director, Reactor Engineering Group, <strong>IGCAR</strong>, Shri P.<br />
Swaminathan, Shri G.D. Mittal, Secretary, Indian Nuclear Society, Mumbai, Dr. V. Ganesan,<br />
Treasurer, Indian Nuclear Society, Kalpakkam Branch, Dr. M.L. Jhoshi, Head, Health Physics<br />
Division, BARC, Dr. R.R. Puri, Head, Human Resources Development Division, BARC and Dr. M. Sai<br />
Baba, Head, Strategic & Human Resources Planning Section, <strong>IGCAR</strong>. The ANS delegates visited some<br />
of the facilities at <strong>IGCAR</strong>, MAPS, BHAVINI, BARCF and SRI at Kalpakkam on January 19, 2007. On<br />
January 20, 2007, a joint workshop of the two societies on the theme "Preparing <strong>for</strong> the Nuclear<br />
Renaissance: Strategies <strong>for</strong> Human Resources Development and Nuclear Knowledge Management"<br />
was held with opening remarks by Dr. Placid Rodriguez, President, INS. A number of presentations<br />
were made by members of INS and ANS delegations on the theme.<br />
DAE Anu Week Celebrations-2007, VIT University, Vellore - February 13-17, 2007<br />
Public Relations Activities Implementation Committee (PRAIC) of <strong>IGCAR</strong> organized the DAE's<br />
prestigious 'Anu Week Celebrations 2007' on the theme "Unleashing the energy of nuclei <strong>for</strong> a<br />
sustainable future" in collaboration with the VIT University, Vellore during February13-17, 2007 in<br />
the University campus. The programme included a 5-day DAE Exhibition, a two-day Workshop <strong>for</strong><br />
secondary school science educators and target specific Essay, Quiz, Elocution & Cartoon Contests<br />
in English and Tamil <strong>for</strong> students of various classes from schools and colleges situated in and<br />
around Vellore district.<br />
Dr.Baldev Raj, Distinguished Scientist and Director, <strong>IGCAR</strong> inaugurated the Celebrations, and<br />
Shri.Prabhat Kumar, Project Director, BHAVINI declared the exhibition open. Theme address was<br />
delivered by Dr. S.K.Malhotra, Head, Public Awareness Division, DAE, Mumbai. Shri G Viswanathan,<br />
188
Hon'ble Chancellor, VIT University presided over the inaugural ceremony, along with other<br />
dignitaries of VIT. Shri. P.V.Ramalingam, Director, ROMG, <strong>IGCAR</strong> proposed the vote of thanks.<br />
Resource persons from <strong>IGCAR</strong>, MAPS, BARC & DAE covered the multifaceted applications of<br />
radiation and radioisotopes <strong>for</strong> the benefit of mankind, during the teachers' workshop. In<strong>for</strong>mal<br />
contests were conducted <strong>for</strong> the participants. Field visits were organized on the third day <strong>for</strong> the<br />
teachers to the Christian Medical College (CMC), Vellore and BHEL, Ranipet and the use of<br />
radioisotopes in the healthcare and industry were demonstrated to them. During the<br />
valedictory function on February 17, 2007, the Chief Guest Shri S.Krishnamurthy, Station<br />
Director, MAPS distributed certificates and prizes in the <strong>for</strong>m of gift exchange vouchers <strong>for</strong> books<br />
<strong>for</strong> a total value of Rs.60,000/- to the winners and runners of various contests.<br />
The academia and the general public in this semi-urban part of Tamil Nadu were excited and<br />
benefited by participating in the Celebrations, which had helped to spread the awareness about<br />
the activities of the Department of <strong>Atomic</strong> Energy.<br />
Visit of delegates from the Japan Energy Safety Organisation, Japan - March 1, 2007<br />
Dr. Hirofumi Haghihara and Dr. Masaki<br />
Nakagawa from Japan Energy Safety<br />
Organisation , Japan with Dr. P.R.<br />
Vasudeva Rao, Director, CMMG and<br />
Dr. M. Sai Baba Head , S&HRP <strong>IGCAR</strong><br />
Dr.Hirofumi Haghihara, Associate Vice-president and In-charge<br />
of International Cooperation and Dr.Masaki Nakagawa, Senior<br />
Officer, International Affairs Group, Safety In<strong>for</strong>mation<br />
<strong>Research</strong> Division from the Japan Energy Safety Organisation<br />
visited the <strong>Centre</strong> on March 1, 2007 and held discussions with<br />
the Director, and senior scientists at <strong>IGCAR</strong> on safety related<br />
issues of Fast Reactors. Presentations on behalf of <strong>IGCAR</strong> were<br />
made by scientists of the <strong>Centre</strong> and the visitors also gave a<br />
presentation of their mission. The delegates visited various<br />
laboratories of the <strong>Centre</strong>.<br />
Visit of IBSA delegation on Nanotechnology - April 6, 2007<br />
Prof. J.A. Brum, Brazil, Dr. Baldev Raj<br />
and Dr. T. Hille, South Africa during the<br />
meeting at <strong>IGCAR</strong> on April 6, 2007<br />
A twelve member overseas delegation, comprising six<br />
scientists from Brazil and six from South Africa led by Prof. J.A.<br />
Brum and Dr. T. Hillie respectively, visited <strong>IGCAR</strong> on April 6,<br />
2007 under India-Brazil- South Africa (IBSA) initiative on<br />
Nanotechnology. Dr. Baldev Raj, Director, <strong>IGCAR</strong>, is the coordinator<br />
of IBSA nanotechnology initiative from India. The<br />
delegation also visited Indian Institute of Technology (IIT),<br />
Delhi and Inter University Accelerator <strong>Centre</strong> (IUAC), Delhi on<br />
April 2nd 2007, Bhabha <strong>Atomic</strong> <strong>Research</strong> <strong>Centre</strong> (BARC) and<br />
Tata Institute of fundamental <strong>Research</strong> (TIFR) at Mumbai on<br />
April 3 and 4 2007 and Indian Institute of Science<br />
(IISc),Bangalore on April 5th 2006. The visits were coordinated by <strong>Indira</strong> <strong>Gandhi</strong> <strong>Centre</strong> <strong>for</strong><br />
<strong>Atomic</strong> <strong>Research</strong> (<strong>IGCAR</strong>), Kalpakkam on behalf of DST, India. It was ensured that experts in<br />
nanotechnology from all parts of India participate in the discussions in at least one of the above<br />
mentioned destinations, to present and evolve their ideas <strong>for</strong> collaborative projects under this<br />
initiative.<br />
The IBSA nanotechnology initiative is a trilateral collaborative program between the<br />
Departments of Science and Technology of three participating countries, namely, India, Brazil<br />
and South Africa. The objective of this initiative is to <strong>for</strong>mulate tri- and bilateral mega<br />
collaborative programs in the area of nanotechnology, of mutual interests to the participating<br />
nations. The accepted priority areas of common national interest to all three countries under<br />
this initiative include, advanced materials, energy systems, sensors, catalysis, health (TB and<br />
Malaria), water treatment, agriculture and environment.<br />
189
Summer Training in Physics and Chemistry (STIPAC 07) - May 28 to July 6, 2007<br />
Students, Faculty Members and Organizers of STIPAC - 07<br />
Like in the past, this year too a six week summer training program in physics and chemistry<br />
(STIPAC-07) was organized by <strong>Indira</strong> <strong>Gandhi</strong> <strong>Centre</strong> <strong>for</strong> <strong>Atomic</strong> <strong>Research</strong> -Kalpakkam <strong>for</strong><br />
students entering their final year of regular or integrated M.Sc (Physics/Chemistry) during<br />
May, 28 - July 6, 2007. This six week long programme comprised of both theoretical lecture<br />
courses and hands-on laboratory experience through projects. This programme was aimed at<br />
motivating the students to pursue a career in research. The theme <strong>for</strong> this year's course was<br />
Physics and Chemistry of Nanomaterials.<br />
Forty students (Twenty from Physics and twenty from Chemistry) were selected from about<br />
500 applicants in physics and chemistry. The selection was done based on their academic track<br />
record and the write-up on "why you think size matters in the physical & chemical properties of<br />
matter". Care has been taken to select students from as many states as possible and as many<br />
universities/colleges as possible. This resulted in selecting 20 students from within Tamilnadu<br />
and 20 students from outside representing 10 states <strong>for</strong> both the disciplines. The selected<br />
students are provided a stipend of Rs. 3000/- per month, and their travel expenses are<br />
reimbursed.<br />
The six week technical program of STIPAC course consisted of 90 hours of lectures and 90<br />
hours of project work <strong>for</strong> both physics and chemistry students. The guest lectures were 15 and<br />
8 <strong>for</strong> physics and chemistry respectively. The lectures were delivered by senior scientists and<br />
the guest lectures were delivered by eminent speakers drawn from reputed institutes and<br />
universities from all over India. The topics that have been covered during the lectures in<br />
physics include synthesis and characterization of nanomaterials, nanoparticle dispersions and<br />
gels and the influence of size on optical, magnetic, mechanical, electronic and transport<br />
properties. The topics that have been covered in chemistry were classified in three broad<br />
categories namely, core subjects in chemistry, application in nuclear energy programme and<br />
nanoscience & technology. The special lectures covered a variety topics in biotechnology,<br />
nanotechnology, fluorescence of novel organic compounds, ab-initio quantum mechanical<br />
approach in understanding spectroscopy, sensors and storage devices. Students have gained<br />
hands on experience through their project works. They also got the opportunity to listen to the<br />
special lectures on "Random walk" and "Status of sodium cooled fast reactors with closed fuel<br />
cycle" by Dr. Baldev Raj, Director, <strong>IGCAR</strong>; "Opportunities <strong>for</strong> scientists in Fast Breeder Reactor<br />
Technology " by Shri. Prabhat Kumar, Project Director, BHAVINI and "Key elements of Periodic<br />
Table - Relevance to DAE" by Dr. P.R. Vaudeva Rao, Director, CG& MMG.<br />
190
WONDER-2007<br />
DAE Workshop on 'Nuclear Energy <strong>for</strong> National Development and Environmental<br />
Sustainability' July 19-21, 2007 - Loyola College, Chennai<br />
For the first time in this region, a<br />
3-day workshop exclusively <strong>for</strong><br />
the University and College<br />
Professors of Physical and Life<br />
Sciences and allied disciplines<br />
was jointly organized by DAE at<br />
Loyola (Autonomous) College,<br />
Chennai during July 19-21, 2007.<br />
The response was over-whelming<br />
and 250 teaching faculty were<br />
short-listed and registered.<br />
Preference was given to those<br />
belonging to Institutions situated<br />
in and around Chennai city. The<br />
Workshop was inaugurated by<br />
Dr. S.K. Sharma, Chairman, AERB, a addressing the crowd<br />
Dr.S.K.Sharma, Chairman, AERB.<br />
He highlighted the stringent<br />
safety standards and regulations being adhered to in Indian nuclear installations.<br />
Dr.P.R.Vasudeva Rao, Director of Chemistry, Materials and Metallurgy Groups of <strong>IGCAR</strong> in his<br />
key-note address drew the attention of the audience to the world of challenges and<br />
opportunities prevailing in the nuclear science and technology. Dr.S.K.Malhotra, Head of Public<br />
Awareness Division of DAE, Mumbai spoke on the theme of the Workshop. Shri.PV.Ramalingam,<br />
Director, Reactor Operations and Maintenance Group, <strong>IGCAR</strong> and the Chairman of the <strong>IGCAR</strong><br />
Public Relations Implementation Committee proposed the vote of thanks.<br />
The Workshop comprised of 12 invited technical lectures, practical demonstrations, in<strong>for</strong>mal<br />
contest, feed-back / panel discussion session and field visits to leading hospitals like Apollo<br />
Specialty Hospital, Cancer Institute (WIA - Adyar), Institute of Cardiovascular Diseases (Madras<br />
Medical Mission), Vijaya Health <strong>Centre</strong>, Dr.Kamakshi Memorial Hospital (Pallikaranai), Sri<br />
Ramachandra Medical <strong>Centre</strong> (SRMC - Porur), Advanced Nuclear Medicine <strong>Research</strong> <strong>Centre</strong>,<br />
Dr.Rai Memorial Medical <strong>Centre</strong>, Dr.Mohan's M.V. Diabetes <strong>Research</strong> <strong>Centre</strong> and Madras Isotope<br />
Laboratory, where radioisotopes are being used <strong>for</strong> diagnostic and therapeutic purposes.<br />
The Chief Guest of valedictory function Dr.R.Krishna Kumar, Head, Dept of Nuclear Medicine,<br />
Cancer Institute (WIA - Adyar) gave away the Certificates and Prizes to the 20 winners of the<br />
in<strong>for</strong>mal contest. He underlined the importance of radioisotopes in cancer management.<br />
Dr.K.Raghuraman captivated the participants by his in<strong>for</strong>mative address and made them feel<br />
proud of the contributions of Indian scientists and engineers to the UN body, IAEA.<br />
Shri.Frederick.J. Kaplan, Consul <strong>for</strong> Public Affairs, US Consulate General <strong>for</strong> South India was the<br />
Guest of Honour at the function. Shri.J.Daniel Chellappa, Head, Technical Co-ordination & Public<br />
Awareness, <strong>IGCAR</strong>, Chennai summed-up the proceedings of the Workshop. Authorities of Loyola<br />
College including the Principal, Rector, Secretary and Dean of Sciences participated in the<br />
inauguration and valediction.<br />
The participants were extremely impressed and felt greatly benefited by their participation.<br />
Many of them desired to have repeat programmes in their institutions. They admired and<br />
appreciated the DAE programmes, and most of them vowed to be our ambassadors! The<br />
Workshop facilitated closer interactions with the academia, and also further strengthened the<br />
research-academia linkage. Thus, the event has successfully fulfilled its objectives!<br />
191
Graduation Function of the first batch of trainees from Training School at <strong>IGCAR</strong> -<br />
September 4, 2007<br />
First Batch of Graduates of Training school with the Chief Guest,<br />
Chairman,AEC along with senior colleagues<br />
The first twenty graduates from<br />
the BARC Training School at<br />
<strong>IGCAR</strong> have successfully<br />
completed their training and<br />
were graduated in a glittering<br />
ceremony that took place on 4<br />
September, 2007 in the Sarabhai<br />
Auditorium, Homi Bhabha<br />
Building, <strong>IGCAR</strong>. Distinguished<br />
Academician, Prof. J.B.Joshi,<br />
Director, University Institute of<br />
Chemical Technology, Mumbai<br />
was the Chief Guest and Dr. Anil<br />
Kakodkar, Chairman, AEC & Secretary, DAE presided over the occasion. Dr. M. Sai Baba, Head,<br />
Strategic and Human Resources Planning Section and Head, <strong>IGCAR</strong> Training School welcomed<br />
the gathering. Dr.Baldev Raj, Distinguished Scientist and Director, <strong>IGCAR</strong> gave the Director's<br />
address. A souvenir featuring the first year of the training programme at <strong>IGCAR</strong> was released by<br />
Prof. Joshi on this historic occasion. Dr.Anil Kakodkar then delivered the Presidential address. A<br />
few of the Trainee Scientific Officers from 1st batch voiced their feedback about the courses and<br />
their stay at the hostel. Prof. Joshi gave away the prestigious 'Homi Bhabha Prize' comprising of<br />
a medallion and books worth Rs.5000 to the meritorious topper from the Mechanical<br />
Engineering discipline, Shri. Ankur Kaushik and Shri.Sukant Kothari from the Electronics and<br />
Instrumentation discipline. He also gave away the course completion certificates to all the<br />
graduates passing out. Prof. Joshi addressed the gathering with a very inspiring and thought<br />
provoking lecture. Finally, Dr. G. Venugopal Rao, S&HRPS proposed the vote of thanks.<br />
CEA-DAE Collaborative meeting on "Nanoscience: nanomaterials - production and<br />
characterization; interfaces - self-assembled monolayers" - October 4, 2007<br />
Shri. S.C. Chetal, Director, Reactor Engineering Group, <strong>IGCAR</strong> with the CEA<br />
Delegation of CEA-DAE Collaborative meeting on "Nanoscience:<br />
nanomaterials - production and characterization; interfaces - self-assembled<br />
monolayers"<br />
A meet on the CEA-DAE<br />
collaboration on the theme,<br />
"Nanoscience: nanomaterials -<br />
production and characterization;<br />
interfaces - self-assembled<br />
monolayers" was held at <strong>IGCAR</strong><br />
Kalpakkam on October, 4, 2007. A<br />
six member CEA Delegation<br />
comprising of Dr. Pascal<br />
Boulangar, Dr. Nathalie Herlin-<br />
Boime, Dr. Arianna Filoramo, Dr.<br />
Roberto, Calemczuk Doris<br />
Neumann-Maazi and Hughes de Longevialle along with Dr. J.V. Yakhmi, Associate Director (P),<br />
BARC, participated in the one day meet at Kalpakkam. The technical programme comprised of<br />
presentations by CEA and <strong>IGCAR</strong> scientists and visits to the laboratories. Topics <strong>for</strong><br />
collaboration in the area of Chemical Sensors and participation in Synchrotron experiments<br />
were discussed.<br />
192
Academia-<strong>IGCAR</strong> Meet (AIM-2007) - October 12, 2007<br />
Chief Guest Prof. Dr. Tmt. Nalini Ravindran, Director of Collegiate Education,<br />
Govt of TN listening to Director <strong>IGCAR</strong>'s address<br />
Guided by the success of the<br />
<strong>Centre</strong>'s major initiative launched<br />
on October 2nd last year, <strong>IGCAR</strong><br />
organized a 1-Day Academica-<br />
<strong>IGCAR</strong> Meet (AIM-2007) at<br />
Kalpakkam on Friday, October 12,<br />
2007 <strong>for</strong> the Academia in science<br />
and engineering disciplines. A<br />
team of 250 resolute researchers,<br />
from various colleges and<br />
universities in Tamilnadu, with<br />
excellent track of research and<br />
promising problems <strong>for</strong><br />
exploration were short-listed <strong>for</strong> participation. The Meet focused on rein<strong>for</strong>cing the existing<br />
collaborations, and also on identifying new enabling partners in India's march towards its<br />
cherished vision of becoming a global leader in Sodium Cooled Fast Breeder Reactor (FBR) and<br />
associated fuel cycle technologies by 2020 AD. Academia from various others districts of the<br />
State, who have a strong desire to collaborate, also joined their Chennai colleagues in large<br />
numbers.<br />
AIM-2007 provided an excellent plat<strong>for</strong>m <strong>for</strong> showcasing their expertise and the infrastructure<br />
of their institutions. They presented relevant project proposals <strong>for</strong> joint ventures and shared<br />
their excitements in pursuing science and engineering R & D with <strong>IGCAR</strong> scientists. They were<br />
keyed-up at the <strong>Centre</strong>'s top-notch research culture and the commitment of our scientists. The<br />
day's programme included brain-storming session with Dr.Baldev Raj Distinguished Scientist<br />
and Director <strong>IGCAR</strong>, visits to laboratories of their interest, technical presentations by the Heads<br />
of the respective facilities, one-on-one interactions with their chosen scientists, business<br />
networking, feed-back session and panel discussion <strong>for</strong> <strong>for</strong>mulating the roadmap to take the<br />
initiatives ahead. The progress of the collaborative ventures and the offshoots of AIM-2007 will<br />
be documented <strong>for</strong> periodic monitoring and further directions by the <strong>Centre</strong>.<br />
Visit of CEA, France delegation - October 17-18, 2007<br />
A three member CEA delegation<br />
comprising of Dr A. Alamo, Dr. P.<br />
Chaix and Dr. C. Robertson<br />
visited <strong>IGCAR</strong> during October 17<br />
Shri. S.C. Chetal, Director, Reactor Engineering Group, <strong>IGCAR</strong> presenting a<br />
memento to Dr. P. Chaix (DEN/DSOE) along with Dr. A. Alamo and Dr. C.<br />
Robertson<br />
and 18, 2007. Presentations on<br />
"CEA Basic <strong>Research</strong> Programs<br />
<strong>for</strong> Nuclear Energy Applications",<br />
"Advanced Steels and ODS Alloys<br />
<strong>for</strong> Nuclear Applications", and<br />
"Strain Localization in Irradiated<br />
Austenitic Stainless Steels, were<br />
made by the visiting CEA<br />
Scientists, followed by in-depth discussions. The main objective of the discussion session was to<br />
put into action the Implementing Agreement "Investigation of irradiation-induced<br />
microstructure in ODS materials using JANNUS facilities and multi-scale modelling" that was<br />
signed in Cadarache on 24th September 2007. The scientific and technical aspects of the<br />
collaborative programme that deals with investigation of the stability of nano-sized yttria<br />
particles in iron matrix, under various irradiation conditions and mechanical loading was<br />
discussed in detail to evolve the various steps of experimentation and simulation.<br />
193
India-Japan Specialists' Meeting on Safety in Nuclear Energy - November 12-13, 2007<br />
Dr. Baldev Raj, Director, <strong>IGCAR</strong> and Prof.Y.Fuji-ie,<br />
<strong>for</strong>mer Chairman, <strong>Atomic</strong> Energy Commission of Japan,<br />
with the participants of the "India-Japan Specialists'<br />
Meeting on Safety in Nuclear Energy".<br />
The India-Japan Specialists' meeting on Safety in Nuclear<br />
Energy was held at <strong>IGCAR</strong>, Kalpakkam during 12-13<br />
November, 2007. A thirteen-member Japanese<br />
delegation led by Prof.Y.Fuji-ie, Former Chairman,<br />
<strong>Atomic</strong> Energy Commission of Japan participated in the<br />
specialist meeting. From Indian side twenty members<br />
from <strong>IGCAR</strong> and BHAVINI attended the meeting. The<br />
meeting started with introductory remarks by Dr.<br />
Baldev Raj, Director, <strong>IGCAR</strong> and Prof. Fuji-ie, leader of<br />
the Japanese delegation. In his introductory remarks Dr.<br />
Baldev Raj, gave an overview of the current status of<br />
fast reactor development in India. In his talk Prof. Fuji-ie, touched upon "Nuclear Development in<br />
Japan" and "Basic idea of securing nuclear system safety". In all there were eight presentations, four<br />
from Japanese delegation and four from Indian participants. Mr. A. Yoshida from O-arai <strong>Research</strong> and<br />
Development Center, JAEA, talked on "The Operating experience of Japanese fast experimental<br />
reactor Joyo" and Dr. Y. Kani, Leader of the Fast Reactor Programme in Japan and the Deputy Director<br />
General, Fast Breeder Reactor <strong>Research</strong> and Development Center, JAEA gave a talk on "Safety<br />
approach and safety evaluation of Japanese prototype fast reactor Monju". Mr. N. Suda from the<br />
Nuclear Safety Technology <strong>Centre</strong>, Japan, in his talk gave the details of the "System <strong>for</strong> prediction of<br />
environmental emergency dose in<strong>for</strong>mation (SPEEDI)". Shri S.C. Chetal, Director, Reactor<br />
Engineering Group, discussed the "Safety criteria & design provisions of Prototype Fast Breeder<br />
Reactor in India" and Shri. P.V. Ramalingam, Director, Reactor Operation & Maintenance Group, in his<br />
talk covered the "Operating experience of Fast Breeder Test Reactor". Shri. M. Rajan, Director, Safety<br />
Group touched upon the "R&D studies concerning sodium fire at <strong>Indira</strong> <strong>Gandhi</strong> <strong>Centre</strong> <strong>for</strong> <strong>Atomic</strong><br />
<strong>Research</strong>" and Dr. P. Chellapandi, Associate Director, Nuclear Engineering Group, REG discussed in his<br />
talk "Beyond design basis events and containment related aspects of Prototype Fast Breeder Reactor<br />
in India".<br />
Possible areas <strong>for</strong> further cooperation were discussed in the concluding session. The members of the<br />
Japanese delegation visited Fast Breeder Test Reactor and Prototype Fast Breeder Reactor, under<br />
construction by BHAVINI.<br />
Visit of Parliamentary Standing Committee on Science & Technology, Environment &<br />
Forests - December 21, 2007<br />
Dr. V. Maitreyan, Chairman and Members of the<br />
"Parliamentary Standing Committee on Science &<br />
Technology, Environment & Forests" with Dr. Baldev<br />
Raj, Director, <strong>IGCAR</strong> and senior members of <strong>IGCAR</strong><br />
during their visit to <strong>IGCAR</strong>.<br />
A delegation of members of the "Parliamentary Standing<br />
Committee on Science & Technology, Environment and<br />
Forests" under the Chairmanship of Honourable Member<br />
of Parliament, Dr. V. Maitreyan visited the <strong>Centre</strong> on 21<br />
December, 2007. The delegation was received by Dr.<br />
Baldev Raj, Director, <strong>IGCAR</strong> and Heads of other DAE units<br />
at Kalpakkam and senior colleagues of the <strong>Centre</strong>. Dr.<br />
Baldev Raj, Director, <strong>IGCAR</strong> in his talk presented a status<br />
report on the Fast Breeder Test Reactor and the R&D<br />
activities of the <strong>Centre</strong> and gave a perspective of the<br />
future growth of fast breeder reactor program. An<br />
interesting and thought provoking discussion followed the presentation. The members of the<br />
standing committee expressed their appreciation <strong>for</strong> the progress made by the <strong>Centre</strong> in the<br />
development of fast breeder reactor technology and associated fuel cycle technologies<br />
The members of the delegation visited; Fast Breeder Test Reactor, Radiometallurgy Laboratory and<br />
Engineering development and testing facilities of Fast Reactor Technology Group. They also visited<br />
the Prototype Fast Breeder Reactor, under construction by BHAVINI.<br />
194
Chairman<br />
IGC COUNCIL MEMBERS<br />
Dr. Baldev Raj, Fellow, Third World Academy of Sciences, Indian National Science<br />
Academy, Indian National Academy of Engineering, Indian Academy of Sciences,<br />
Bangalore, The National Academy of Sciences, Allahabad, Tamil Nadu Academy of<br />
Sciences, BE from Ravishankar University and Ph.D. from IISc, Bangalore, D.Sc.<br />
(h.c.) from Sathyabama University, Chennai, is a Distinguished Scientist &<br />
Director, <strong>Indira</strong> <strong>Gandhi</strong> <strong>Centre</strong> <strong>for</strong> <strong>Atomic</strong> <strong>Research</strong>.<br />
His specializations include materials characterization linked to per<strong>for</strong>mance, NDE<br />
and Quality Management, testing and evaluation using non-destructive evaluation<br />
methodologies, materials development and per<strong>for</strong>mance assessment and<br />
technology management. He has steered and participated in many national programmes of great significance<br />
such as Intelligent Processing of Materials, Characterization of Cultural Heritage, IAF programmes<br />
of ageing management. He has 36 years of experience, which has led to many first of its kind observations<br />
and discoveries in the field of materials characterization and applications. He has more than 650 publications<br />
in journals. He has co-authored 12 books and co-edited 28 books and special journal volumes. He<br />
has 5 Indian Standards and 18 patents to his credit. He is Editor-in-Chief of two series of books: one related<br />
to NDE Science & Technology and another related to Metallurgy & Material Science. He has contributed<br />
9 articles in Encyclopaedia and a large number of reviews.<br />
He has won major awards such as NDT Man of the Year, G.D. Birla Gold Medal, Sir C.V. Raman Award, Keith<br />
Hartely Award, International Committee on NDT <strong>Research</strong>er Award, VASVIK Award, Lifetime Achievement<br />
Award of Indian Society <strong>for</strong> Nondestructive Testing, Lifetime Achievement Award of Indian Welding<br />
Society, Raman-Chandrasekhar Award of Acoustical Foundation <strong>for</strong> <strong>Research</strong> & Education, V.S. Jain<br />
Memorial Lecture of Indian Society <strong>for</strong> Nondestructive Testing, MRSI-ICSC Superconductivity & Materials<br />
Science <strong>Annual</strong> Prize, Jaeger Award of International Institute of Welding, Indian Nuclear Society Award,<br />
NOCIL Award of Indian Institute of Chemical Engineers, Dr. S. Bhagavantam Award of Acoustical Society of<br />
India, Indian Science Monitor Award and Padma Shri from Govt. of India.<br />
He is on many Commissions, Committees and Councils, Editorial Boards nationally and internationally<br />
such as Standing Advisory Group on Nuclear Energy, International <strong>Atomic</strong> Energy Agency; Scientific<br />
Advisory Council to Prime Minister; Nano Science & Technology Initiatives of Department of Science &<br />
Technology, Member, Board of Directors, Bharatiya Naabhikiya Vidyut Nigam Ltd. (BHAVINI), Nuclear<br />
Fuel Complex, Member, National Committee of <strong>Centre</strong> <strong>for</strong> Co-operation in Science & Technology in<br />
Developing Societies under the auspices of Indian National Science Academy, Board of Director,<br />
International Institute of Welding, etc. He is Senior Professor of Homi Bhabha Naitonal Institute (a<br />
University of the Department of <strong>Atomic</strong> Energy). His interests include technology management, heritage,<br />
philosophy, theosophy and education. He is an acclaimed specialist in the area of archeometallurgy and<br />
education.<br />
Members<br />
Dr. C.V. Ananda Bose, IAS, is presently Joint Secretary (<strong>Research</strong> and<br />
Development), Department of <strong>Atomic</strong> Energy. Coming from the Kerala Cadre, he<br />
has held several positions in Kerala including the Principal Secretary to Chief<br />
Minister of Kerala. He is a visiting Professor of Birla Insititute of Technology and<br />
Science, Pilani and has authored eight books and about a hundred papers and<br />
articles in the fields of Habitat, Architecture, Environment and Land Re<strong>for</strong>ms. He<br />
is a recipient of several National and International Awards that include<br />
Jawaharlal Nehru Fellowship, Bremen Partnership Award and Rajiv <strong>Gandhi</strong><br />
National Award <strong>for</strong> Excellence in Management. He has received more than a hundred<br />
prizes and medals and is a member of several International and National Expert Groups. In 2006 ,<br />
Shri Ananda Bose has been appointed as Chairman of <strong>Atomic</strong> Energy Education Society,Mumbai.<br />
195
Shri S.C. Chetal, B.E.(Mech), is a Distinguished Scientist & Director, Reactor<br />
Engineering Group at <strong>IGCAR</strong>. Since 1971, he has been engaged in the field of fast<br />
reactor engineering. He has made significant contributions towards design of<br />
FBTR sodium systems and components. He has also contributed to the material<br />
selection, manufacturing technology, R&D, design and manufacturing of 500<br />
MWe Prototype Fast Breeder Reactor. He is a member of many professional institutions<br />
and a Fellow of the Indian National Academy of Engineering. He has<br />
received National Technology Award 2000 from DRDO <strong>for</strong> significant contributions<br />
in the field of high purity titanium sponge production, Indian Nuclear<br />
Society Award 2003 <strong>for</strong> contributions towards nuclear related high technology and National Design<br />
Awaard-2007 by Institution of Engineers (India). His interests apart from Fast Reactor Engineering<br />
include pressure vessel and materials technology. He has to his credit 300 publications in<br />
Journals/Symposia/Conferences.<br />
Shri R.N. Jayaraj is presently the Chief Executive of Nuclear Fuel Complex (NFC),<br />
Hyderabad. He is a Mechanical Engineer, graduated from Osmania University.<br />
After successful completion of one-year orientation course in Nuclear<br />
Engineering from the 17th batch of BARC Training School, he joined <strong>Atomic</strong> Fuels<br />
Division of BARC and contributed in the production of metallic uranium fuel<br />
assemblies <strong>for</strong> CIRUS reactor and development of fuel assemblies <strong>for</strong> DHRUVA<br />
reactor. After his transfer to NFC, he played a key role in establishing the assembly<br />
plant and successfully fabricated all the core sub-assemblies, <strong>for</strong> the first time<br />
in India, required <strong>for</strong> FBTR. He was instrumental in scaling up of production of<br />
fuel bundles required <strong>for</strong> all the PHWRs, thus consistently meeting the requirements of Nuclear Power<br />
Corporation of India Limited (NPCIL). He has to his credit the indigenous development of various equipment<br />
<strong>for</strong> critical processes involving welding, machining centers and assembly stations, thus creating a<br />
strong base <strong>for</strong> establishing self-reliance in PHWR fuel manufacturing. He played pioneering role in standardizing<br />
the manufacturing processes <strong>for</strong> the fuel bundles required <strong>for</strong> 540 Mwe PHWRs. He served the<br />
Department <strong>for</strong> the last 32 years in various capacities in different Units and gained rich experience in<br />
developmental and production of fuel <strong>for</strong> Thermal <strong>Research</strong> Reactors, PHWRs and BWRs. Shri Jayaraj,<br />
besides being a Member of IGC Council, is also on the Boards of UCIL and IREL.<br />
Shri H.S. Kamath, B.E (Metallurgy), is a Distinguished Scientist and Director of<br />
the Nuclear Fuels Group in BARC. He has been associated with the development<br />
of plutonium bearing nuclear fuels <strong>for</strong> the last 35 years, which started with the<br />
fabrication of fuel <strong>for</strong> 'PURNIMA' in 1970-1972. His main area of work is in the<br />
development of uranium-plutonium mixed oxide (MOX) fuels <strong>for</strong> nuclear power<br />
programme. He has made important contributions in this field both in laboratory<br />
scale as well as industrial scale activities. His most important contribution has<br />
been the setting up of the industrial scale MOX fuel fabrication plant at Tarapur.<br />
Shri Kamath is the recipient of Indian Nuclear Society Award <strong>for</strong> the year 2003<br />
in recognition of his outstanding contributions in the field of nuclear fuel fabrication.<br />
Prof P.K. Kaw, Ph.D (Physics) from IIT Delhi, is the Director of Institute <strong>for</strong><br />
Plasma <strong>Research</strong>, <strong>Gandhi</strong>nagar since 1986. The Institute has pioneered plasma<br />
physics research in India which includes design, development and fabrication of<br />
two tokamaks, ADITYA and SST 1, research work on a large number of fundamental<br />
plasma physics experiments and work on industrial applications of plasma<br />
physics. ADITYA was the first tokamak to discover intermittency in edge and<br />
SOL turbulence. The Institute also spearheaded India's case <strong>for</strong> participation in<br />
ITER and is now the nodal domestic agency <strong>for</strong> ITER. Prof. Kaw's personal<br />
research work in this period includes physics of intermittency, drift waves and<br />
196
anomalous transport, MARFES, solitons, laser fusion, anomalous stopping effects, dusty plasmas, nonneutral<br />
plasmas, quark gluon plasmas, etc. Earlier he had held positions like Princeton University Plasma<br />
Physics Laboratory <strong>Research</strong> Staff, Professor at Physical <strong>Research</strong> Laboratory, Ahmedabad and at<br />
Princeton Plasma Physics Laboratory be<strong>for</strong>e taking over as Director, Plasma Physics Program at Physical<br />
<strong>Research</strong> Ahmedabad in 1982. He played a key role in initiating tokamak physics program in India. He has<br />
more than 284 research papers to his credit in international journals. He has several honours and delivered<br />
important lectures. Artsimovitch Memorial lecture at the IAEA Fusion Energy Conference in 1992,<br />
Invited talk on International Energy <strong>Research</strong> at the APS Centennial celebrations (1999) in Atlanta,<br />
Georgia and a presentation on the International impact of USDOE Fusion Theory Program to the NSF-NRC<br />
Panel Chaired by C F Kennel, San Diego are just a few of them to name. Prof Kaw was also the Chairman of<br />
the International Fusion <strong>Research</strong> Council (IFRC) of IAEA from 2000 to 2007.<br />
Shri H.S. Kushwaha, B.Sc., M.Tech.(IIT, Kanpur), is presently the Director of<br />
Health, Safety and Environment Group at BARC. He has made significant and<br />
important contributions in the design and analysis of nuclear structures, components<br />
and piping of Indian Pressurised Heavy Water Reactors (PHWR). He has<br />
done pioneering work in the area of seismic design and analysis of 500 MWe<br />
PHWR being built at Tarapur, Maharashtra. He has developed several finite element<br />
computer programmes in the field of structural mechanics, heat transfer<br />
and fluid mechanics. He has developed an improved finite element method using<br />
upwinding schemes to solve three dimensional advection-diffusion equation. He<br />
is an active member of Project Design Safety Committee of PHWRs/FBR, Civil Engineering Safety<br />
Committee and Safety Review Committee <strong>for</strong> Operating Plants (SARCOP) constituted by AERB, Mumbai.<br />
He has published around 400 papers/reports in national and international journals.<br />
Shri R. Natarajan, a Chemical Engineer from the Annamalai University, joined<br />
the Department of <strong>Atomic</strong> Energy in 1975. He is presently the Director,<br />
Reprocessing Group in <strong>IGCAR</strong>. Under his leadership, the CORAL facility, <strong>for</strong> establishing<br />
the process technology <strong>for</strong> the reprocessing of fast reactor fuels, was<br />
designed, erected and commissioned. He led the team which has successfully<br />
completed the reprocessing of fast reactor spent fuel, with a burnup of as high as<br />
155 GWd/t with Plutonium rich fuels, <strong>for</strong> the first time in the world. As Director<br />
of Reprocessing Group, he is responsible <strong>for</strong> the R&D activities of fast reactor fuel<br />
reprocessing and setting up of Demonstration as well as the commercial PFBR<br />
fuel reprocessing plants. His specialization is in the design process flowsheets and plant design. His has<br />
also experiences in the design and operation of Thorium-Uranium cycles. He has participated in the irradiated<br />
thorium fuel reprocessing campaigns at the Reprocessing Development Laboratory and the<br />
Uranium - 233 recovered is used as fuel <strong>for</strong> the reactor KAMINI. He has interests in solvent extraction<br />
process modeling, extraction equipment design, design of feed clarification systems of high active solutions,<br />
acid recovery systems, system designs of radioactive offgas circuits and ventilation design of radiochemical<br />
plants. He has over ninety five technical presentations and publications to his credit. He has won<br />
prestigious NOCIL Award <strong>for</strong> Excellence in Design and Development of Process Plant and Equipment <strong>for</strong><br />
the year 2005 <strong>for</strong> his contribution in the development of fast reactor fuel reprocessing. He is also the recipient<br />
of Indian Nuclear Society's INS award <strong>for</strong> the year 2006 <strong>for</strong> his contributions in Nuclear Fuel Cycle<br />
technologies.<br />
Shri Y.C. Manjunatha, Director, Engineering Services Group of <strong>Indira</strong> <strong>Gandhi</strong><br />
<strong>Centre</strong> <strong>for</strong> <strong>Atomic</strong> <strong>Research</strong>, Kalpakkam, is a M. Tech. in Electrical Engineering<br />
from IIT, Madras and belongs to the 16th batch of BARC Training School,<br />
Department of <strong>Atomic</strong> Energy. He steers one of the largest multidisciplinary<br />
groups in the <strong>Centre</strong> which focuses on providing reliable and robust services<br />
through cutting edge technologies and methodologies. Some of his major contributions<br />
are development and sustenance of infrastructural works of <strong>IGCAR</strong> &<br />
GSO involving civil, electrical, air conditioning and ventilation, communication,<br />
workshop and QA activities. He has published more than 10 papers.<br />
197
Shri S.D. Misra, B.E (Electrical & Mechanical Engineering) is presently the<br />
Director of Nuclear Recycle Group at BARC. He is from 13th Batch of BARC<br />
Training School and has been involved in the Back End activities of Nucler Fuel<br />
Cycle. He was a member of the team that pioneered setting up of the first<br />
Vitrification Plant in the country. Shri Misra was responsible <strong>for</strong> design and construction<br />
of vitrification plants at Trombay & Kalpakkam. He was also instrumental<br />
in solving all the problems faced in the first resin fixation facility at<br />
Narora <strong>Atomic</strong> Power Project and made it operational. Shri Misra has participated<br />
in a number of symposia and seminars on radioactive waste management and<br />
has also worked as an expert on various technical committees of International <strong>Atomic</strong> Energy Agency.<br />
Presently he is a Member of International Radioactive Waste Technical Committee (WATEC) of IAEA.<br />
He has also served as Director, Purchase & Stores, DPS. In this capacity, he has successfully overcome the<br />
problems of technology control regime and made available some of the critical stores <strong>for</strong> the programmes<br />
of the Department. Presently, as Director, Nuclear Recycle Group, he is holding the responsibility of setting<br />
up and operation of Reprocessing and Waste Management Plants at various sites in the country.<br />
Shri. M. Rajan steered the Safety Group at <strong>IGCAR</strong> till 31st December 2007, the<br />
day on which he superannuated. He obtained his B.E. (Hons) in Chemical<br />
Engineering at Annamalai University in 1972. He underwent one year advanced<br />
course in Nuclear Technology at Bhabha <strong>Atomic</strong> <strong>Research</strong> <strong>Centre</strong>, Mumbai during<br />
1972-73. His main contributions in the past 30 years are on development<br />
works related to the use of sodium as a coolant in Fast Breeder Nuclear Reactors<br />
and Engineering Safety. He has designed and constructed many high temperature<br />
sodium systems and developed many components & methods <strong>for</strong> the Fast<br />
Breeder Reactors. He is a fellow of Indian National Academy of Engineering,<br />
Indian Institute of Chemical Engineers and Institution of Engineers.<br />
Shri P.V. Ramalingam is an Outstanding Scientist and presently Director of<br />
Reactor Operation and Maintenance Group in <strong>IGCAR</strong>. He graduated in Electrical<br />
Engineering with Honours from Madras University in 1969. He worked in CIRUS<br />
reactor, BARC from 1969 to 1975. He was transferred to <strong>IGCAR</strong> in 1975. He was<br />
actively involved in preparing the FBTR station documents and training the<br />
operation staff. He was responsible <strong>for</strong> commissioning the primary sodium system<br />
and its auxiliary circuits of FBTR and he had the privilege of making the first<br />
criticality of FBTR on October 18, 1985. He was closely associated in taking the<br />
reactor power in stages to the power level of 17.4 MWt. He was responsible <strong>for</strong><br />
implementing many improvements in FBTR <strong>for</strong> increasing the availability factor of the reactor and in the<br />
recently concluded 13th irradiation campaign the availability factor was 94 %. He has to his credit 51 publications<br />
in journals/symposia/conferences.<br />
Shri A.L.N. Rao, B.E.(Electrical), is presently the Chairman & Chief Executive of<br />
the Heavy Water Board. He joined Bhabha <strong>Atomic</strong> <strong>Research</strong> <strong>Centre</strong> as 15th batch<br />
trainee in the year 1971. He was awarded Junior License Certificate in 1974 and<br />
took independent charge of the unit consisting reactor, turbine, generator and<br />
associated utilities and control systems of TAPS. As unit control engineer he<br />
operated the unit safely and without any accidents. He has handled emergency<br />
situations and took immediate action to bring the reactors under safe conditions.<br />
Shri A.L.N. Rao participated in the first refuelling operations which consisted of<br />
transferring the irradiated fuel bundles from the reactor core to fuel storage pool<br />
and loaded the fresh fuel bundles from storage pool into the reactor under 60 ft. of water. He had also<br />
replaced the core components which was a challenging task. In the year 1978, he obtained Senior License<br />
Certificate and took independent charge of the complete plant in shifts. Shri A.L.N. Rao moved from<br />
Nuclear Power Board to Heavy Water Board in the year 1984. He closely followed up the project activities<br />
of the Captive Power Plant of Heavy Water Plant (Manuguru) being set up at Aswapuram in Khammam<br />
district of Andhra Pradesh. In the year 1987 he took over as Operation Manager of Captive Power Plant.<br />
He has successfully monitored the erection of equipments and carried out precommissioning and commis-<br />
198
sioning activities of the Captive Power Plant having capacity to generate 265 x 3 T/hr of superheated<br />
steam and 3 x 30 MWe of electricity generation. He assumed charge as General Manager of the complete<br />
Heavy Water Plant (Manuguru), which is the largest heavy water producing plant in India, in the year<br />
1998. He became Associate Director (Projects/Energy & Services) in the year 2003 at the Central Office<br />
and took charge as Director (Energy & Services/Operation) in the year 2004. In 2005 he was designated<br />
as Executive Director (Projects/Energy & Services) and monitored the physical and fiscal progress of the<br />
Projects at Board level. He discharged the duties as the Secretary of the Heavy Water Board. He coordinated<br />
all activities related to export of Heavy Water to South Korea and the Republic of China. As<br />
Management Representative <strong>for</strong> Quality Management Systems as per ISO 9001, he followed up all the<br />
activities and obtained ISO 9001 Certificate <strong>for</strong> Board Office.<br />
Shri R.K. Sinha, B.E (Mechanical Engineering), is presently a Distinguished<br />
Scientist, Director of Reactor Design and Development Group, and Director of<br />
Design Manufacturing and Automation Group at BARC. He is a nationally and<br />
internationally recognised expert in the area of nuclear reactor technology. He<br />
has handled several major assignments relating to the Indian research and<br />
power reactors. In particular, he has specialised in design, development and safety<br />
related activities relating to coolant channels of heavy water reactors. He is<br />
currently guiding the design and development of the innovative Advanced Heavy<br />
Water Reactor and Compact High Temperature Reactor. Shri Sinha has received<br />
several awards and honours including the Homi Bhabha Science and Technology Award, VASVIK Award<br />
and Indian Nuclear Society Award. He is a Fellow of the Indian National Academy of Engineering.<br />
Shri P Swaminathan graduated with honours degree in Electronics &<br />
Communication Engineering from Regional Engineering College, Tiruchirapalli<br />
in 1971. He is the Gold medalist of University of Madras. After undergoing one<br />
year course in Nuclear Science & Engineering from BARC Training School. Shri P<br />
Swaminathan joined <strong>Indira</strong> <strong>Gandhi</strong> <strong>Centre</strong> <strong>for</strong> <strong>Atomic</strong> <strong>Research</strong> in 1972. He further<br />
underwent one year course in Main frame system from International<br />
Honeywell Bull Training Institute, Paris. Shri P Swaminathan is the main architect<br />
<strong>for</strong> the design, development, installation and commissioning of Fault<br />
Tolerant Safety Critical Real Time Computer System <strong>for</strong> Fast Breeder Test<br />
Reactor. As Director of Electronics & Instrumentation Group, Shri Swaminathan is actively engaged in the<br />
development of Safety Instrumentation, Full scope Training Simulator and Knowledge Management<br />
System <strong>for</strong> Fast Breeder Reactor Programe. Shri P Swaminathan is a Fellow of Institution of Engineers and<br />
also holds Master Degree in Management Science.He actively interacts with project students and is also<br />
Distinguished visiting professor of INAE. He has over 40 publications in International journals/seminars.<br />
Also as Chairman, Hospital Management Committee, Shri P Swaminathan ensures the smooth functioning<br />
of Health Care System.<br />
Shri Umesh Chandra, Distinguished Scientist, is a graduate in Electrical<br />
Engineering from IIT, Kanpur. He is currently Senior Executive Director (R&D<br />
and KM) in Nuclear Power Corporation of India. He has been responsible <strong>for</strong><br />
establishment of R&D activities in NPCIL. The R&D facilities are located at R&D<br />
<strong>Centre</strong>, Tarapur <strong>for</strong> Nuclear Systems and R&D Lab., NUB, Mumbai <strong>for</strong> Electronic<br />
Systems. He is also directing development and deployment of Computer Based<br />
Systems in nuclear power plants <strong>for</strong> Control and Instrumentation Systems, Main<br />
Control Rooms and Training Simulators <strong>for</strong> PHWR and LWR. He is also managing<br />
the IT infrastructure and applications in the organisation. He has guided<br />
design of reactor control mechanisms, various types of remote inspection tools, manipulators and instruments<br />
<strong>for</strong> monitoring radiation. He is also directing the Knowledge Management activities in NPCIL. He<br />
was responsible <strong>for</strong> Control and Instrumentation of the first 540MWe nuclear power plant TAPS-4, which<br />
achieved criticality within 5 years of start of construction. Earlier at Reactor Control Division, BARC, he<br />
has been engaged in the development of computer based control and operator in<strong>for</strong>mation systems <strong>for</strong><br />
nuclear power plants. He was responsible <strong>for</strong> computerized control system <strong>for</strong> on-power refuelling<br />
machines of PHWRs from NAPS onwards and Dual Processor Hot Standby (DPHS) based - Process Control<br />
System and Reactor Regulating System <strong>for</strong> Kaiga-1,2 and RAPS-3,4 reactors. He participated in activities<br />
199
of AERB as a member of several safety committees and Advisory Committee <strong>for</strong> Code, Guides and manuals<br />
<strong>for</strong> safety in design <strong>for</strong> nuclear power plants. He was Head, Reactor Control Division and Associate<br />
Director, Automation and Manufacturing Group, BARC be<strong>for</strong>e joining NPCIL.<br />
Shri. G. Vaidyanathan, graduated in Engineering from Delhi University in 1971<br />
and joined <strong>IGCAR</strong> in 1972 after completion of one year orientation course in<br />
BARC Training School. Later he acquired a Post Graduate Degree in Operation<br />
Management. Presently he is an Outstanding Scientist and Heads the Fast<br />
Reactor Technology Group at <strong>IGCAR</strong> as Group Director. Since 1972, he has been<br />
actively involved in the field of Fast reactor design, analysis and experiments. He<br />
has made significant contributions to numerical simulation of heat transfer and<br />
fluid flow processes in sodium cooled fast reactors. He has meticulously planned<br />
and carried out R&D <strong>for</strong> the thermal hydraulics of Fast Reactors. He has also contributed<br />
significantly as member of the <strong>IGCAR</strong> safety committee. He was instrumental in setting up the<br />
Steam Generator Test Facility at <strong>IGCAR</strong> with minimal cost and time overrun. He has to his credit about 175<br />
publications in journals/conferences and has co-authored one book.<br />
Dr. P.R. Vasudeva Rao, is a Distinguished Scientist and presently Director of<br />
Chemistry Group as well as Metallurgy and Materials Group in <strong>IGCAR</strong>. He<br />
obtained his Doctorate degree in Inorganic Chemistry from Bombay University<br />
in 1979. He has played an active role in shaping the Radiochemistry Programme<br />
of <strong>IGCAR</strong> to its current status. His research interests cover a wide range of areas<br />
such as development of alternate extractants and resins <strong>for</strong> actinide recovery<br />
solvent extraction, third phase <strong>for</strong>mation, thermodynamics, applications of photochemistry<br />
in actinide separations, development of pyrochemical and other<br />
non-aqueous processes <strong>for</strong> recovery of actinides and rare earths, thermochemical<br />
studies on nuclear materials, application of microwaves in synthesis of nuclear fuels and other ceramic<br />
materials, nuclear fuel cycle, fuel behaviour in reactors, burn-up measurements, and non-destructive<br />
assay. He has published more than 150 papers in reputed international journals apart from guiding several<br />
research scholars <strong>for</strong> their doctorate degrees. He is a life member of Indian Nuclear Society, Materials<br />
<strong>Research</strong> Society of India, Society <strong>for</strong> Advancement of Electrochemical Science and Technology, Indian<br />
Association of Nuclear Chemists and Allied Scientists (IANCAS), and President of the Southern Regional<br />
Chapter - IANCAS. He has been awarded the MRSI Medal in 1998 and is also a Fellow of Tamil Nadu<br />
Academy of Sciences. He is a member of the International Advisory Board of the Journal of Nuclear<br />
Materials<br />
Dr. V. Venugopal, M.Sc.,Ph.D, is presently an Outstanding Scientist and the<br />
Director of Radiochemistry and Isotope Group at BARC, Mumbai, and Officer-incharge,<br />
Nuclear Material Accounting and Control (NUMAC) cell of DAE. He is currently<br />
a member of Standing Advisory Group <strong>for</strong> Safeguard Implementation<br />
(SAGSI) to advice Director General IAEA on Safeguards Matters. He is a specialist<br />
in the field of thermal/ thermodynamics of plutonium based fuels at high temperature,<br />
chemical quality control of fuel, X-ray and solid state chemistry and<br />
oversees Radioisotope and Radiation Technology Programs at BARC. He is the<br />
chairman of Radiation Technology and Applications Committee (RTAC) of BRNS<br />
and a member of BRIT board. He is a member of safety committees such as OPSRC and CFSRC under BSC<br />
at BARC. He has to his credit more than 300 publications out of which 165 are published in reputed international<br />
journals. Widely acclaimed as an expert in the area of thermodynamics, Dr. Venugopal is the<br />
President of Indian Thermal Analysis Society (ITAS) and vice president and editor, INS news of Indian<br />
Nuclear Society (INS). He is also a member of several professional bodies IANCAS, NAARRI, ISAS, ISEAS,<br />
ISMAS, MRSI and Hindi Vigyan Parishad. He has received many awards including the Netzsch-ITAS award<br />
in 2001, ISCAS silver medal in 2002 and MRSI medal <strong>for</strong> 2003-04 and INS award <strong>for</strong> 2005.<br />
200
<strong>Indira</strong> <strong>Gandhi</strong> <strong>Centre</strong> Scientific Committee<br />
(IGCSC) and Activities of Various Groups<br />
Chairman<br />
Dr. Baldev Raj<br />
Director, <strong>IGCAR</strong><br />
Reactor Engineering Group<br />
Shri S. C. Chetal<br />
Director<br />
Dr. P. Chellapandi<br />
Associate Director, NEG<br />
Dr. P. Mohanakrishnan<br />
Head, RPD<br />
Shri T.K. Mitra<br />
Head, HTSD<br />
Shri P. Puthiyavinayagam<br />
Head, RCD<br />
Shri K. Madhusoodanan<br />
Head, PPCD<br />
Shri C. Sivathanu Pillai<br />
ACE, Civil<br />
Shri P. Selvaraj<br />
Head, MHD<br />
Reactor Engineering Group (REG) is responsible <strong>for</strong> the design of 500 MWe Prototype Fast Breeder<br />
Reactor. Design of Nuclear Steam Supply System is carried out in-house. For Balance of Plant, design coordination<br />
is carried out by REG while the consultants are assigned the design work. REG is responsible <strong>for</strong><br />
getting the design clearance of 500 MWe FBR from AERB. R&D coordination towards FBR and execution<br />
of R&D <strong>for</strong> structural mechanics is the responsibility of the Group. As FBR is primarily based on indigenous<br />
technology, the manufacturing technology development of important nuclear components was undertaken<br />
by REG with the active participation of Indian Industries and has been successfully completed. The components<br />
include main vessel, inner vessel, grid plate, roof slab, shutdown mechanisms, steam generator<br />
and largest size sodium service valve. REG provides the design support to FBTR. REG has acquired expertise<br />
in design of fast reactor. As a spin-off, structural mechanics expertise is being provided <strong>for</strong> non-reactor<br />
activities. REG is presently engaged in preparation of the blueprint <strong>for</strong> the future FBRs to provide<br />
enhanced safety and improved economics.<br />
201
Metallurgy and Materials Group<br />
Dr. P.R. Vasudeva Rao<br />
Director<br />
Dr. K. Bhanu Sankara Rao<br />
Associate Director, MDCG<br />
Shri K.V. Kasiviswanathan<br />
Associate Director, GRIP<br />
Dr. C. S. Sundar<br />
Head, MSD<br />
Dr. R.K, Dayal<br />
Head, CSTD<br />
Dr. T. Jayakumar<br />
Head, NDED<br />
Dr. S. Venugopal<br />
Head, RIRD<br />
Dr. M. Vijayalakshmi<br />
Head, PMD<br />
Dr. A.K. Bhaduri<br />
Head, MTD<br />
The Metallurgy and Materials Group has the mandate <strong>for</strong> comprehensive materials R & D programme<br />
focussed towards FBR technology. This requires multifaceted and multidisciplinary approaches that<br />
include development of special alloys, welding consumables, optimisation of fabrication schedules, characterisation<br />
of mechanical properties under sustained as well as varying loads at elevated temperatures<br />
over a wide ranges of strain rates, comprehensive characterisation of corrosion and bio-fouling, development<br />
and application of specialised NDE techniques, innovative designs, and robotics <strong>for</strong> remote handling.<br />
This has been backed by fundamental studies in basic science that includes studies on microstructure<br />
dependence of the various properties, radiation damage, positron annihilation, thermo-physical properties<br />
and mathematical modelling. Some significant contributions of the group include PIE of FBTR fuel pins<br />
that has led to enhancement of target burn up, and development of indigenous structural steels and welding<br />
consumables <strong>for</strong> PFBR applications. At the same time, the outstanding research contributions have<br />
brought international recognition in fields as diverse as life prediction under creep and creep-fatigue conditions,<br />
characterisation of microstructures by NDE techniques, welding science and technology, and<br />
materials science.<br />
202
Fast Reactor Technology Group<br />
Shri G. Vaidyanathan<br />
Director<br />
Shri. P. Kalyanasundaram<br />
Associate Director, FRTG<br />
Dr. C. Ananda Babu<br />
Head, ST & HD<br />
Shri K. K. Rajan<br />
Head, SFD<br />
Shri B. Krishna Kumar<br />
Head, CIDD<br />
The Fast Reactor Technology Group is actively involved in development and testing of models and prototype<br />
components <strong>for</strong> Prototype Fast Breeder Reactor (PFBR), development and testing of sodium instrumentation,<br />
and sodium pumps and flow meters. The group has both water and sodium test facilities and<br />
carries out a wide range of tests/studies such as heat and mass transfer studies in cover gas above sodium<br />
free levels, development of sodium components like cold trap, plugging indicator, filters, heaters,<br />
valves etc., development and testing of sodium sensors <strong>for</strong> level and flow and leak detection sensors <strong>for</strong><br />
sodium leak, testing of control rod mechanisms, testing of inflatable seals, testing of fuel and other subassemblies<br />
<strong>for</strong> pressure drop and cavitation, reactor assembly flow patterns, testing of full scale fuel handling<br />
machines in air and sodium. A 5.5 MW t steam generator test facility <strong>for</strong> carrying out detailed temperature<br />
measurements and study of transient response and thermohydraulic instability is also a part of<br />
the group. The group is also responsible <strong>for</strong> vibration testing of steam generator and intermediate heat<br />
exchanger. In short the group is working on all engineering aspects of FBRs.<br />
203
Reactor Operation and Maintenance Group<br />
Shri P. V. Ramalingam<br />
Director<br />
Shri G. Srinivasan<br />
Associate Director, O&M<br />
Shri K. Ravishankar<br />
Head, THRDD<br />
Shri V. Ramanathan<br />
Head, RMD<br />
Shri K.V. Suresh Kumar<br />
Head, ROD<br />
ROMG is responsible <strong>for</strong> safe operation of Fast Breeder Test Reactor (FBTR) and KAMINI reactor with in<br />
the limits given in technical specification documents. The group takes part in the operational safety review<br />
of 500 MWe Fast Breeder Reactor (FBR) Project documents. The Training and Human Resources<br />
Development Division of the group besides training O&M staff of FBTR and KAMINI is also responsible <strong>for</strong><br />
training the O&M staff of FBR. Introducing innovations and new features in FBTR to increase its availability,<br />
enhancing safety, and gaining newer experience <strong>for</strong> incorporation of inferred ideas in FBR construction<br />
and operation, govern a part of ROMG's activities.<br />
Reprocessing group<br />
Shri R. Natarajan<br />
Director<br />
Dr. S. B. Koganti<br />
Head, RRDD<br />
Shri P. Ramkumar<br />
Head, RPSD<br />
Shri A. Ravisankar<br />
Head, RPDD<br />
Shri M. Venkataraman<br />
Head, RPOD<br />
Shri V. Sundararaman<br />
Head, FRPD<br />
204
The Reprocessing Group (Rp G)of <strong>IGCAR</strong> is responsible <strong>for</strong> the development of Fast reactor fuel reprocessing<br />
technology and construction of the reprocessing plants. RDL has two hot cell facilities: In one of them,<br />
U-233 was recovered from irradiated thorium rods on campaign basis and used as fuel in KAMINI reactor<br />
and in FBTR (as PFBR test fuel). The other hot cell facility, called, CORAL (COmpact facility <strong>for</strong><br />
Reprocessing Advanced fuels in Lead cells) commissioned in 2003, is a test bed <strong>for</strong> validating the process<br />
flow sheet and scaling up of equipment designs <strong>for</strong> fast reactor fuel reprocessing, by processing the FBTR<br />
fuel itself. CORAL has already processed in several campaigns mixed carbide fuels irradiated in FBTR with<br />
25, 50, 100 and 155 GWd/t burnups. This has provided valuable experience to the design of<br />
Demonstration Fast Reactor Fuel Reprocessing Plant, DFRP, in which the FBTR fuels will be reprocessed<br />
on a regular basis. DFRP, which will also demonstrate the reprocessing of PFBR fuel subassemblies, is slated<br />
<strong>for</strong> commissioning by 2009. RpG is also carrying out the design of the reprocessing plant, FRP, <strong>for</strong><br />
reprocessing spent fuels of PFBR on commercial basis. Various R&D activities are being carried in the<br />
Reprocessing Development Laboratory. Engineering scale testing of equipment and systems are done here<br />
be<strong>for</strong>e installing in <strong>for</strong> hot cell. Chopper, dissolver, feed clarification equipment, centrifugal extractors are<br />
few of the important equipment developed at RDL. Apart from equipment development, research is undertaken<br />
<strong>for</strong> understanding and solving various process and chemistry problems of fast reactor fuel reprocessing<br />
such as, mathematical modeling of solvent extraction of the complex U-Pu system, efficient solvent<br />
management, development of online monitoring of Pu <strong>for</strong> process control, liquid flow metering in high<br />
radio active fields etc.,<br />
Chemistry Group<br />
Dr. P. R. Vasudeva Rao<br />
Director<br />
Dr. T. Gnanasekaran<br />
Head, LMSCD<br />
Dr. T. G. Srinivasan<br />
Head, FChD<br />
Dr. V. Ganesan<br />
Head, MCD<br />
Shri K.C. Srinivas<br />
Head, CFD<br />
The Chemistry Group is responsible <strong>for</strong> carrying out R & D to provide inputs with respect to all the chemistry<br />
aspects of the fast reactor and its fuel cycle. In addition, it also takes up R&D programmes which<br />
would have a long term impact on the reactor programmes. Besides the R&D activities, the Chemistry<br />
Group also provides extensive analytical support using a wide range of analytical techniques to all the programmes<br />
in the <strong>Centre</strong>. The Chemistry Group has also specialized in setting up of facilities <strong>for</strong> experiments<br />
with radioactive or air-sensitive materials, and in indigenous development of chemical instrumentation.<br />
The areas of R & D in Chemistry Group include sodium chemistry, chemistry of un-irradiated as well as<br />
irradiated fuel materials, development of fuel cycle, analytical chemistry, spectroscopy and more recently,<br />
boron chemistry. Development of sensors <strong>for</strong> PFBR and sensors <strong>for</strong> environmental applications, cover gas<br />
205
purification system <strong>for</strong> PFBR, development of Laser Induced Breakdown Spectroscopy and X-ray absorption<br />
based techniques <strong>for</strong> on-line monitoring of Pu streams in reprocessing plants, development of technology<br />
<strong>for</strong> production of Pu rich fuels and minor actinide containing fuels through sol-gel route and development<br />
of sodium bonding <strong>for</strong> metallic fuels are some of the R & D programmes on the anvil.<br />
Safety Group<br />
Shri M. Rajan<br />
Director<br />
Shri N. Kasinathan<br />
Head, SED<br />
Dr R. <strong>Indira</strong><br />
Head, RSD<br />
Shri M. Somasekaran<br />
Head, SIRD<br />
Safety Group consists of Safety Engineering Division, Radiological Safety Division and Scientific<br />
In<strong>for</strong>mation Resource Division.<br />
Safety Engineering Division is engaged in the simulated experimental studies and development of mathematical<br />
models <strong>for</strong> FBR accident scenarios such as core subassembly flow blockage, molten fuel relocation,<br />
core debris cooling in core catcher, mitigation of consequences of sodium fires and radioactivity transport<br />
and deposition in sodium circuits.<br />
Radiological Safety Division is mainly responsible <strong>for</strong> the research and development activities in radiation<br />
safety. The division provides health physics services <strong>for</strong> all the radioactive facilities in <strong>IGCAR</strong>. Studies on<br />
criticality safety, radiological safety analysis of BDBA in PFBR, radiation detector development, biodosimetry<br />
with reference to low level radiation exposure effects, development of a neutron generator <strong>for</strong> actinide<br />
assay in wastes, studies on thermo-luminescence and radioactivity transport in media are some of the<br />
major research work being carried out presently.<br />
The group organizes public awareness programmes on radiation safety and nuclear energy. It also carries<br />
out industrial training programme to increase safety awareness.<br />
The Scientific In<strong>for</strong>mation Resource Division is taking care of the Library and In<strong>for</strong>mation Services at the<br />
<strong>Centre</strong>. Work is in progress towards creation of a digital library <strong>for</strong> the FBR literature and making it available<br />
<strong>for</strong> campus wide access using the IGC Network. All the IGC publications are made available in full text<br />
electronic <strong>for</strong>m.<br />
206
Electronics and Instrumentation Group<br />
Shri P. Swaminathan<br />
Director<br />
Shri S. Athinarayanan<br />
Head, CD<br />
Shri S. Ilango Sambasivan<br />
Head, EID<br />
Shri B. Saha<br />
Head, IIS<br />
Dr. A. Vijaya, Medical<br />
Superindent, DAE Hospital<br />
Shri S.A.V. Satyamurty<br />
Head, NS<br />
The Electronics and Instrumentation Group is actively engaged in the development of Strategic Safety<br />
Instrumentation Systems <strong>for</strong> Fast Breeder Reactor Programme such as Real Time Computer Systems ,<br />
Safety Logic Systems,Expert systems Distributed Digital Control Systems etc. Unique Instrumentation systems<br />
such as Electro magnetic Time Domain Survey System is also being developed to detect deeply buried<br />
uranium ore. Highly reliable Instrumentation systems are being developed using modern VLSI design<br />
tools, thermal design tools ,EMI/EMC design tools etc. Application software packages are being developed<br />
using powerfull CASE TOOL.Development process is ISO certified.A Full scope Replica Type Training<br />
Simulator is being developed <strong>for</strong> training the operators of Prototype Fast Breeder Reactor. Walk-through<br />
of different areas of the reactor is being developed using PDMS package.State-of-the art Visualisation center<br />
with stereoscopic projection is being set up. Intranet based Knowledge Management System is being<br />
managed. Simplicity in instrumentation is being realised through the innovative programme on creation<br />
of pulsating sensors <strong>for</strong> diverse parameters, enabling development of completely indigenous plant monitoring<br />
and surveillance systems, rapid analytical and diagnostic tools. Security electronics systems are<br />
constantly being updated <strong>for</strong> Kalpakkam site. Biometric hand geometry based attendance system is<br />
recently commissioned. The group is also responsible to ensure satisfactory health services to the residents<br />
of Kalpakkam and Anupuram Townships.<br />
207
Engineering Services Group<br />
Shri Y. C. Manjunatha<br />
Director<br />
Shri A.S.L.K. Rao<br />
Head, CWD<br />
Shri A.Jyotish Kumar<br />
Head, ESD<br />
Shri B. Venkatraman<br />
Head, QAD<br />
Shri N. Vijayan Varier<br />
Head, QC & CS<br />
Engineering Services Group is responsible <strong>for</strong> providing quality services pertaining to Civil Engineering,<br />
Electrical Engineering, Voice Communication Systems, Air-conditioning & Ventilation Systems, Material<br />
Handling Equipments, Central Workshop activities, Quality Control & Quality Assurance and Testing. The<br />
Group also coordinates the telecommunication requirements of the centre. The Group has a mandate to<br />
establish additional infrastructure requirements so as to meet Design, R&D and operational objectives of<br />
<strong>IGCAR</strong>. The Group has expert teams with capability to design, engineer and execute systems under their<br />
jurisdiction. Electricity, water, quality-air and other services are being extended to other units of DAE<br />
located at Kalpakkam. The nature of work involves interaction with several State-Government and Central<br />
Government - organizations.<br />
Fast Reactor Fuel Cycle Facility<br />
(FRFCF) Project Group<br />
Shri P.V. Kumar<br />
Project Director, FRFCF<br />
Fast Reactor Fuel Cycle Facility (FRFCF) is being set up to close the fuel cycle<br />
of Prototype fast Breeder Reactor (PFBR). The work is being piloted by<br />
<strong>IGCAR</strong> with technical support from BARC and NFC. Towards setting up<br />
FRFCF, the preliminary project work is in progress. The site selected <strong>for</strong><br />
FRFCF has been approved by AERB. Basic infrastructure is being created to<br />
reduce the lead time required to commence the construction work once the<br />
FRFCF project is sanctioned. AERB has constituted a Project Design Safety<br />
Committee <strong>for</strong> FRFCF and review of the preliminary safety analysis report is<br />
in progress. Geotechnical and hydrogeological investigations of the site have<br />
been completed. Main power station building and stores buildings are under<br />
construction and construction power supply system has been commissioned.<br />
Appointment of consultants <strong>for</strong> the detailed design is being processed.<br />
Detailed project report <strong>for</strong> FRFCF is planned to be submitted <strong>for</strong> financial<br />
sanction during the year 2008-09.<br />
208
Smt. Uma Seshadri<br />
Head, PD<br />
Planning Division<br />
Planning Division is the nerve centre, <strong>for</strong> coordination between Project<br />
Coordinators, Accounts, Purchase and Stores <strong>for</strong> planning, budgeting and continuous<br />
monitoring of expenditure of capital projects, to meet the technological<br />
challenges of the <strong>Centre</strong>. It generates various reports which are vital in decision<br />
making process . The activities briefly are: Capital project planning (under all<br />
sectors namely R & D, industries and power); Preparation of budget <strong>for</strong> all the<br />
projects; Monitoring and controlling expenditure under capital project heads.<br />
Conducting Budget Review Meetings (BRM) every month to expedite and sort<br />
out pending issues; Automation and Integration of activities as well as coordination<br />
between indentors at <strong>IGCAR</strong>, MRPU, Accounts and Stores regarding p-<br />
rocurements and expenditure bookings.<br />
Shri K. Balachander<br />
Regional Director, MRPU<br />
Madras Regional Purchase Unit<br />
Material management activities <strong>for</strong> <strong>IGCAR</strong> are planned and executed<br />
systematically and meticulously by Directorate of Purchase & Stores<br />
(Madras Regional Purchase Units at Chennai and Central Stores Unit at<br />
Kalpakkam). Extensive use of Office automation and computers have<br />
helped in speeding up the procurement functions, thus achieving the<br />
financial targets namely Rs.91Crores, under R&D. Some of the<br />
important, high value <strong>Research</strong> Equipments procured are Laser Raman<br />
Microprobe,Plasma Processing System, Scanning Electron Microscopes and<br />
Thermal Ionisation Mass Spectrometer.<br />
Strategic and Human Resources Planning Section<br />
Dr. M. Sai Baba<br />
Head, SHRPS<br />
The section has the mandate of planning <strong>for</strong> the Strategic and Human<br />
Resource needs of the <strong>Centre</strong> which involve: Planning and running the training<br />
school programs at Training School; Collaborative projects with various<br />
R & D Organizations and Academic Institutes; Compilation of technical reports<br />
on important activities of the <strong>Centre</strong>; interacting and coordinating with<br />
National and International delegations; Assessing and projecting the human<br />
resource needs of the <strong>Centre</strong> <strong>for</strong> effective deployment and utilization;<br />
Interacting with the research scholars at the <strong>Centre</strong>; Planning and organizing<br />
meetings related to human resource and personality development.<br />
Administration & Accounts<br />
Shri V. Dayalan<br />
Chief Administrative Officer<br />
Shri S. Mani<br />
Joint Controller<br />
(Finance & Accounts)<br />
Shri R.G. Raghavan<br />
AO, Secretary, IGCSC<br />
209
LIST OF IMPORTANT ABBREVIATIONS<br />
AERB<br />
BARC<br />
BARCF<br />
BHAVINI<br />
BHEL<br />
CD<br />
CDO<br />
CDPS<br />
CERMON<br />
CG<br />
CORAL<br />
CSTD<br />
CWD<br />
ED<br />
EIG<br />
ESG<br />
FBR<br />
FBTR<br />
FChD<br />
FRFCF<br />
FRTG<br />
IDEAS<br />
IIS<br />
IIT<br />
IMSc<br />
ITG<br />
LMFBR<br />
MAPS<br />
MCD<br />
MMD<br />
MMG<br />
MSD<br />
MTD<br />
NFC<br />
NICB<br />
NPC<br />
NSSS<br />
PFBR<br />
PHWR<br />
REG<br />
RHS<br />
ROMG<br />
RPD<br />
RpG<br />
RRDD<br />
RSD<br />
SED<br />
SG<br />
SGTF<br />
SIRD<br />
<strong>Atomic</strong> Energy Regulatory Board<br />
Bhabha <strong>Atomic</strong> <strong>Research</strong> <strong>Centre</strong><br />
BARC Facilities<br />
Bharatiya Nabhikiya Vidyut Nigam Limited<br />
Bharat Heavy Electricals Limited<br />
Computer Division<br />
Central Design office<br />
Central Data Processing System<br />
Continuous Environmental Radiation Monitoring Network<br />
Chemistry Group<br />
COmpact facility <strong>for</strong> Reprocessing Advanced fuels in Lead cell<br />
Corrosion Science and Technology Division<br />
Central Workshop Division<br />
Electronics Division<br />
Electronics and Instrumentation Group<br />
Engineering Services Group<br />
Fast Breeder Reactor<br />
Fast Breeder Test Reactor<br />
Fuel Chemistry Division<br />
Fast Reactor Fuel Cycle Facility<br />
Fast Reactor Technology Group<br />
Innovative Design, Engineering and Synthesis<br />
Innovative Instrumentation Section<br />
Indian Institute of Technology<br />
Institute of mathematical Sciences<br />
Inspection Technology Group<br />
Liquid Metal Cooled Fast Breeder Reactor<br />
Madras <strong>Atomic</strong> Power Station<br />
Materials Chemistry Division<br />
Mechanical and Metallurgy Division<br />
Metallurgy and Materials Group<br />
Materials Science Division<br />
Materials Technology Division<br />
Nuclear Fuel Complex<br />
Nuclear Island Connected Buildings<br />
Nuclear Power Corporation<br />
Nuclear Steam Supply System<br />
Prototype Fast Breeder Reactor<br />
Pressurized Heavy Water Reactor<br />
Reactor Engineering Group<br />
Remote Handling Section<br />
Reactor Operation and Maintenance Group<br />
Reactor Physics Division<br />
Reprocessing Group<br />
Reprocessing <strong>Research</strong> and Development Division<br />
Radiological Safety Division<br />
Safety Engineering Division<br />
Safety Group<br />
Steam Generator Test Facility<br />
Scientific In<strong>for</strong>mation and Resources Division<br />
210