advances in numerical modeling of manufacturing processes
advances in numerical modeling of manufacturing processes
advances in numerical modeling of manufacturing processes

You also want an ePaper? Increase the reach of your titles
YUMPU automatically turns print PDFs into web optimized ePapers that Google loves.
Trans. Indian Inst. Met.<br />
Vol.57, No. 4, August 2004, pp. 345-366<br />
TP 1899<br />
ADVANCES IN NUMERICAL MODELING OF<br />
MANUFACTURING PROCESSES: APPLICATION TO<br />
STEEL, AEROSPACE AND AUTOMOTIVE<br />
INDUSTRIES<br />
Rajiv Shivpuri<br />
Pr<strong>of</strong>essor and Director, Manufactur<strong>in</strong>g Research Group<br />
The Ohio State University, Columbus, Ohio, USA.<br />
E-mail : shivpuri.1@osu.edu<br />
(Received 11 May 2004 ; <strong>in</strong> revised form 30 May 2004)<br />
ABSTRACT<br />
Great <strong>advances</strong> have been made recently <strong>in</strong> the model<strong>in</strong>g <strong>of</strong> manufactur<strong>in</strong>g <strong>processes</strong> that permit the <strong>in</strong>tegration<br />
<strong>of</strong> material behavior with process design and control. The objectives are <strong>of</strong>ten to reduce defects, improve part<br />
properties and quality, and to make the manufactur<strong>in</strong>g system more productive. This paper demonstrates some<br />
<strong>of</strong> these <strong>advances</strong> by provid<strong>in</strong>g <strong>in</strong>dustrial case histories from the roll<strong>in</strong>g, mach<strong>in</strong><strong>in</strong>g, die cast<strong>in</strong>g and forg<strong>in</strong>g<br />
process areas. Cases traditional f<strong>in</strong>ite element model<strong>in</strong>g with microstructural model<strong>in</strong>g, phase transformations,<br />
thermal and shear s<strong>of</strong>ten<strong>in</strong>g at high stra<strong>in</strong> rates, solidification model<strong>in</strong>g and use <strong>of</strong> statistical regression for<br />
process optimization. References have been provided <strong>in</strong> the use <strong>of</strong> AI techniques for reverse eng<strong>in</strong>eer<strong>in</strong>g the<br />
material <strong>processes</strong> for improved properties and reduced defects. It is shown that accurate physical, mechanical<br />
and thermal model<strong>in</strong>g <strong>of</strong> deformation and solidification behavior and the <strong>in</strong>terface conditions are essential to<br />
the optimal use <strong>of</strong> these advanced models for <strong>in</strong>dustrial applications which tend to be difficult <strong>in</strong> formulation.<br />
In do<strong>in</strong>g so, simplifications are <strong>of</strong>ten necessary to obta<strong>in</strong> a satisfactory solution to a complex problem.<br />
1. INTRODUCTION<br />
Numerical model<strong>in</strong>g is <strong>in</strong>creas<strong>in</strong>gly be<strong>in</strong>g used <strong>in</strong> the<br />
design and optimization <strong>of</strong> manufactur<strong>in</strong>g <strong>processes</strong><br />
for the higher quality <strong>of</strong> the product and improved<br />
production yields. Advances <strong>in</strong> <strong>numerical</strong> model<strong>in</strong>g<br />
<strong>of</strong> material behavior, efficient computational<br />
algorithms, better representation <strong>of</strong> mechanical and<br />
thermal <strong>in</strong>terfaces, and <strong>advances</strong> <strong>in</strong> computer hardware<br />
and storage devices have enabled complex s<strong>of</strong>tware<br />
to be used for process design and optimization.<br />
Several case histories are <strong>in</strong>cluded <strong>in</strong> this paper to<br />
demonstrate the application <strong>of</strong> <strong>numerical</strong> models to<br />
problems relevant to the <strong>in</strong>dustrial members <strong>of</strong> the<br />
Manufactur<strong>in</strong>g Research Group at the Ohio State<br />
University. Selected case histories are from the steel<br />
mills, the forg<strong>in</strong>g <strong>in</strong>dustry, the die cast<strong>in</strong>g <strong>in</strong>dustry<br />
and the mach<strong>in</strong>e shops. Many <strong>of</strong> these case histories<br />
are applications <strong>of</strong> <strong>numerical</strong> models together with<br />
heuristic or doma<strong>in</strong> knowledge to improve process<br />
and die designs, and to reduce defects dur<strong>in</strong>g<br />
production. These tools and approaches are necessary<br />
to produce high quality products, and to eng<strong>in</strong>eer the<br />
production systems for high productivity and quick<br />
response to customer needs.<br />
2. HOT DEFORMATION WITH<br />
MICROSTRUCTURE EVOLUTION<br />
2.1 Hot Roll<strong>in</strong>g <strong>of</strong> Bars: Application <strong>in</strong> Steel Mills<br />
Recent emphasis on manufactur<strong>in</strong>g rolled products to<br />
property specifications has resulted <strong>in</strong> researchers<br />
try<strong>in</strong>g to use thermomechanical history to model<br />
microstructural evolution dur<strong>in</strong>g the roll<strong>in</strong>g process.<br />
A typical material conversion process <strong>in</strong> roll<strong>in</strong>g mills<br />
consists <strong>of</strong> strand cast<strong>in</strong>g, hot roll<strong>in</strong>g <strong>of</strong> the strands<br />
<strong>in</strong>to rolled rods, and shear<strong>in</strong>g <strong>of</strong> rods <strong>in</strong>to billets that<br />
are converted to discrete parts <strong>in</strong> the forg<strong>in</strong>g process,<br />
Fig. 1. Often the forgeability <strong>of</strong> the rolled rod
TRANS. INDIAN INST. MET., VOL. 57, NO. 4, AUGUST 2004<br />
demonstrated that semi-empirical equations describ<strong>in</strong>g<br />
• Numerical and robust design techniques used to<br />
microstructural phenomena, such as gra<strong>in</strong> growth and<br />
reduce variability <strong>in</strong> the dimensions and properties<br />
recrystallization k<strong>in</strong>etics can be used to predict<br />
<strong>of</strong> rolled rod 6,7 metallurgical changes dur<strong>in</strong>g a hot roll<strong>in</strong>g process.<br />
• Numerical and fuzzy reason<strong>in</strong>g techniques<br />
<strong>in</strong>tegrated for optimal design <strong>of</strong> roll passes for<br />
improved rod quality 8,9<br />
• Artificial Neural Networks along with <strong>numerical</strong><br />
techniques used to reverse eng<strong>in</strong>eer the roll<strong>in</strong>g<br />
Fig. 1: The physical <strong>processes</strong> <strong>in</strong> a steel rod roll<strong>in</strong>g mill<br />
process for f<strong>in</strong>ished dimensions and<br />
depends on the rolled microstructure that is controlled microstructure 10,11<br />
by the f<strong>in</strong>ish<strong>in</strong>g temperature. Accurate model<strong>in</strong>g <strong>of</strong><br />
• Numerical methods <strong>in</strong>tegrate with the<br />
hot roll<strong>in</strong>g therefore requires an <strong>in</strong>tegrated approach<br />
mathematical, physics based models <strong>of</strong><br />
that models the microstructural evolution together<br />
microstructural evolution for improved<br />
with the deformation and heat transfer <strong>processes</strong>.<br />
predictions <strong>of</strong> metal flow and austenite gra<strong>in</strong><br />
FEM model<strong>in</strong>g <strong>of</strong> the deformation process provides size 12-19<br />
an accurate way <strong>of</strong> obta<strong>in</strong><strong>in</strong>g the thermomechanical<br />
• Numerical models <strong>in</strong>tegrate with transformation<br />
history <strong>of</strong> the workpiece. A three dimensional<br />
curves for improved predictions <strong>of</strong> properties <strong>of</strong><br />
Eulerian f<strong>in</strong>ite element code (ROLPAS) based on<br />
rolled rod after cool<strong>in</strong>g 20, 22 .<br />
rigid-viscoplastic assumption for the material behavior<br />
was developed at the Ohio State University that can<br />
model thermo-mechanical changes dur<strong>in</strong>g roll<strong>in</strong>g<br />
deformation and thermal changes between roll passes,<br />
as shown <strong>in</strong> Fig. 2 1 . This s<strong>of</strong>tware was used along<br />
with other analytical and knowledge based techniques<br />
This paper provides greater details on the approach<br />
<strong>in</strong>tegrat<strong>in</strong>g microstructural evolution with <strong>numerical</strong><br />
methods to predict gra<strong>in</strong> size and chang<strong>in</strong>g flow stress<br />
dur<strong>in</strong>g hot roll<strong>in</strong>g. The rest <strong>of</strong> the approaches are<br />
left for reader to explore.<br />
to address <strong>in</strong>dustrial problems. Examples <strong>of</strong> these<br />
<strong>in</strong>clude,<br />
2.2 Development <strong>of</strong> microstructure evolution<br />
models<br />
• FEM models applied to analyze roll pass design<br />
<strong>in</strong> rod roll<strong>in</strong>g 1-5<br />
The pioneer<strong>in</strong>g work by Sellars and Whiteman 23<br />
Fig. 2 : Thermo-mechanical phenomena dom<strong>in</strong>ant dur<strong>in</strong>g multi-pass roll<strong>in</strong>g<br />
346
RAJIV SHIVPURI : NUMERICAL MODELING OF MANUFACTURING PROCESSES<br />
d 0<br />
At The Ohio State University, microstructure<br />
evolution models for vanadium modified ferritepearlite<br />
microalloyed steel TMS80R were <strong>in</strong>tegrated<br />
with the FEM models for process simulations. To<br />
model austenite evolution <strong>in</strong> a thermomechanical<br />
control process, it is necessary to develop the models<br />
for gra<strong>in</strong> growth k<strong>in</strong>etics, static recrystallization<br />
k<strong>in</strong>etics, metadynamic recrystallization k<strong>in</strong>etics, and<br />
recrystallized gra<strong>in</strong> size ( d<br />
rex<br />
). These models were<br />
developed by conduct<strong>in</strong>g controlled heat<strong>in</strong>g and hot<br />
compression tests on a Gleeble 3500<br />
thermomechanical test<strong>in</strong>g mach<strong>in</strong>e at DSI Inc. Details<br />
on the test<strong>in</strong>g can be found <strong>in</strong> Pauskar 12 .<br />
2.2.1 Gra<strong>in</strong> growth model<br />
Gra<strong>in</strong> growth us<strong>in</strong>g conventional gra<strong>in</strong> growth law<br />
and regression analysis yielded the follow<strong>in</strong>g gra<strong>in</strong><br />
growth model for TMS80R<br />
5 5<br />
32 ⎛ 655826 ⎞<br />
d = d0<br />
+ 1.26×<br />
10 t ⋅exp⎜<br />
⎟ (1)<br />
⎝ RT ⎠<br />
Here, d is the austenite gra<strong>in</strong> size at time t (<strong>in</strong><br />
microns), is the <strong>in</strong>itial gra<strong>in</strong> size (microns), T<br />
is the absolute temperature (K), R is the universal<br />
gas constant. To apply this isothermal model under<br />
non-isothermal conditions we used <strong>in</strong>cremental<br />
<strong>numerical</strong> computation. In this procedure, the timetemperature<br />
cool<strong>in</strong>g (or heat<strong>in</strong>g) curve is divided <strong>in</strong>to<br />
several small time segments. In each <strong>of</strong> these segments,<br />
the temperature is assumed to be held constant. If the<br />
<strong>in</strong>itial gra<strong>in</strong> size <strong>in</strong> time segment 1 is d<br />
01<br />
, the gra<strong>in</strong><br />
size at the end <strong>of</strong> m th segment is given by:<br />
n<br />
m m<br />
⎛ Q ⎞<br />
dt<br />
= d01 + K∑∆ti<br />
exp ⎜<br />
⎟<br />
(2)<br />
i=<br />
1 ⎝ RTi<br />
⎠<br />
Where Q is the activity coefficient and K is a constant.<br />
2.2.2 Recrystallization model<br />
Most <strong>of</strong> the microstructural changes <strong>in</strong> bar roll<strong>in</strong>g<br />
are due to the static and metadynamic recrystallizations<br />
phenomena. Double hit compression tests were<br />
conducted for model<strong>in</strong>g recrystallization k<strong>in</strong>etics us<strong>in</strong>g<br />
stra<strong>in</strong>, stra<strong>in</strong> rate, temperature, gra<strong>in</strong> size and <strong>in</strong>terhit<br />
time as the control variables. Details on the<br />
experiments can be found <strong>in</strong> Pauskar 12 . The k<strong>in</strong>etics<br />
for static and metadynamic recrystallizations were<br />
modeled us<strong>in</strong>g an Avrami type relation<br />
n<br />
⎛ ⎛ t ⎞ ⎞<br />
X = 1 −exp −0.<br />
693<br />
⎜<br />
⎜ ⎟<br />
⎝ ⎝ t ⎠ ⎟<br />
(3)<br />
05 . ⎠<br />
Where X is the material fraction recrystallized at<br />
time t, t 0.5<br />
is the time for 50% recrystallization and<br />
n is the time exponent which is assumed to be a<br />
constant. The value <strong>of</strong> n was determ<strong>in</strong>ed to be 1.46<br />
for static recrystallization and 1.0 for metadynamic<br />
recrystallization. Regression analysis on the<br />
experimental data yielded the follow<strong>in</strong>g models for<br />
Static recrystallization:<br />
t<br />
= 1.73×<br />
10<br />
−10<br />
−1.78<br />
−0.433<br />
0.5<br />
ε ε<br />
Metadynamic recrystallization:<br />
−6<br />
−<br />
t0.5<br />
= 5.78×<br />
10 ε<br />
1.00<br />
&<br />
d<br />
0.15<br />
0<br />
Z<br />
d<br />
0.60<br />
0<br />
−0.6<br />
app<br />
⎛197000<br />
⎞<br />
exp⎜<br />
⎟<br />
⎝ RT ⎠<br />
(4)<br />
⎛ 230000 ⎞<br />
⋅ exp⎜<br />
⎟<br />
⎝ RT ⎠<br />
(5)<br />
⎛197000<br />
⎞<br />
Where Z app<br />
= ε& ⋅ exp⎜<br />
⎟ is the apparent<br />
⎝ RT ⎠<br />
Zener-Hollomon parameter for the deformation <strong>in</strong><br />
the roll gap.<br />
Recrystallized gra<strong>in</strong> size:<br />
Experiments were performed with stra<strong>in</strong>, stra<strong>in</strong> rate,<br />
gra<strong>in</strong> size and temperature as the control variables.<br />
The follow<strong>in</strong>g equations were developed to model<br />
recrystallized gra<strong>in</strong> size ( d ).<br />
Static Recrystallization:<br />
⎛ ⎞<br />
= ⋅<br />
−0.341<br />
⋅<br />
−0.06<br />
0.58 3586<br />
d rex<br />
36.5 ε & ε ⋅ d<br />
0<br />
exp⎜<br />
− ⎟<br />
⎝ T ⎠<br />
(6)<br />
Metadynamic recrystallization:<br />
⎛ ⎞<br />
= ⋅<br />
−0.72<br />
⋅<br />
−0.113<br />
0.39 3544<br />
d rex<br />
53.41 ε & ε ⋅ d<br />
0<br />
exp⎜<br />
− ⎟<br />
⎝ T ⎠<br />
(7)<br />
rex<br />
347
TRANS. INDIAN INST. MET., VOL. 57, NO. 4, AUGUST 2004<br />
2.2.3 Partial recrystallization <strong>in</strong> a multi-stage<br />
deformation process<br />
Often dur<strong>in</strong>g the roll<strong>in</strong>g process, the time <strong>in</strong> the<br />
<strong>in</strong>terstand is not sufficient for complete<br />
recrystallization to occur. In other words, some<br />
amount <strong>of</strong> stra<strong>in</strong> is reta<strong>in</strong>ed <strong>in</strong> the microstructure<br />
when it enters the next deformation pass. Several<br />
approaches have been proposed to handle partial<br />
recrystallization. One <strong>of</strong> the approaches is to treat<br />
the microstructure as an aggregate. The reta<strong>in</strong>ed stra<strong>in</strong><br />
and the effective gra<strong>in</strong> sizes are determ<strong>in</strong>ed us<strong>in</strong>g the<br />
rule <strong>of</strong> mixtures:<br />
ε<br />
ret<br />
= ε ⋅( 1− X )<br />
(8)<br />
d<br />
eff<br />
( 1−<br />
X ) ⋅ d0<br />
= X ⋅ d +<br />
(9)<br />
rex<br />
where, X is the fraction recrystallized, ε ret<br />
is the<br />
reta<strong>in</strong>ed stra<strong>in</strong>, d<br />
eff is the effective gra<strong>in</strong> size, d<br />
0<br />
is the <strong>in</strong>itial as heated gra<strong>in</strong> size and d rex<br />
is the<br />
recrystallized gra<strong>in</strong> size.<br />
The other approach is to treat the recrystallized and<br />
unrecrystallized fractions <strong>in</strong>dependently (Karhausen<br />
and Kopp 24 ). However, the number <strong>of</strong> fractions to<br />
be handled <strong>in</strong>creases exponentially, which calls for<br />
tremendous amount <strong>of</strong> computer memory and time.<br />
Yanagimoto et al. 25 proposed a variation <strong>of</strong><br />
Karhausen’s model. In this approach, the number <strong>of</strong><br />
fractions <strong>in</strong>creases l<strong>in</strong>early, which requires<br />
considerably less memory. However, as with the rule<br />
<strong>of</strong> mixtures, considerable approximation is <strong>in</strong>volved<br />
and the true behavior <strong>of</strong> the system is not represented.<br />
Here, three hit compression tests were conducted to<br />
determ<strong>in</strong>e the validity <strong>of</strong> the rule <strong>of</strong> mixtures. In the<br />
three hit compression tests, the first <strong>in</strong>ter hit time<br />
was kept deliberately short to cause partial<br />
recrystallization. The second hit was followed by a<br />
third hit with an <strong>in</strong>ter-hit time between the two. The<br />
amount <strong>of</strong> recrystallization <strong>in</strong> the second <strong>in</strong>ter-hit<br />
time was measured us<strong>in</strong>g the same procedure as was<br />
used <strong>in</strong> the double hit compression tests. It was found<br />
that the rule <strong>of</strong> mixtures shows a better correlation<br />
with the measurements for TMS80R and was hence<br />
used <strong>in</strong> the <strong>in</strong>tegrated model.<br />
2.3 Microstructure dependent flow stress model<br />
Flow stress <strong>of</strong> steel at hot roll<strong>in</strong>g temperatures was<br />
found to be strongly dependent on the microstructure,<br />
specifically the austenite gra<strong>in</strong> size <strong>in</strong> addition to<br />
process parameters such as stra<strong>in</strong>, stra<strong>in</strong> rate and<br />
temperature.<br />
f<br />
( ε , & ε , T,<br />
d )<br />
σ = f<br />
(10)<br />
0<br />
A microstructure dependent flow stress model was<br />
developed and <strong>in</strong>tegrated <strong>in</strong>to the FEM module. The<br />
flow stress model is capable <strong>of</strong> model<strong>in</strong>g the<br />
metallurgical phenomena such as stra<strong>in</strong> harden<strong>in</strong>g,<br />
dynamic recovery and recrystallization. Figures 3 and<br />
4 demonstrate the capability <strong>of</strong> the flow stress to<br />
model accurately the work harden<strong>in</strong>g and thermal<br />
s<strong>of</strong>ten<strong>in</strong>g <strong>processes</strong> occurr<strong>in</strong>g dur<strong>in</strong>g plastic<br />
deformation <strong>of</strong> steels under constant stra<strong>in</strong> rate as<br />
well as chang<strong>in</strong>g stra<strong>in</strong> rate conditions. Details about<br />
the microstructure dependent flow stress model can<br />
be found <strong>in</strong> Pauskar et al. 16<br />
2.4 Integrated Model and Validation<br />
The central feature <strong>of</strong> the <strong>in</strong>tegrated system is a three<br />
dimensional f<strong>in</strong>ite element program ROLPAS for<br />
simulat<strong>in</strong>g multi-pass shape roll<strong>in</strong>g. The nonisothermal<br />
deformation analysis <strong>in</strong> ROLPAS is based<br />
on rigid-viscoplastic assumption <strong>of</strong> the material<br />
behavior as described earlier and uses eight-node<br />
isoparametric hexahedral elements. Deformation<br />
with<strong>in</strong> the roll gap is assumed to be k<strong>in</strong>ematically<br />
steady. Such an assumption has been successfully<br />
applied earlier to steady state <strong>processes</strong> such as<br />
extrusion and roll<strong>in</strong>g.<br />
A microstructure evolution module MICON was<br />
developed and <strong>in</strong>tegrated <strong>in</strong>to ROLPAS to enable<br />
model<strong>in</strong>g <strong>of</strong> austenite evolution. MICON uses the<br />
thermomechanical history computed by the FEM<br />
model <strong>in</strong> conjunction with microstructure evolution<br />
models to determ<strong>in</strong>e the evolution <strong>of</strong> austenite dur<strong>in</strong>g<br />
hot roll<strong>in</strong>g. The evolv<strong>in</strong>g austenite was found to<br />
significantly affect the flow stress <strong>of</strong> the material<br />
while the material flow affects recrystallization<br />
k<strong>in</strong>etics. This situation calls for an iterative approach<br />
<strong>in</strong> model<strong>in</strong>g metal flow and austenite evolution. For<br />
the first pass, an <strong>in</strong>itial preheated gra<strong>in</strong> size is <strong>in</strong>put<br />
to the program. After deformation and heat transfer<br />
computations for each pass, the microstructure<br />
evolution module <strong>in</strong> conjunction with the heat transfer<br />
348
RAJIV SHIVPURI : NUMERICAL MODELING OF MANUFACTURING PROCESSES<br />
Measurements <strong>of</strong> roll loads were made on the roll<strong>in</strong>g<br />
mill. The process was simulated us<strong>in</strong>g <strong>in</strong>tegrated<br />
ROLPAS first with and then without microstructure<br />
model<strong>in</strong>g. It was seen that the predictions <strong>of</strong> the<br />
roll<strong>in</strong>g loads with microstructure model<strong>in</strong>g were<br />
with<strong>in</strong> 10% <strong>of</strong> the measurements while, the<br />
predictions without microstructure model<strong>in</strong>g were<br />
consistently much higher (Fig. 5(a)) 5,26 .<br />
Fig. 3 : Effect <strong>of</strong> temperature on flow stress.<br />
Experience with process model<strong>in</strong>g us<strong>in</strong>g FEM has<br />
shown that predictions <strong>of</strong> material spread are strongly<br />
dependent upon the flow stress model. A three pass<br />
rough roll<strong>in</strong>g schedule be<strong>in</strong>g used <strong>in</strong> a steel company<br />
to convert a 6-5/8"x 6-5/8" square billet to a 5"<br />
diameter round billet was chosen to illustrate the<br />
effect <strong>of</strong> microstructure model<strong>in</strong>g on the material<br />
flow. Figure 5(b) shows the mesh at the exit <strong>of</strong> the<br />
rolls <strong>in</strong> the second pass as predicted by the f<strong>in</strong>ite<br />
element model with and without microstructure<br />
model<strong>in</strong>g. A sketch <strong>of</strong> the actual shape seen at the<br />
end <strong>of</strong> the second pass is also shown. It can be easily<br />
seen that the f<strong>in</strong>ite element model without<br />
microstructure model<strong>in</strong>g grossly under predicts the<br />
material spread. It also fails to predict the bulge<br />
pr<strong>of</strong>ile <strong>of</strong> the workpiece. On the other hand,<br />
predictions <strong>of</strong> material spread with microstructure<br />
model<strong>in</strong>g are more accurate and the shape predicted<br />
is closer to what is seen <strong>in</strong> practice.<br />
2.5 Benefits to Industry<br />
Fig. 4 : Flow stress predictions vs. measurements under<br />
chang<strong>in</strong>g stra<strong>in</strong> rates<br />
analysis module computes recrystallized fraction and<br />
the austenite gra<strong>in</strong> size at each node <strong>in</strong> the <strong>in</strong>terstand<br />
region. In the event <strong>of</strong> complete recrystallization,<br />
gra<strong>in</strong> growth after recrystallization becomes important<br />
<strong>in</strong> determ<strong>in</strong><strong>in</strong>g the recrystallization k<strong>in</strong>etics <strong>of</strong> the<br />
next pass. Partial recrystallization is handled us<strong>in</strong>g<br />
the rule <strong>of</strong> mixtures as described earlier.<br />
The non-<strong>in</strong>tegrated approach used <strong>in</strong> earlier studies<br />
resulted <strong>in</strong> higher predictions <strong>of</strong> roll<strong>in</strong>g loads us<strong>in</strong>g<br />
FEM. A seven pass rough roll<strong>in</strong>g sequence from a<br />
lead<strong>in</strong>g steel company was chosen to study the effect<br />
<strong>of</strong> microstructure model<strong>in</strong>g on the load predictions.<br />
The roll pass sequence converts a 15"x15" <strong>in</strong>got <strong>in</strong>to<br />
a 12" round bar <strong>in</strong> seven rough roll<strong>in</strong>g passes.<br />
The microstructural based <strong>numerical</strong> model <strong>of</strong> multipass<br />
hot roll<strong>in</strong>g and post roll<strong>in</strong>g transformation provide<br />
the roll<strong>in</strong>g mills the tools to carryout the follow<strong>in</strong>g<br />
tasks:<br />
• Design and verification <strong>of</strong> roll pass sequence for<br />
given product geometry and dimensions. F<strong>in</strong>ish<br />
dimensions and temperature are <strong>of</strong>ten the design<br />
response.<br />
• Design <strong>of</strong> thermo-mechanical process<strong>in</strong>g for<br />
improved product properties and quality.<br />
Microstructure and f<strong>in</strong>al mechanical properties<br />
are control parameters.<br />
• Reduction <strong>of</strong> product defects such as seams, f<strong>in</strong>s,<br />
segregations and cobbles.<br />
• Process control for reduced variability and scrap.<br />
349
TRANS. INDIAN INST. MET., VOL. 57, NO. 4, AUGUST 2004<br />
Fig. 5 : Effect <strong>of</strong> microstructure model<strong>in</strong>g on (a) roll<strong>in</strong>g load and (b) material spread predictions<br />
350
RAJIV SHIVPURI : NUMERICAL MODELING OF MANUFACTURING PROCESSES<br />
3. PHASE TRANSFORMATIONS,<br />
THERMAL SOFTENING AND<br />
FRACTURE<br />
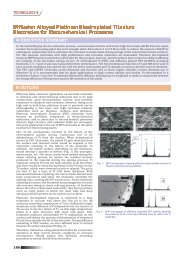
3.1 Mach<strong>in</strong><strong>in</strong>g <strong>of</strong> Titanium Alloys: Application <strong>in</strong><br />
Aerospace Industry<br />
Titanium and its alloys are used extensively <strong>in</strong><br />
aerospace <strong>in</strong>dustry because <strong>of</strong> their excellent<br />
comb<strong>in</strong>ation <strong>of</strong> high strength-to-weight ratio, high<br />
elevated temperature strength, high fracture toughness,<br />
and exceptional resistance to corrosion. On the other<br />
hand, titanium and its alloys are classified as difficultto-mach<strong>in</strong>e<br />
materials due to their <strong>in</strong>herent properties<br />
such as 1) high chemical reactivity and therefore a<br />
tendency to weld to the cutt<strong>in</strong>g tool dur<strong>in</strong>g mach<strong>in</strong><strong>in</strong>g,<br />
thus lead<strong>in</strong>g to chipp<strong>in</strong>g and premature tool failure;<br />
2) low thermal conductivity that prevents heat transfer<br />
<strong>in</strong> the material, consequently <strong>in</strong>creas<strong>in</strong>g the<br />
temperature at the tool/workpiece <strong>in</strong>terface affect<strong>in</strong>g<br />
the tool life adversely; 3) high melt<strong>in</strong>g temperature<br />
and high strength ma<strong>in</strong>ta<strong>in</strong>ed at elevated temperature<br />
and its low modulus <strong>of</strong> elasticity impair<strong>in</strong>g its<br />
mach<strong>in</strong>ability.<br />
Increase <strong>in</strong> cutt<strong>in</strong>g speed usually results <strong>in</strong> rise <strong>of</strong><br />
cutt<strong>in</strong>g temperature s<strong>in</strong>ce heat generation per unit<br />
time <strong>in</strong>creases. This <strong>in</strong>crease <strong>in</strong> temperature is<br />
deleterious to the tool life, dimensional accuracy <strong>of</strong><br />
the product or mach<strong>in</strong><strong>in</strong>g efficiency. Extensive tool<br />
wear, cyclic loads and segregated chips are <strong>of</strong>ten<br />
observed <strong>in</strong> the face mill<strong>in</strong>g <strong>of</strong> titanium slabs lead<strong>in</strong>g<br />
to fast tool wear, distortion <strong>of</strong> work piece surface<br />
and <strong>in</strong>creased tool<strong>in</strong>g cost. To achieve optimal cutt<strong>in</strong>g<br />
conditions for reduced mach<strong>in</strong><strong>in</strong>g times, the cutt<strong>in</strong>g<br />
conditions and the tool are changed with the cutt<strong>in</strong>g<br />
requirements, Fig. 6.<br />
Research was <strong>in</strong>itiated <strong>in</strong> the Laboratory <strong>of</strong> Excellence<br />
for Mach<strong>in</strong><strong>in</strong>g Technology to study chip segmentation<br />
<strong>in</strong> titanium mach<strong>in</strong><strong>in</strong>g 27-30 , development <strong>of</strong> a diffusion<br />
based tool wear model 31 , study the effect <strong>of</strong> thermophysical<br />
properties 32 and to model discont<strong>in</strong>uous<br />
cutt<strong>in</strong>g <strong>in</strong> titanium mill<strong>in</strong>g 33 .<br />
3.2 Effect <strong>of</strong> temperature on the titanium flow stress<br />
High temperature over the tool/workpiece <strong>in</strong>terface<br />
is ma<strong>in</strong>ly contributed by the heat generated <strong>in</strong> the<br />
workpiece/chip dur<strong>in</strong>g the cutt<strong>in</strong>g process. It is well<br />
Fig. 6 : Different mach<strong>in</strong><strong>in</strong>g parameters are used to mach<strong>in</strong>e a titanium part optimally<br />
351
TRANS. INDIAN INST. MET., VOL. 57, NO. 4, AUGUST 2004<br />
Fig. 7 : Thermal conductivity and heat capacity <strong>of</strong> Ti-6Al-4V<br />
known that the heat generated <strong>in</strong>side the workpiece<br />
is concentrated along the primary deformation zone<br />
and the secondary deformation zones, appear<strong>in</strong>g as<br />
thermal energy. A rough estimation <strong>of</strong> the tool rake<br />
face temperature can be obta<strong>in</strong>ed us<strong>in</strong>g equation 11 34 :<br />
1 2<br />
⎛ vh ⎞<br />
T f<br />
= E⎜<br />
⎟<br />
(11)<br />
⎝ k ρ c ⎠<br />
where T f<br />
is the mean temperature over tool rake<br />
face, E is the cutt<strong>in</strong>g energy (assum<strong>in</strong>g all cutt<strong>in</strong>g<br />
energy is converted to heat), k is thermal conductivity,<br />
is density, c is specific heat, v is cutt<strong>in</strong>g speed, and<br />
h is depth <strong>of</strong> cut.<br />
From the above equation it is seen that the thermal<br />
properties significantly <strong>in</strong>fluence the temperature over<br />
the tool/workpiece <strong>in</strong>terface. The temperature varies<br />
<strong>in</strong>versely with the half-power <strong>of</strong> the change <strong>of</strong> the<br />
product <strong>of</strong> thermal conductivity k, and heat capacity<br />
rc. Thus, higher temperatures are to be expected <strong>in</strong><br />
cutt<strong>in</strong>g stronger materials (high E) at higher speed,<br />
especially if the workpiece material is a poor heat<br />
conductor <strong>of</strong> low density, and low specific heat.<br />
The density <strong>of</strong> Ti-6Al-4V can be thought as constant,<br />
while the thermal conductivity and specific heat vary<br />
with temperature. Both capacity and conductivity<br />
<strong>in</strong>crease with temperature 35 .<br />
Poor conductivity <strong>of</strong> the titanium alloys (as compared<br />
to steels) results <strong>in</strong> a larger portion <strong>of</strong> the heat<br />
generated dur<strong>in</strong>g mach<strong>in</strong><strong>in</strong>g be<strong>in</strong>g transferred to the<br />
cutt<strong>in</strong>g tool, Fig. 8 36 . This leads to high tool<br />
temperatures result<strong>in</strong>g <strong>in</strong> high tool s<strong>of</strong>ten<strong>in</strong>g and<br />
wear.<br />
Fig. 8 : Energy flow rate <strong>in</strong>to tool vs. thermal conductivity<br />
<strong>of</strong> tool 36 .<br />
Cutt<strong>in</strong>g forces and <strong>in</strong>terface pressure generated dur<strong>in</strong>g<br />
mach<strong>in</strong><strong>in</strong>g are directly proportional to the flow stress<br />
<strong>of</strong> the workpiece material at the representative thermomechanical<br />
conditions. Dur<strong>in</strong>g mach<strong>in</strong><strong>in</strong>g the titanium<br />
alloy experiences high stra<strong>in</strong>s, very high stra<strong>in</strong> rates<br />
and temperatures close to its melt<strong>in</strong>g po<strong>in</strong>t. This<br />
results <strong>in</strong> the follow<strong>in</strong>g material response:<br />
i. Rapid stra<strong>in</strong> harden<strong>in</strong>g at room temperature with<br />
stra<strong>in</strong> s<strong>of</strong>ten<strong>in</strong>g after a peak flow stress is reached<br />
(saturation <strong>of</strong> slip density <strong>in</strong> the + phase).<br />
ii.<br />
As the temperature is raised due to heat<br />
generation <strong>in</strong> the primary and secondary shear<br />
zones, both the stra<strong>in</strong> harden<strong>in</strong>g and stra<strong>in</strong><br />
s<strong>of</strong>ten<strong>in</strong>g responses reduce with phase<br />
transformations, with almost rigid-perfectly<br />
plastic behavior above beta transus.<br />
iii. The stra<strong>in</strong> s<strong>of</strong>ten<strong>in</strong>g <strong>of</strong> Ti-6Al-4V dur<strong>in</strong>g<br />
deformation varies with the change <strong>of</strong><br />
microstructure and much more marked flow<br />
s<strong>of</strong>ten<strong>in</strong>g is observed <strong>in</strong> microstructure<br />
compared to the + microstructure. The<br />
s<strong>of</strong>ten<strong>in</strong>g rate depends on the volume fraction <strong>of</strong><br />
the and phases present below the transus<br />
temperature and on the phase above this<br />
transus.<br />
iv. Stra<strong>in</strong> rate harden<strong>in</strong>g cont<strong>in</strong>ues at all temperatures<br />
with the stra<strong>in</strong> rate sensitivity <strong>in</strong>creas<strong>in</strong>g at higher<br />
temperatures. This <strong>in</strong>crease <strong>in</strong> sensitivity has a<br />
major <strong>in</strong>fluence on propagation <strong>of</strong> plastic<br />
<strong>in</strong>stability.<br />
352
RAJIV SHIVPURI : NUMERICAL MODELING OF MANUFACTURING PROCESSES<br />
v. Reduction <strong>in</strong> flow stress with <strong>in</strong>crease <strong>in</strong><br />
temperature (thermal s<strong>of</strong>ten<strong>in</strong>g) leads to stra<strong>in</strong><br />
localization which <strong>in</strong> turn causes greater<br />
deformation <strong>in</strong> the localized region. This<br />
accumulation <strong>of</strong> deformation eventually leads to<br />
material fracture and the segregated chip.<br />
For practical cutt<strong>in</strong>g speeds <strong>in</strong> mach<strong>in</strong><strong>in</strong>g, the average<br />
stra<strong>in</strong> rate <strong>in</strong> the primary shear zone lies <strong>in</strong> the range<br />
<strong>of</strong> 103 to 105 /s and effective stra<strong>in</strong> can exceed 3.0.<br />
The flow stress model should be able to cover this<br />
range. In addition, <strong>in</strong> - titanium alloys, phase<br />
transformation to takes place above transus. The<br />
orig<strong>in</strong>al flow stress data are modified on the basis <strong>of</strong><br />
published sources 37-41 . Detailed <strong>in</strong>formation about<br />
the flow behavior <strong>of</strong> Ti-6Al-4V versus temperature<br />
and stra<strong>in</strong> rate as well as the flow stress at high stra<strong>in</strong><br />
rate and high temperature can be found <strong>in</strong> these papers.<br />
Consequently, <strong>in</strong> this study, the flow stress response<br />
to chang<strong>in</strong>g stra<strong>in</strong>, stra<strong>in</strong> rate and temperature is<br />
modified based on the microstructural changes <strong>in</strong> the<br />
deformed chip. The detailed procedure can be found<br />
<strong>in</strong> papers 42, 43 . Figure 9 shows schematically the<br />
material model used <strong>in</strong> this research. The flow<br />
localization and the fracture depend on the thermomechanical<br />
behavior and the microstructure <strong>of</strong> the<br />
titanium alloy.<br />
3.3 FEM model for orthogonal mach<strong>in</strong><strong>in</strong>g<br />
In this research the cutt<strong>in</strong>g process is modeled as<br />
orthogonal mach<strong>in</strong><strong>in</strong>g. This simplification <strong>of</strong> geometry<br />
and metal flow permits the process to be assumed a<br />
2-dimensional plane stra<strong>in</strong> problem where the<br />
movement <strong>of</strong> the cutt<strong>in</strong>g tool is perpendicular to its<br />
straight cutt<strong>in</strong>g edge. A simplified FEM model for<br />
cutt<strong>in</strong>g tool, workpiece and <strong>in</strong>terface is illustrated <strong>in</strong><br />
Fig. 10.<br />
Fig. 9 : Flow stress <strong>of</strong> Ti-6Al-4V as a function <strong>of</strong> stra<strong>in</strong>,<br />
stra<strong>in</strong> rate and temperature. Note the substantial<br />
s<strong>of</strong>ten<strong>in</strong>g at large values <strong>of</strong> stra<strong>in</strong> at lower temperatures<br />
The material for the cutt<strong>in</strong>g tool is tungsten carbide<br />
(WC/Co) while the workpiece is titanium alloy<br />
Ti-6-4. The <strong>in</strong>terface between the chip and tool rake<br />
face is modeled by means <strong>of</strong> an <strong>in</strong>terface heat transfer<br />
coefficient and slid<strong>in</strong>g friction factor. The tool<br />
geometry, cutt<strong>in</strong>g process variables and material<br />
properties <strong>of</strong> tool and coat<strong>in</strong>g are listed <strong>in</strong> Table 1<br />
and Table 2 respectively. Temperature boundary<br />
condition on the tool surface is set as follows:<br />
a. Constant temperature value <strong>of</strong> 25 °C is assigned<br />
to the nodes on the rake face which are not <strong>in</strong><br />
353<br />
Fig. 10: An orthogonal FEM grid model for turn<strong>in</strong>g
TRANS. INDIAN INST. MET., VOL. 57, NO. 4, AUGUST 2004<br />
contact with workpiece due to the applied water<br />
coolant on the rake face.<br />
b. Heat exchange with air condition is assigned to<br />
the rest <strong>of</strong> the nodes on the tool surface. If a<br />
specific node is <strong>in</strong> touch with the workpiece<br />
dur<strong>in</strong>g the cutt<strong>in</strong>g cycle, heat transfer calculation<br />
will be automatically conducted by the program.<br />
Otherwise, the heat exchange with air calculation<br />
will be performed.<br />
Variables<br />
Depth <strong>of</strong> cut<br />
Rake angle<br />
Relief angle<br />
Tip radius<br />
Coat<strong>in</strong>g thickness<br />
Cutt<strong>in</strong>g speed<br />
Table 1<br />
CUTTING CONDITIONS<br />
Value<br />
0.35 mm<br />
5 o<br />
6 o<br />
0.005 mm<br />
0.05 mm<br />
12 m/m<strong>in</strong>, 60 m/m<strong>in</strong>, 120<br />
m/m<strong>in</strong>., 240 m/m<strong>in</strong>., 600<br />
m/m<strong>in</strong>.<br />
Table 2<br />
TOOL MATERIAL PROPERTIES<br />
Materials Tool substrate Coat<strong>in</strong>g<br />
Elastic modulus 558 (GPa) 672 (GPa)<br />
The experiments were conducted on a CNC Turn<strong>in</strong>g<br />
Center at cutt<strong>in</strong>g speeds <strong>of</strong> 60, 120 and 240 m/m<strong>in</strong>,<br />
feeds <strong>of</strong> 0.127 and 0.35 mm/rev and depth <strong>of</strong> cut <strong>of</strong><br />
2.54 mm. The cutt<strong>in</strong>g forces were measured with a<br />
Kistler dynamometer, Type 9121. Workpiece was a<br />
Ti-6Al-4V annealed rod. The results <strong>of</strong> these<br />
experiments and the model predictions are presented<br />
<strong>in</strong> Fig. 11. The difference <strong>in</strong> force magnitudes<br />
between those measured experimentally and predicted<br />
is less than 5% for both the feeds.<br />
Figure 12 compares <strong>of</strong> chip morphology measured<br />
and predicted by the <strong>numerical</strong> model. The shape<br />
and the pitch <strong>of</strong> the serrated chip segments <strong>in</strong> these<br />
figures show good geometric resemblance as well as<br />
reasonably close dimensional attributes. It should be<br />
noted that the orig<strong>in</strong>al chip collected from the turn<strong>in</strong>g<br />
test was a curled chip. The collected chip was then<br />
straightened and mounted. After etch<strong>in</strong>g and<br />
polish<strong>in</strong>g, the chip morphology shown <strong>in</strong> Fig. 12(a)<br />
was obta<strong>in</strong>ed from the mounted chip. The<br />
straighten<strong>in</strong>g process <strong>in</strong>creases the distance between<br />
chip serration and reduces the thickness <strong>of</strong> the segment<br />
connect<strong>in</strong>g the serration.<br />
3.4 Benefits to Industry<br />
The developed <strong>numerical</strong> model with phase<br />
transformation implicitly <strong>in</strong>cluded <strong>in</strong> the flow stress<br />
and fracture is be<strong>in</strong>g used to address <strong>in</strong>dustrial<br />
Poisson’s ratio 0.22 0.22<br />
Thermal conductivity 80 36, 80, 130<br />
(W/m/ o K) (W/m/ o K)<br />
Heat capacity 2.7910 6 2.7910 6<br />
J/m 3 / o K J/m 3 / o K<br />
Thermal expansion<br />
6.8´10 -6 (/K) 6.8´10 -6 (/K)<br />
3.4 Validation <strong>of</strong> the Numerical Model<br />
Several assumptions are made for the FEM model<br />
<strong>in</strong>clud<strong>in</strong>g rigid-viscoplastic workpiece, rigid tool, and<br />
the stra<strong>in</strong> rate and temperature dependent flow stress.<br />
The model was verified by compar<strong>in</strong>g predictions <strong>of</strong><br />
cutt<strong>in</strong>g forces and chip morphology (metal flow) with<br />
carefully conducted experiments <strong>in</strong> the mach<strong>in</strong><strong>in</strong>g<br />
laboratory.<br />
Fig. 11: A comparison <strong>of</strong> measured and predicted cutt<strong>in</strong>g<br />
forces at different feed rates and cutt<strong>in</strong>g speeds<br />
354
RAJIV SHIVPURI : NUMERICAL MODELING OF MANUFACTURING PROCESSES<br />
Fig. 12: A comparison <strong>of</strong> chip morphology between experiment (top) and predictions (bottom) at various cutt<strong>in</strong>g conditions<br />
355
TRANS. INDIAN INST. MET., VOL. 57, NO. 4, AUGUST 2004<br />
problems such as,<br />
• Optimal mach<strong>in</strong><strong>in</strong>g parameters for a given<br />
material, heat treatment and part geometry<br />
• Increased material removal rates for m<strong>in</strong>imiz<strong>in</strong>g<br />
mach<strong>in</strong><strong>in</strong>g times<br />
• Improved workpiece functional attributes such<br />
as surface <strong>in</strong>tegrity and precision<br />
• Design <strong>of</strong> cutt<strong>in</strong>g tool geometries and materials<br />
for <strong>in</strong>creased tool lives and reduced tool changes.<br />
4. SOLIDIFICATION PROCESSING<br />
AND POROSITY CONTROL<br />
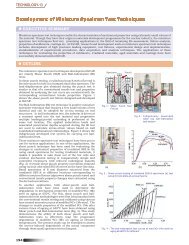
4.1 Die Cast<strong>in</strong>g <strong>of</strong> Eng<strong>in</strong>e Block: Application <strong>in</strong><br />
44, 45<br />
Automotive Industry<br />
With the emphasis on light weight cars, automotive<br />
companies are <strong>in</strong>creas<strong>in</strong>gly us<strong>in</strong>g die cast eng<strong>in</strong>e blocks<br />
from high silicon alum<strong>in</strong>um alloys (Fig. 13). In these<br />
cast<strong>in</strong>gs, the ma<strong>in</strong> cause <strong>of</strong> defect is leaker paths <strong>in</strong><br />
certa<strong>in</strong> critical areas <strong>of</strong> the cast<strong>in</strong>gs due to<br />
microporosity. These leaker defects cause the cyl<strong>in</strong>der<br />
block to fail the pressure leakage test and such cast<strong>in</strong>gs<br />
have to be discarded as scrap. The aim <strong>of</strong> this study<br />
was to redesign the gate and optimization <strong>of</strong> the<br />
<strong>in</strong>gate parameters with a focus on m<strong>in</strong>imum air<br />
entrapment for m<strong>in</strong>imum gas porosity and better<br />
fill<strong>in</strong>g <strong>of</strong> thick sections for reduces shr<strong>in</strong>kage related<br />
defects.<br />
4.2 Location and Identification <strong>of</strong> Porosity<br />
Analysis <strong>of</strong> pressure test results on the die cast and<br />
mach<strong>in</strong>ed eng<strong>in</strong>e blocks <strong>in</strong>dicated that most <strong>of</strong> the<br />
leakage occurred from two locations shown <strong>in</strong> Fig. 13:<br />
Region 1 near the bear<strong>in</strong>g area and Region 2 near the<br />
coolant entry area (the vent area for the die cast<strong>in</strong>g).<br />
Sections were cut from these locations <strong>in</strong> the cast<br />
dies, polished and exam<strong>in</strong>ed. While Region 1 showed<br />
classical porosity l<strong>in</strong>ked to shr<strong>in</strong>kage due to thermal<br />
gradients, Region 2 showed the presence <strong>of</strong> pores<br />
which were not spherical, Fig. 14.<br />
The latter pores were analyzed us<strong>in</strong>g SEM techniques.<br />
It was found that while the composition on the outside<br />
regions <strong>of</strong> the pores represented the typical<br />
composition <strong>of</strong> the Al 380 die cast<strong>in</strong>g alloy, that <strong>in</strong><br />
the <strong>in</strong>ner regions showed a high presence <strong>of</strong> oxygen,<br />
Fig. 15. This is an <strong>in</strong>dication <strong>of</strong> air be<strong>in</strong>g trappped<br />
dur<strong>in</strong>g the die cast<strong>in</strong>g process (poor fill<strong>in</strong>g dur<strong>in</strong>g<br />
metal <strong>in</strong>jecttion). It was decided to focus on reduc<strong>in</strong>g<br />
or elim<strong>in</strong>at<strong>in</strong>g air or gas entrapment dur<strong>in</strong>g metal<br />
<strong>in</strong>jection by optimiz<strong>in</strong>g the the metal flow die runner<br />
system.<br />
4.3 Flow Optimization procedure<br />
The parameters used <strong>in</strong> this optimization study were<br />
gate velocity, fill time and flow angle for the fan<br />
and the tangent gates. This simulation study was based<br />
on CastView®, a s<strong>of</strong>tware developed at The Ohio<br />
State University with support from NADCA (North<br />
American Die Cast<strong>in</strong>g Association). The design<br />
alternatives considered are shown <strong>in</strong> Fig. 16.<br />
Fig. 13: A five cyl<strong>in</strong>der eng<strong>in</strong>e block produced by die cast<strong>in</strong>g alum<strong>in</strong>um. Location <strong>of</strong> regions <strong>of</strong> <strong>in</strong>terest: Region 1 near the<br />
bear<strong>in</strong>g area, Region 2 near the vent area.<br />
356
RAJIV SHIVPURI : NUMERICAL MODELING OF MANUFACTURING PROCESSES<br />
Fig. 14: Porosity location <strong>in</strong> the vent region and its relationship to die configuration<br />
Fig. 15: Analysis <strong>of</strong> the pore composition us<strong>in</strong>g SEM: Note the presense <strong>of</strong> oxygen <strong>in</strong>side the pore (picture on the right)<br />
A Box-Behnken design array with 15 runs, <strong>in</strong>clusive<br />
<strong>of</strong> 3 center runs, was chosen for this three -level /<br />
three-factor study, Fig. 16. Simulations were<br />
performed <strong>in</strong> CastView for all the runs and the results<br />
were analyzed with a view for optimization the fill<strong>in</strong>g<br />
process. An appropriate response variable was chosen<br />
with the objective to obta<strong>in</strong> a proper fill <strong>in</strong> which the<br />
region closest to the vent fills last, and the adjo<strong>in</strong><strong>in</strong>g<br />
areas fill immediately before this region, and so on.<br />
A regression model was built with the results <strong>of</strong> the<br />
analysis. The regression model was maximized us<strong>in</strong>g<br />
Micros<strong>of</strong>t Excel® s<strong>of</strong>tware, <strong>in</strong> keep<strong>in</strong>g with the<br />
objective <strong>of</strong> maximiz<strong>in</strong>g the response (the regions<br />
near the vents should fill last). The regression equation<br />
is as follows,<br />
Response Variable = 2.37523 – 10.123372 A +<br />
0.000370338 B – 0.022142558 C + 32.057016 A2<br />
+ 0.00001824 B2 – 0.0002299 C2 –0.0131143 AB<br />
+ 0.030074282 AC + 0.000019886 BC<br />
Where A refers to the fill time (sec), B refers to the<br />
gate velocity (m/s),C refers to the flow angle (degrees)<br />
The range <strong>of</strong> variation used for the parameters was<br />
as def<strong>in</strong>ed <strong>in</strong> the design array. It was found that the<br />
optimum values for maximum response correspond<br />
to the maximum value <strong>of</strong> the gate velocity, m<strong>in</strong>imum<br />
value <strong>of</strong> the fill time and flow angle <strong>in</strong> the range <strong>of</strong><br />
variation. A runner was designed for the best design<br />
alternative us<strong>in</strong>g standard NADCA guidel<strong>in</strong>es.<br />
4.4 Comparison <strong>of</strong> the new design and exist<strong>in</strong>g<br />
design us<strong>in</strong>g FLOW3D<br />
A cavity fill<strong>in</strong>g simulation us<strong>in</strong>g the new gate design<br />
parameters was performed us<strong>in</strong>g the s<strong>of</strong>tware package<br />
Flow3D (a f<strong>in</strong>ite difference s<strong>of</strong>tware for fluid<br />
dynamics) and compared with simulations performed<br />
with exist<strong>in</strong>g gate designs 45 . For this simulation the<br />
best design alternative was chosen. Us<strong>in</strong>g design<br />
357
TRANS. INDIAN INST. MET., VOL. 57, NO. 4, AUGUST 2004<br />
Fig. 16: The geometric parameters <strong>of</strong> the gate and the design values chosen <strong>in</strong> the optimization.<br />
symmetry, a two-cyl<strong>in</strong>der model was used for<br />
simulation as it reasonably represents the fill<strong>in</strong>g<br />
characteristics <strong>of</strong> the entire block s<strong>in</strong>ce cross-flow<br />
between cyl<strong>in</strong>ders is very less.<br />
The results and comparisons <strong>of</strong> the simulations are<br />
shown <strong>in</strong> Fig. 17. In the simulation <strong>of</strong> the exist<strong>in</strong>g<br />
design, the runner system is <strong>in</strong>cluded while <strong>in</strong> the<br />
simulation <strong>of</strong> the new design, a runner system has<br />
not been <strong>in</strong>cluded. Consequently, <strong>in</strong> the new design<br />
the metal reaches the gate very fast, whereas <strong>in</strong> the<br />
exist<strong>in</strong>g design the metal reaches the gate only after<br />
0.1 sec. So the comparison plots have been made at<br />
the same times that have elapsed after the metal<br />
reached the <strong>in</strong>gate. The figures only show the regions<br />
that have been filled with metal.<br />
In all the three figures, we can see that <strong>in</strong> the case<br />
<strong>of</strong> the new design the fill<strong>in</strong>g is faster than the exist<strong>in</strong>g<br />
<strong>in</strong>gate design case. The bear<strong>in</strong>g areas get filled much<br />
faster and hence there is more time for the thick<br />
sections to solidify and this could lead to reduced<br />
shr<strong>in</strong>kage defects <strong>in</strong> the region. The vent region and<br />
the adjo<strong>in</strong><strong>in</strong>g areas also get filled at almost the same<br />
time and hence there is lesser chance <strong>of</strong> entrapped<br />
gas porosity <strong>in</strong> that region <strong>in</strong> the new design. From<br />
the above comparison it can be seen that the new<br />
<strong>in</strong>gate design comb<strong>in</strong>ed with a larger <strong>in</strong>gate velocity<br />
favors better fill<strong>in</strong>g <strong>in</strong> the bear<strong>in</strong>g and the vent regions.<br />
This will help <strong>in</strong> the reduction <strong>of</strong> entrapped gas<br />
porosity dur<strong>in</strong>g fill<strong>in</strong>g and shr<strong>in</strong>kage porosity dur<strong>in</strong>g<br />
the solidification stage.<br />
Fig. 17: The fill pattern <strong>in</strong> the new design (left) and the fill<br />
pattern <strong>in</strong> the orig<strong>in</strong>al design (right) 45<br />
4.5 Benefits to Industry<br />
This study provided to the die cast<strong>in</strong>g <strong>in</strong>dustry a<br />
358
RAJIV SHIVPURI : NUMERICAL MODELING OF MANUFACTURING PROCESSES<br />
systematic analysis approach to the analysis <strong>of</strong> porosity<br />
and its elim<strong>in</strong>ation us<strong>in</strong>g computational approaches.<br />
5. FEM AND STATISTICAL METHODS<br />
5.1 Crack<strong>in</strong>g <strong>in</strong> Cold Extruded Parts: Forg<strong>in</strong>g<br />
Industry 46-48<br />
While cold forg<strong>in</strong>g certa<strong>in</strong> automotive drive<br />
components <strong>in</strong> <strong>in</strong>dustry, ‘End cracks’ were observed<br />
to occur randomly. As the name suggests, they are<br />
found on the front end <strong>of</strong> the extruded part. These<br />
cracks are radial and propagate <strong>in</strong> the longitud<strong>in</strong>al<br />
direction. They are <strong>of</strong>ten visible to the naked eye,<br />
show<strong>in</strong>g up after the extrusion stage or dur<strong>in</strong>g<br />
subsequent mach<strong>in</strong><strong>in</strong>g operation. An example <strong>of</strong> an<br />
end crack can be seen <strong>in</strong> Fig. 18(a). These cracks<br />
lead to significant economic losses as they <strong>in</strong>crease<br />
the scrap volume and the requirement for <strong>in</strong>spection<br />
<strong>of</strong> each forged part once they are detected. Forg<strong>in</strong>g<br />
companies <strong>of</strong>ten resort to expensive <strong>processes</strong> like<br />
<strong>in</strong>-process anneal<strong>in</strong>g to reduce the probability <strong>of</strong><br />
crack<strong>in</strong>g.<br />
The center <strong>of</strong> an extruded product can develop cracks<br />
(variously known as center-burst, center-crack<strong>in</strong>g,<br />
arrowhead-fracture, or chevron-crack<strong>in</strong>g), as shown<br />
<strong>in</strong> Fig. 18(b). These cracks are attributed to a state<br />
<strong>of</strong> hydrostatic tensile stress (also called secondary<br />
tensile stresses) at the centerl<strong>in</strong>e <strong>of</strong> the deformation<br />
zone <strong>in</strong> the die. This situation is similar to the necked<br />
region <strong>in</strong> a uniaxial tensile-test specimen. The<br />
tendency for center crack<strong>in</strong>g <strong>in</strong>creases with <strong>in</strong>creas<strong>in</strong>g<br />
die angles and levels <strong>of</strong> impurities, and decreases<br />
with <strong>in</strong>creas<strong>in</strong>g extrusion ratio.<br />
The ‘Counter Shaft’ part (Fig. 18(a)) was the focus<br />
<strong>of</strong> this <strong>in</strong>vestigation. The billet material is 8620 steel.<br />
The shaft is manufactured by first shear<strong>in</strong>g a billet<br />
from a rolled rod. Then three stages <strong>of</strong> extrusion<br />
(high ratios) which is followed by one stage <strong>of</strong><br />
upsett<strong>in</strong>g. In this particular family <strong>of</strong> parts, billets <strong>of</strong><br />
larger diameter had a greater propensity for end<br />
crack<strong>in</strong>g and the percentage <strong>of</strong> cracked parts reduced<br />
greatly by anneal<strong>in</strong>g the billets after the shear<strong>in</strong>g<br />
process. Almost all cracks orig<strong>in</strong>ated <strong>in</strong> the first<br />
extrusion operation. There was a greater tendency to<br />
crack when the burr formed <strong>in</strong> the shear<strong>in</strong>g process<br />
was large, or if the sheared billet pr<strong>of</strong>ile was rather<br />
uneven or oblique. Remedies tried <strong>in</strong> the past <strong>in</strong>cluded<br />
saw<strong>in</strong>g the billets <strong>in</strong>stead <strong>of</strong> shear<strong>in</strong>g, us<strong>in</strong>g smaller<br />
diameter billets <strong>in</strong> order to have reduced extrusion<br />
ratios and anneal<strong>in</strong>g and stress reliev<strong>in</strong>g. None <strong>of</strong><br />
these remedies were able to deal with the crack<strong>in</strong>g<br />
problem effectively.<br />
There are three types <strong>of</strong> issues that can be associated<br />
with this problem:<br />
Fig. 18: Examples <strong>of</strong> crack<strong>in</strong>g dur<strong>in</strong>g cold forg<strong>in</strong>g-extrusion: (a) End Cracks observed from the outside (b) Chevron <strong>in</strong>ternal<br />
crack<strong>in</strong>g<br />
359
TRANS. INDIAN INST. MET., VOL. 57, NO. 4, AUGUST 2004<br />
i) Die design issues (friction, die angle, land, etc)<br />
ii)<br />
Material issues (fracture strength, microstructure,<br />
hardness, etc)<br />
iii) Shear<strong>in</strong>g issues (residual stresses, oblique pr<strong>of</strong>ile,<br />
etc)<br />
The last two issues related to pre-forg<strong>in</strong>g conditions<br />
which are difficult to control. Consequently, only<br />
the design issues were the focus <strong>of</strong> this <strong>in</strong>vestigation<br />
with the goal <strong>of</strong> develop<strong>in</strong>g guidel<strong>in</strong>es for the design<br />
<strong>of</strong> forg<strong>in</strong>g-extrusion dies.<br />
A logical hypothesis was presumed to expla<strong>in</strong> end<br />
crack<strong>in</strong>g phenomenon dur<strong>in</strong>g cold extrusion. The<br />
hypothesis can be stated as follows: (refer to Fig. 19)<br />
As the material is relieved out <strong>of</strong> the die land, due<br />
to elastic recovery, the surface <strong>of</strong> the extrudate tends<br />
to expand out while the center keeps flow<strong>in</strong>g<br />
unimpeded. This differential expansion causes huge,<br />
tensile, circumferential stresses to develop close to<br />
the surface, while the center is still be<strong>in</strong>g compressed<br />
giv<strong>in</strong>g rise to a radial stress gradient. When the tensile<br />
hoop stresses close to the surface exceed a critical<br />
value, the crack <strong>in</strong>itiates. This crack then propagated<br />
longitud<strong>in</strong>ally, as more and more material is extruded.<br />
stress raiser caus<strong>in</strong>g fracture to occur. This expla<strong>in</strong>s<br />
the random nature <strong>of</strong> end cracks.<br />
A review <strong>of</strong> literature showed that many brittle<br />
materials are subject to circumferential (transverse)<br />
and longitud<strong>in</strong>al surface crack<strong>in</strong>g dur<strong>in</strong>g hydrostatic<br />
extrusion. This problem <strong>of</strong> extrud<strong>in</strong>g low-ductility<br />
materials was approached <strong>in</strong> an <strong>in</strong>novative way by<br />
some researchers at Battelle Columbus Labs 49 . They<br />
established that the cracks first developed <strong>in</strong> the rear<br />
section <strong>of</strong> the die land, immediately before the exit<br />
plane and that the surface crack<strong>in</strong>g resulted from<br />
residual tensile stresses as the product left the die.<br />
The presence <strong>of</strong> a second small reduction (Fig. 20)<br />
prevents crack<strong>in</strong>g by impos<strong>in</strong>g an annular counterpressure<br />
<strong>in</strong> the extrudate as it exits the first portion<br />
<strong>of</strong> the die. This counters the axial tensile stresses<br />
aris<strong>in</strong>g from residual stresses, elastic bend<strong>in</strong>g and<br />
friction. Prevention <strong>of</strong> circumferential cracks upon<br />
exit from the second portion <strong>of</strong> the die is believed to<br />
be associated with the favorable permanent change <strong>in</strong><br />
residual stresses <strong>in</strong> the workpiece caused by the second<br />
small reduction.<br />
Two FEM simulations 50 were carried out for the<br />
5.2 F<strong>in</strong>ite element <strong>in</strong>vestigation<br />
Fig. 19: Elastic unload<strong>in</strong>g <strong>of</strong> the material as it exits the die 49<br />
This fracture hypothesis was validated us<strong>in</strong>g F<strong>in</strong>ite<br />
element Analysis <strong>of</strong> the extrusion process us<strong>in</strong>g<br />
DEFORM 2D v 5.1 50 . Simulations were carried out<br />
with elastic-plastic and rigid-plastic material models,<br />
the material hav<strong>in</strong>g elastic-plastic properties showed<br />
significantly high residual circumferential stresses as<br />
compared to the material with rigid-plastic properties.<br />
While the stresses generated were just below the<br />
fracture stress <strong>of</strong> the material <strong>in</strong> the elastic-plastic<br />
case, the presence <strong>of</strong> random defects <strong>in</strong> the material<br />
such as seams, segregations, etc. may provide the<br />
Fig. 20: (a) Standard die and (b) Double reduction die 49<br />
Where: ‘ s – semi-die angles, L ‘s – Land<br />
lengths, R – Relief between stages, - Coefficient<br />
<strong>of</strong> friction, r ‘s – Radiuses<br />
360
RAJIV SHIVPURI : NUMERICAL MODELING OF MANUFACTURING PROCESSES<br />
‘Counter Shaft’ part. The first was the conventional<br />
die with a s<strong>in</strong>gle reduction, while the second one was<br />
the new die design with double reduction. The total<br />
reduction <strong>in</strong> area was kept the same <strong>in</strong> both the cases<br />
(63%). The billet was treated as ‘elastic-plastic’,<br />
while the die and punch were treated as rigid bodies.<br />
A comparison <strong>of</strong> the stresses <strong>in</strong> the circumferential<br />
direction (Fig. 21 and Fig. 22) shows a significant<br />
reduction (above 50%) <strong>in</strong> the case with the double<br />
land (from 103.99 ksi to 45.5 ksi). As expected, this<br />
is due to the compressive stresses developed at the<br />
second reduction, which counteract the tensile stresses<br />
at the first stage. From the simulation results, we can<br />
conclude that the double reduction die is a good way<br />
<strong>of</strong> reduc<strong>in</strong>g the circumferential tensile stresses <strong>in</strong> the<br />
workpiece at the die exit. This helps <strong>in</strong> deal<strong>in</strong>g with<br />
end cracks to a certa<strong>in</strong> extent.<br />
On the other hand, the load requirements on the<br />
press are <strong>in</strong>creased about 23% ow<strong>in</strong>g to the presence<br />
<strong>of</strong> the extra reduction. This might be one <strong>of</strong> the<br />
constra<strong>in</strong>ts <strong>in</strong> the design process. The other<br />
disadvantage <strong>of</strong> this design change is that it may lead<br />
to high, tensile axial stresses along the center <strong>of</strong> the<br />
extruded part. This might lead to ‘centerburst’ or<br />
‘chevron crack<strong>in</strong>g’.<br />
5.3 Statistical Analysis<br />
It was noted that the decrease <strong>in</strong> tensile circumferential<br />
stresses (that cause end crack<strong>in</strong>g) was accompanied<br />
by a correspond<strong>in</strong>g <strong>in</strong>crease <strong>in</strong> the axial stresses (that<br />
cause chevron crack<strong>in</strong>g). Hence, there is a need to<br />
optimize the die design such that the stresses <strong>in</strong> the<br />
material at the die exit are kept at a m<strong>in</strong>imum.<br />
The follow<strong>in</strong>g factors are identified for further<br />
<strong>in</strong>vestigation (see Fig. 20): relief between stages (R,<br />
<strong>in</strong>ches), die angle (a, degrees), land length at second<br />
stage (L, <strong>in</strong>ches), % reduction at second stage, friction<br />
(m). The corner radii be<strong>in</strong>g very small have been<br />
neglected <strong>in</strong> this <strong>in</strong>vestigation. Us<strong>in</strong>g ‘Design <strong>of</strong><br />
Experiments’ (DOE) 52 the above parameters were<br />
screened to see which ones were important for further<br />
<strong>in</strong>vestigation. A 2 52 design was chosen. This resulted<br />
<strong>in</strong> 8 simulation runs. Based on <strong>in</strong>dustry practices, the<br />
high and low values were established for each <strong>of</strong> the<br />
parameters. These values were decided. The<br />
circumferential stress ( q<br />
) at the die exit was the<br />
essential response. In addition, the axial stress ( a<br />
,<br />
which might lead to chevron crack<strong>in</strong>g) was the<br />
secondary response. All the factors were found<br />
significant with respect to both these responses and<br />
hence were chosen for further <strong>in</strong>vestigation.<br />
Once the importance <strong>of</strong> various parameters was<br />
established, a f<strong>in</strong>al DOE was carried out for the<br />
Fig. 21: Circumferential stresses at die exit for the die s<strong>in</strong>gle reduction (left), double reduction (right)<br />
361
TRANS. INDIAN INST. MET., VOL. 57, NO. 4, AUGUST 2004<br />
objective <strong>of</strong> elim<strong>in</strong>at<strong>in</strong>g end crack<strong>in</strong>g <strong>in</strong> the extruded<br />
shafts, it is necessary to conta<strong>in</strong> the maximum<br />
circumferential stress ( <br />
) and the maximum axial<br />
stress ( z<br />
) below the fracture strength <strong>of</strong> the material<br />
<strong>in</strong> circumferential tension and uniaxial tension,<br />
respectively (i.e., <br />
< 107.5 ksi and z<br />
< 98 ksi).<br />
M<strong>in</strong>imize:<br />
<br />
= (136.19) – (138.74*a) + (0.48*b) +<br />
(90.61*c) + (6.59*d) – (1022.8*e) +<br />
(43.33*a 2 ) – (1.39*d 2 ) + (496.06*e 2 ) +<br />
(7.5*a*d) + (381.23*a*e) + (90.22*d*e)<br />
Fig. 22: Circumferential stress at die exit for the optimal<br />
design (Max. value: 65.16Ksi, predicted value: 59Ksi)<br />
optimization <strong>of</strong> the design. The model selected was<br />
a 3-level, five factor DOE. Us<strong>in</strong>g a ‘fractional<br />
factorial’ design, the same experiment was conducted<br />
with a reasonable level <strong>of</strong> accuracy with 15 runs.<br />
The ranges for the parameters were same as the<br />
screen<strong>in</strong>g experiment, while the middle value was<br />
simply the average <strong>of</strong> the low and high levels (see<br />
Table 3). As <strong>in</strong> the screen<strong>in</strong>g experiment, the<br />
circumferential stress ( q<br />
) was the ma<strong>in</strong> response and<br />
the axial stress ( z<br />
) was a secondary response.<br />
Table 3<br />
LOW, MIDDLE AND HIGH VALUES FOR THE FACTORS<br />
Parameter Low Middle High<br />
(-1) (0) (+1)<br />
Relief Btw Stages (<strong>in</strong>) 0 .375 0.75<br />
Die angle (degrees) 5 11.75 18.5<br />
Land (<strong>in</strong>) 0.15 0.325 0.5<br />
Reduction (%) 4 7 10<br />
Friction (m) 0.08 .14 0.2<br />
Us<strong>in</strong>g regression analysis, nonl<strong>in</strong>ear equations were<br />
obta<strong>in</strong>ed for circumferential stress and axial stress <strong>in</strong><br />
terms <strong>of</strong> the design variables (factors).<br />
5.4 Optimization <strong>of</strong> the die design<br />
Us<strong>in</strong>g the regression equations and the values <strong>of</strong> the<br />
design parameters from common <strong>in</strong>dustry knowledge<br />
and practices, the follow<strong>in</strong>g nonl<strong>in</strong>ear m<strong>in</strong>imization<br />
problem was formulated. To meet the prelim<strong>in</strong>ary<br />
Subject to:<br />
z<br />
= (79.97) + (256.16*a) - (13.78*b) +<br />
(31.04*c) - (1.81*d) + (91.79* e) -<br />
(225.72* a 2 ) + (0.664* b 2 ) + (0.08*d 2 ) -<br />
(0.44*a*b) - (7.03*a*d) + (0.498*d*b)<br />
80<br />
Where the design constra<strong>in</strong>ts are:<br />
0 a (relief between stages) 0.75; 3 b (die<br />
angle) 15; 0.05 c (die land ) 0.5 4 d (%<br />
reduction ) 10 and 0.08 e (coefficient <strong>of</strong> friction)<br />
0.2<br />
Us<strong>in</strong>g the solver <strong>in</strong> Micros<strong>of</strong>t Excel ® , the follow<strong>in</strong>g<br />
optimum solution (Table 4) to the problem was<br />
obta<strong>in</strong>ed:<br />
Table 4<br />
OPTIMAL VALUES OF THE DESIGN PARAMETERS<br />
Variable Parameter name Optimal value<br />
a * relief between stages 0.587 <strong>in</strong><br />
b * die angle 5.146 o<br />
c * die land length 0.05 <strong>in</strong><br />
d * % reduction 10 %<br />
e * coefficient <strong>of</strong> friction 0.08<br />
5.5 Validation <strong>of</strong> optimal design<br />
The optimal design was <strong>in</strong>corporated <strong>in</strong>to<br />
DEFORM2D and was tested for consistency (Fig. 22).<br />
The predicted and observed values were very much<br />
<strong>in</strong> agreement, as shown <strong>in</strong> Table 5. The observed<br />
362
RAJIV SHIVPURI : NUMERICAL MODELING OF MANUFACTURING PROCESSES<br />
and the predicted values deviate by +10.44 % for <br />
and by -7.27 % for z<br />
.<br />
Table 5<br />
OPTIMAL VALUES OF THE STRESSES AND THEIR<br />
FACTORS OF SAFETY<br />
Variable Optimal Value Fracture Factor <strong>of</strong><br />
From From stress(2) Safety<br />
Equation FEA (2) / (1)<br />
<br />
*<br />
(Circ) 59 Ksi 65 Ksi 1.822 107.5 Ksi<br />
z<br />
*<br />
80 Ksi 74 Ksi 1.225 98 Ksi<br />
5.6 Die design guidel<strong>in</strong>es<br />
To provide flexibility to the die designer, a ‘range’<br />
has to be provided for each die design parameter.<br />
This range will give the die designer the required<br />
flexibility while choos<strong>in</strong>g the values <strong>of</strong> the die design<br />
parameters, while ma<strong>in</strong>ta<strong>in</strong><strong>in</strong>g the stresses (both axial<br />
and circumferential) well below their m<strong>in</strong>imum. In<br />
Table 4, the lower limit is the smallest value that the<br />
parameter can take while hold<strong>in</strong>g all other parameters<br />
fixed and still satisfy the constra<strong>in</strong>ts. The upper limit<br />
is the greatest value. Table 6 shows the safe ranges<br />
for each parameter, determ<strong>in</strong>ed by sensitivity analysis<br />
and rounded <strong>of</strong>f.<br />
Table 6<br />
RANGES FOR THE DIE DESIGN PARAMETERS AND<br />
Parameter<br />
THEIR EFFECT ON THE STRESSES<br />
relief between stages<br />
die angle<br />
die land<br />
Safe range<br />
0.55 <strong>in</strong> – 0.75 <strong>in</strong><br />
5 o – 8 o<br />
0.05 <strong>in</strong> - 0.2 <strong>in</strong><br />
% reduction 8% - 10%<br />
friction coefficient(m) 0.08 - 0.15<br />
Based on the literature on ductile fracture <strong>of</strong> materials,<br />
the form<strong>in</strong>g limit diagram (Fig. 23) for 8620 steel<br />
was constructed. These guidel<strong>in</strong>es are meant to be<br />
used with F<strong>in</strong>ite Element Analysis. When a simulation<br />
is conducted for 8620 steel, the fracture limits can be<br />
determ<strong>in</strong>ed from the above figure. The area O-A-B-<br />
C is the safe operat<strong>in</strong>g zone.<br />
Various stress states were looked <strong>in</strong>to at the different<br />
stages <strong>of</strong> extrusion. A comparison <strong>of</strong> the stress states<br />
was thus made between the s<strong>in</strong>gle reduction die<br />
(orig<strong>in</strong>al design) and double reduction die (optimal<br />
design). A ‘po<strong>in</strong>t track<strong>in</strong>g’ rout<strong>in</strong>e was undertaken<br />
us<strong>in</strong>g DEFORM2D. One typical po<strong>in</strong>t on the billet,<br />
<strong>in</strong> the area where stress is maximum, was selected<br />
and its stress pr<strong>of</strong>ile was tracked for the entire<br />
extrusion process. This was done for both the s<strong>in</strong>gle<br />
and double reduction die.<br />
Fig. 23: Form<strong>in</strong>g limit diagram for extrusion <strong>of</strong> the counter shaft<br />
363
TRANS. INDIAN INST. MET., VOL. 57, NO. 4, AUGUST 2004<br />
It was found that both s<strong>in</strong>gle and double reduction<br />
dies follow almost similar paths for circumferential<br />
stress, s<strong>in</strong>ce the nature <strong>of</strong> the deformation is similar.<br />
Also the axial stress paths are almost similar for the<br />
first reduction and emergence from the first land.<br />
S<strong>in</strong>ce the percentage reduction is lesser at the first<br />
stage <strong>of</strong> the double reduction die as compared to the<br />
s<strong>in</strong>gle reduction die, there are some tensile axial<br />
stresses at the center <strong>in</strong> the case <strong>of</strong> the former.<br />
Industrial trials with the new double reduction die<br />
design elim<strong>in</strong>ated the cracks <strong>in</strong> the typical trial <strong>of</strong><br />
10,000 parts. This validated the design predictions.<br />
7. CONCLUSIONS<br />
Advances <strong>in</strong> <strong>numerical</strong> techniques along with accurate<br />
model<strong>in</strong>g <strong>of</strong> material behavior have made it possible<br />
to analyze and optimize deformation and solidification<br />
<strong>processes</strong> for significant improvement <strong>in</strong> process<br />
quality and productivity. Recently, these techniques<br />
have been augmented by AI tools such as fuzzy<br />
reason<strong>in</strong>g and ANNs that enable <strong>in</strong>corporation <strong>of</strong><br />
doma<strong>in</strong> knowledge. In addition, SPC and robust<br />
design techniques have been <strong>in</strong>tegrated to reduce<br />
variability and to improve product properties. The<br />
collaborative <strong>in</strong>dustrial-governmental-academic<br />
research be<strong>in</strong>g conducted at the Manufactur<strong>in</strong>g<br />
Research Group, The Ohio State University has<br />
resulted <strong>in</strong> significant cost reduction, and quality and<br />
productivity improvements for the participat<strong>in</strong>g<br />
<strong>in</strong>dustry. The cases presented <strong>in</strong> this paper are only<br />
a few examples <strong>of</strong> the application <strong>of</strong> these advanced<br />
theoretical techniques to the steel mills and the<br />
aerospace and automotive manufacturers (die cast<strong>in</strong>g<br />
and forg<strong>in</strong>g). The goal <strong>of</strong> this paper was to<br />
demonstrate the few successes <strong>of</strong> this collaborative<br />
effort.<br />
ACKNOWLEDGMENTS<br />
The support provided by the member companies<br />
(Timken, Inland steel and Chaparral steel) <strong>of</strong> the<br />
Consortium for the Advancement <strong>of</strong> Roll<strong>in</strong>g<br />
Technology, by the Volvo Car Company, by the<br />
Sikorsky Aircraft Corporation, the Metaldyne<br />
Corporation and by the Dynamic Systems Incorporated<br />
(DSI) is gratefully acknowledged. The author also<br />
wishes to acknowledge the support from the<br />
Department <strong>of</strong> Energy and the UES, Inc; from SFTC,<br />
Columbus OH, for provid<strong>in</strong>g FEA s<strong>of</strong>tware DE-<br />
FORM_2D TM ; and from TechSolve, C<strong>in</strong>c<strong>in</strong>nati OH<br />
for provid<strong>in</strong>g help with experiments for the mach<strong>in</strong><strong>in</strong>g<br />
research. The author f<strong>in</strong>ally expresses his appreciation<br />
to Praveen Pauskar, Jiang Hua, Shivakumar Kannan,<br />
Venkat Sankararaman, Ashish Pabalkar, Peeyush<br />
Mittal and Satish K<strong>in</strong>i, and the former and current<br />
research associates at The Ohio State University, for<br />
their hard work and efforts.<br />
REFERENCES<br />
1. Kim N, Lee S M, Sh<strong>in</strong> W, and Shivpuri R, J. <strong>of</strong> Engr.<br />
for Industry, 114 (1992) pp 329-335.<br />
2. Sh<strong>in</strong> W, Lee S M, Shivpuri R, and Altan T, J. Matls.<br />
Proc. Tech., 33(1-2) (1992) pp 141-154.<br />
3. Lee S M, Sh<strong>in</strong> W, and Shivpuri R, Int. J. Mach<strong>in</strong>e<br />
Tools and Manufacture, 32(3) (1992) pp. 315-327.<br />
4. Shivpuri R, Sh<strong>in</strong> W, and Mehrotra R, J. <strong>of</strong> Matls. and<br />
Manufac, Trans. Society <strong>of</strong> Automotive Eng<strong>in</strong>eers,<br />
(1992).<br />
5. Sawamiphakdi K, Ives J E, Damm E B, Shivpuri R,<br />
and Pauskar P, Steel Roll<strong>in</strong>g ’98, Seventh Int. Conf. on<br />
Steel Roll<strong>in</strong>g, Tokyo, Japan, (1998).<br />
6. Yoshimura K, K<strong>in</strong>i S, and Shivpuri R, Trans. NAMRI/<br />
SME, Society <strong>of</strong> Manufactur<strong>in</strong>g Eng<strong>in</strong>eers, XXV (1997)<br />
pp 55-60.<br />
7. K<strong>in</strong>i S, and Shivpuri R, Proc. 40 th MWSP Conf., Iron<br />
and Steel Society, Pittsburgh, PA, (1998).<br />
8. Shivpuri R, and K<strong>in</strong>i S, Proc. 39th MWSP Conference,<br />
Iron & Steel Society, Indianapolis, IN, (1997).<br />
9. K<strong>in</strong>i S, and Shivpuri R, Iron and Steel Eng<strong>in</strong>eer, Iron<br />
and Steel Society, (2001).<br />
10. Shivpuri R, K<strong>in</strong>i S, and Ji M, Proc. 8 th Int. Conf. on<br />
Steel Roll<strong>in</strong>g & 44 th MWSP, Iron and Steel Society,<br />
Orlando, FL, (2002).<br />
11. Ji M, K<strong>in</strong>i S, and Shivpuri R., Trans. NAMRI/SME,<br />
XXXI (2003) p. 475.<br />
12. Pauskar P, Shivpuri R, Cho H, and Kim N, Trans.<br />
NAMRI/SME, Society <strong>of</strong> Manufactur<strong>in</strong>g Eng<strong>in</strong>eers, XXV<br />
(1997) pp. 67-74.<br />
13. Pauskar P, Phadke S, and Shivpuri R, Proc. 39th MWSP<br />
Conference, Iron & Steel Society, Indianapolis, IN,<br />
(1997).<br />
14. Pauskar P, and Shivpuri R, Proc. 40 th MWSP Conf.,<br />
364
RAJIV SHIVPURI : NUMERICAL MODELING OF MANUFACTURING PROCESSES<br />
Iron and Steel Society, Pittsburgh, PA, (1998).<br />
15. Pauskar P, and Shivpuri R, Trans.<strong>of</strong> NAMRI/SME,<br />
XXVII (1999) pp.61-67.<br />
16. Pauskar P, and Shivpuri R, Annals <strong>of</strong> the CIRP, 48(1),<br />
(1999) p. 191- 194.<br />
17. Pauskar P, and Shivpuri R, Advanced Technology <strong>of</strong><br />
Plasticity, Proc. 6 th Int. Conf. Tech. Plasticity,<br />
Nuremburg, pp. 1967, 1999.<br />
18. K<strong>in</strong>i S, and Shivpuri R, Proc. 42 nd MWSP Conf., Iron<br />
and Steel Society, Ontario, Canada, (2000).<br />
19. Shivpuri R, Pauskar P, and K<strong>in</strong>i S, Proc. <strong>of</strong> jo<strong>in</strong>t<br />
JSME/ ASME Int. Conf. on Materials and Process<strong>in</strong>g,<br />
Honolulu, Hawaii, (2002).<br />
20. Pauskar P, Phadke S, and Shivpuri R, Trans. NAMRI/<br />
SME, Society <strong>of</strong> Manufactur<strong>in</strong>g Eng<strong>in</strong>eers, XXVI (1998)<br />
pp. 85-90.<br />
21. K<strong>in</strong>i S, Pauskar P, and Shivpuri R, Proc. 22 nd Forg<strong>in</strong>g<br />
Industry Technical Conference, Lake Geneva, WI, (1999).<br />
22. Phadke S, Pauskar P, and Shivpuri R, <strong>in</strong> pr<strong>in</strong>t, J.<br />
Matls. Process. Tech, (2004).<br />
23. Sellars C M, and Whiteman J A, Metal Science, March-<br />
(1979) pp. 187-194.<br />
24. Karhausen K, and Kopp R, Proceed<strong>in</strong>gs <strong>of</strong> the<br />
International Symposium on Mathematical Model<strong>in</strong>g <strong>of</strong><br />
Hot Roll<strong>in</strong>g <strong>of</strong> Steel, (1990) 99-118.<br />
25. Yanagimoto J, Karhausen K, Brand A J, and Kopp R,<br />
Proceed<strong>in</strong>gs <strong>of</strong> the 1995 Japanese Spr<strong>in</strong>g Conference<br />
for the Technology <strong>of</strong> Plasticity, (1995) 329-331.<br />
26. Pauskar P, Damm B, Shivpuri R, Phadke S,<br />
Sawamiphakdi, K, and Ives, J, Proceed<strong>in</strong>gs <strong>of</strong> the 39th<br />
MWSPConf., ISS, 35 (1997).<br />
27. Shivpuri R, Hua J, Mittal P, and Srivastava A, Annals<br />
<strong>of</strong> CIRP, 50(1) (2002).<br />
28. Hua J, Mittal P, and Shivpuri R, Proc. 7 th ICTP, Int.<br />
Conf. on Technology <strong>of</strong> Plasticity, Yokohama, Japan,<br />
(2002).<br />
29. Hua J, and Shivpuri R, In pr<strong>in</strong>t J. <strong>of</strong> Materials<br />
Process<strong>in</strong>g Tech., (2004).<br />
30. Hua J, and Shivpuri R, Accepted J. <strong>of</strong> Engr. Matls.<br />
and Tech., (2004).<br />
31. Umbrello D, Hua J, and Shivpuri R, ESAFORM 2004,<br />
Proc. 7th Esaform Conf. on Material Form<strong>in</strong>g,<br />
Trondheim, Norway, (2004) pp 741-744.<br />
32. Hua J, and Shivpuri R, Proceed<strong>in</strong>gs <strong>of</strong> the NSF Workshop<br />
on Research Needs <strong>in</strong> Thermal Aspects <strong>of</strong> Metal Removal<br />
Processes, Ed. Ranga Komanduri, Stillwater, OK,<br />
(2003).<br />
33. Hua J, Mittal P, Shivpuri R, and Srivastava A, Proc.<br />
6 th CIRP International Workshop on Model<strong>in</strong>g <strong>of</strong><br />
Mach<strong>in</strong><strong>in</strong>g Operations, McMaster University, Ontario,<br />
Canada, (2003).<br />
34. Schey J A, Introduction to Manufactur<strong>in</strong>g Processes,<br />
3rd Edition, McGraw-Hill, (2000).<br />
35. Maekawa K, Nakano Y, and Kitagawa T,<br />
JSME International J. Series C, 39(4) (1996)<br />
pp. 864-870.<br />
36. Lee W S, and L<strong>in</strong> C F, J. Mater. Proc. Tech., 75<br />
(1998) pp. 127-136.<br />
37. Gartside M B, The M<strong>in</strong>erals, Metals & Materials Society,<br />
(1997) 101-108<br />
38. Usui E, Obikawa T, and Shirakashi T, Proc. 5th Int.<br />
Conf. Production Eng., Tokyo, (1984) pp. 233-239<br />
39. Lee D, J. Eng. Ind., 107(1) (1985) pp. 55-63.<br />
40. Semiat<strong>in</strong> S L, Lahoti G D, and Oh S I, Plenum Press,<br />
New York, (1983) pp. 119-159.<br />
41. Shivpuri R, Hua J, Mittal, P, Srivastava, A K, Annals<br />
<strong>of</strong> CIRP, 51(1) (2002) 71-74.<br />
42. Hua J, Shivpuri R, Proceed<strong>in</strong>gs <strong>of</strong> the 9th<br />
ISPE International Conference on Concurrent<br />
Eng<strong>in</strong>eer<strong>in</strong>g, Cranfield, United K<strong>in</strong>gdom, (2002)<br />
pp. 357-365.<br />
43. Sandstrom D R, and Hodowany J N, Mach<strong>in</strong><strong>in</strong>g Science<br />
and Technology, 2(2) (1998) pp. 343-353.<br />
44. Kannan, S., Sankararaman, V. and Shivpuri, R., Trans.<br />
NAMRI/SME, Society <strong>of</strong> Manufactur<strong>in</strong>g Eng<strong>in</strong>eers,<br />
XXVIII (2000) pp. 87-92.<br />
45. Shivpuri R, Sankararaman V, and Kulkarni K, Trans.<br />
<strong>of</strong> NADCA, 2001 Die Cast<strong>in</strong>g Congress and Expo,<br />
C<strong>in</strong>c<strong>in</strong>nati, (2001) pp. 143- 150.<br />
46. Shivpuri R, Pabalkar A, and K<strong>in</strong>i S, J. <strong>of</strong> Eng<strong>in</strong>eer<strong>in</strong>g<br />
Manufacture, Proc. Inst. Mech. Engr., Part B, B-08600,<br />
(2001) pp. 1377- 1384.<br />
47. Pabalkar A, K<strong>in</strong>i S, and Shivpuri R, Trans. NAMRI/<br />
SME, Society <strong>of</strong> Manufactur<strong>in</strong>g Eng<strong>in</strong>eers, XXVIII<br />
(2000) pp. 63-68.<br />
48. Pabalkar A, Shivpuri R, Proc. 23 rd Forg<strong>in</strong>g Industry<br />
Technical Conference, Reno, NV. (2001).<br />
49. Hydrostatic Extrusion, Metals Handbook, American<br />
365
TRANS. INDIAN INST. MET., VOL. 57, NO. 4, AUGUST 2004<br />
Society <strong>of</strong> Metals, N<strong>in</strong>th edition, Form<strong>in</strong>g and Forg<strong>in</strong>g,<br />
14, pp. 327-329.<br />
50. DEFORM Users Manual, Scientific Form<strong>in</strong>g<br />
Technologies Corporation, (1994).<br />
parts us<strong>in</strong>g f<strong>in</strong>ite element analysis and statistical methods,<br />
M.S. Thesis, The Ohio State University, (1999).<br />
52. Montgomery D C, Design and analysis <strong>of</strong> experiments,<br />
John Wiley and Sons, 2nd edition, (1984).<br />
51. Pabalkar A, Investigation <strong>of</strong> end crack<strong>in</strong>g <strong>in</strong> extruded<br />
366