advances in numerical modeling of manufacturing processes
advances in numerical modeling of manufacturing processes
advances in numerical modeling of manufacturing processes

Create successful ePaper yourself
Turn your PDF publications into a flip-book with our unique Google optimized e-Paper software.
TRANS. INDIAN INST. MET., VOL. 57, NO. 4, AUGUST 2004<br />
contact with workpiece due to the applied water<br />
coolant on the rake face.<br />
b. Heat exchange with air condition is assigned to<br />
the rest <strong>of</strong> the nodes on the tool surface. If a<br />
specific node is <strong>in</strong> touch with the workpiece<br />
dur<strong>in</strong>g the cutt<strong>in</strong>g cycle, heat transfer calculation<br />
will be automatically conducted by the program.<br />
Otherwise, the heat exchange with air calculation<br />
will be performed.<br />
Variables<br />
Depth <strong>of</strong> cut<br />
Rake angle<br />
Relief angle<br />
Tip radius<br />
Coat<strong>in</strong>g thickness<br />
Cutt<strong>in</strong>g speed<br />
Table 1<br />
CUTTING CONDITIONS<br />
Value<br />
0.35 mm<br />
5 o<br />
6 o<br />
0.005 mm<br />
0.05 mm<br />
12 m/m<strong>in</strong>, 60 m/m<strong>in</strong>, 120<br />
m/m<strong>in</strong>., 240 m/m<strong>in</strong>., 600<br />
m/m<strong>in</strong>.<br />
Table 2<br />
TOOL MATERIAL PROPERTIES<br />
Materials Tool substrate Coat<strong>in</strong>g<br />
Elastic modulus 558 (GPa) 672 (GPa)<br />
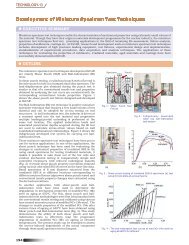
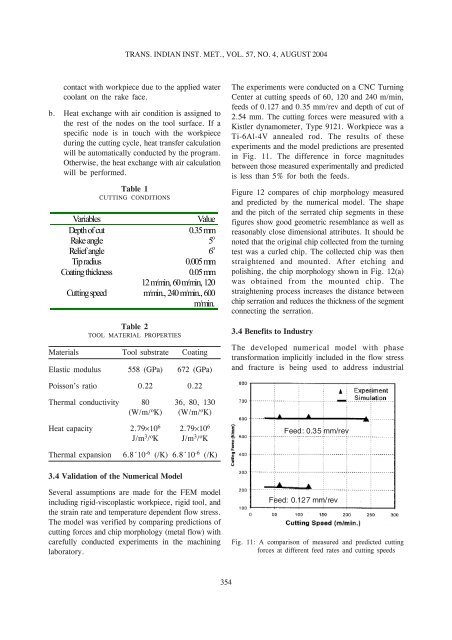
The experiments were conducted on a CNC Turn<strong>in</strong>g<br />
Center at cutt<strong>in</strong>g speeds <strong>of</strong> 60, 120 and 240 m/m<strong>in</strong>,<br />
feeds <strong>of</strong> 0.127 and 0.35 mm/rev and depth <strong>of</strong> cut <strong>of</strong><br />
2.54 mm. The cutt<strong>in</strong>g forces were measured with a<br />
Kistler dynamometer, Type 9121. Workpiece was a<br />
Ti-6Al-4V annealed rod. The results <strong>of</strong> these<br />
experiments and the model predictions are presented<br />
<strong>in</strong> Fig. 11. The difference <strong>in</strong> force magnitudes<br />
between those measured experimentally and predicted<br />
is less than 5% for both the feeds.<br />
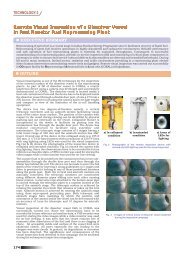
Figure 12 compares <strong>of</strong> chip morphology measured<br />
and predicted by the <strong>numerical</strong> model. The shape<br />
and the pitch <strong>of</strong> the serrated chip segments <strong>in</strong> these<br />
figures show good geometric resemblance as well as<br />
reasonably close dimensional attributes. It should be<br />
noted that the orig<strong>in</strong>al chip collected from the turn<strong>in</strong>g<br />
test was a curled chip. The collected chip was then<br />
straightened and mounted. After etch<strong>in</strong>g and<br />
polish<strong>in</strong>g, the chip morphology shown <strong>in</strong> Fig. 12(a)<br />
was obta<strong>in</strong>ed from the mounted chip. The<br />
straighten<strong>in</strong>g process <strong>in</strong>creases the distance between<br />
chip serration and reduces the thickness <strong>of</strong> the segment<br />
connect<strong>in</strong>g the serration.<br />
3.4 Benefits to Industry<br />
The developed <strong>numerical</strong> model with phase<br />
transformation implicitly <strong>in</strong>cluded <strong>in</strong> the flow stress<br />
and fracture is be<strong>in</strong>g used to address <strong>in</strong>dustrial<br />
Poisson’s ratio 0.22 0.22<br />
Thermal conductivity 80 36, 80, 130<br />
(W/m/ o K) (W/m/ o K)<br />
Heat capacity 2.7910 6 2.7910 6<br />
J/m 3 / o K J/m 3 / o K<br />
Thermal expansion<br />
6.8´10 -6 (/K) 6.8´10 -6 (/K)<br />
3.4 Validation <strong>of</strong> the Numerical Model<br />
Several assumptions are made for the FEM model<br />
<strong>in</strong>clud<strong>in</strong>g rigid-viscoplastic workpiece, rigid tool, and<br />
the stra<strong>in</strong> rate and temperature dependent flow stress.<br />
The model was verified by compar<strong>in</strong>g predictions <strong>of</strong><br />
cutt<strong>in</strong>g forces and chip morphology (metal flow) with<br />
carefully conducted experiments <strong>in</strong> the mach<strong>in</strong><strong>in</strong>g<br />
laboratory.<br />
Fig. 11: A comparison <strong>of</strong> measured and predicted cutt<strong>in</strong>g<br />
forces at different feed rates and cutt<strong>in</strong>g speeds<br />
354