advances in numerical modeling of manufacturing processes
advances in numerical modeling of manufacturing processes
advances in numerical modeling of manufacturing processes

Create successful ePaper yourself
Turn your PDF publications into a flip-book with our unique Google optimized e-Paper software.
RAJIV SHIVPURI : NUMERICAL MODELING OF MANUFACTURING PROCESSES<br />
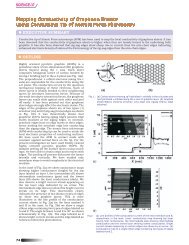
Fig. 14: Porosity location <strong>in</strong> the vent region and its relationship to die configuration<br />
Fig. 15: Analysis <strong>of</strong> the pore composition us<strong>in</strong>g SEM: Note the presense <strong>of</strong> oxygen <strong>in</strong>side the pore (picture on the right)<br />
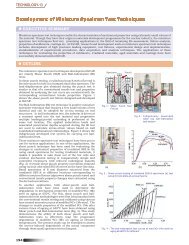
A Box-Behnken design array with 15 runs, <strong>in</strong>clusive<br />
<strong>of</strong> 3 center runs, was chosen for this three -level /<br />
three-factor study, Fig. 16. Simulations were<br />
performed <strong>in</strong> CastView for all the runs and the results<br />
were analyzed with a view for optimization the fill<strong>in</strong>g<br />
process. An appropriate response variable was chosen<br />
with the objective to obta<strong>in</strong> a proper fill <strong>in</strong> which the<br />
region closest to the vent fills last, and the adjo<strong>in</strong><strong>in</strong>g<br />
areas fill immediately before this region, and so on.<br />
A regression model was built with the results <strong>of</strong> the<br />
analysis. The regression model was maximized us<strong>in</strong>g<br />
Micros<strong>of</strong>t Excel® s<strong>of</strong>tware, <strong>in</strong> keep<strong>in</strong>g with the<br />
objective <strong>of</strong> maximiz<strong>in</strong>g the response (the regions<br />
near the vents should fill last). The regression equation<br />
is as follows,<br />
Response Variable = 2.37523 – 10.123372 A +<br />
0.000370338 B – 0.022142558 C + 32.057016 A2<br />
+ 0.00001824 B2 – 0.0002299 C2 –0.0131143 AB<br />
+ 0.030074282 AC + 0.000019886 BC<br />
Where A refers to the fill time (sec), B refers to the<br />
gate velocity (m/s),C refers to the flow angle (degrees)<br />
The range <strong>of</strong> variation used for the parameters was<br />
as def<strong>in</strong>ed <strong>in</strong> the design array. It was found that the<br />
optimum values for maximum response correspond<br />
to the maximum value <strong>of</strong> the gate velocity, m<strong>in</strong>imum<br />
value <strong>of</strong> the fill time and flow angle <strong>in</strong> the range <strong>of</strong><br />
variation. A runner was designed for the best design<br />
alternative us<strong>in</strong>g standard NADCA guidel<strong>in</strong>es.<br />
4.4 Comparison <strong>of</strong> the new design and exist<strong>in</strong>g<br />
design us<strong>in</strong>g FLOW3D<br />
A cavity fill<strong>in</strong>g simulation us<strong>in</strong>g the new gate design<br />
parameters was performed us<strong>in</strong>g the s<strong>of</strong>tware package<br />
Flow3D (a f<strong>in</strong>ite difference s<strong>of</strong>tware for fluid<br />
dynamics) and compared with simulations performed<br />
with exist<strong>in</strong>g gate designs 45 . For this simulation the<br />
best design alternative was chosen. Us<strong>in</strong>g design<br />
357