2009 1st Half Report - Indesit
2009 1st Half Report - Indesit
2009 1st Half Report - Indesit

You also want an ePaper? Increase the reach of your titles
YUMPU automatically turns print PDFs into web optimized ePapers that Google loves.
<strong>2009</strong> <strong>1st</strong> <strong>Half</strong> <strong>Report</strong>
HALF-YEAR<br />
REPORT AT<br />
30 JUNE <strong>2009</strong>
<strong>Half</strong>-year report at 30 June <strong>2009</strong><br />
<strong>Half</strong>-year report at 30 June <strong>2009</strong><br />
Milan, 30 July <strong>2009</strong><br />
Highlights<br />
Revenue of 1,203.7 million euro (1,525.3 million euro in the first<br />
half of 2008).<br />
Revenue down by 15.2% at constant exchange rates; down by<br />
21.1% at current exchange rates.<br />
Contraction of 20.3% in the volume of sales of household<br />
appliances due to the slowdown in demand.<br />
Net non-recurring charges of 34.8 million euro (16.8 million euro<br />
in the first half of 2008), mainly due to the reorganisation of<br />
manufacturing activities.<br />
Operating profit, gross of non-recurring charges of 50.2 million<br />
euro (89.2 million euro in the first half of 2008).<br />
Operating profit at constant exchange rates of 48.4 million euro;<br />
15.4 million euro at current exchange rates.<br />
Average European market share up by 0.5 percentage points<br />
during the first four months of the year.<br />
Net working capital of 163.8 million euro (250.3 million euro at 30<br />
June 2008).<br />
Net borrowing of 524.1 million euro (592.5 million euro at 30<br />
June 2008).<br />
Negative free cash flow of 50.2 million euro (negative by 261.3<br />
million euro in the first half of 2008).<br />
Contents<br />
Highlights 2<br />
Company bodies 3<br />
Interim report on operations 4<br />
Condensed half-year consolidated<br />
financial statements 19<br />
Notes 25<br />
Attachments 51<br />
30 june <strong>2009</strong> 30 june 2008 Change<br />
Euro<br />
Euro<br />
Euro<br />
%<br />
%<br />
milion<br />
milion<br />
milion<br />
Revenue 1.203,7 100,0% 1.525,3 100,0% (321,6) (21,1%)<br />
Gross operating profit before non recurring items 110,0 9,1% 149,8 9,8% (39,8) (26,6%)<br />
Gross operating profit 83,0 6,9% 136,8 9,0% (53,8) (39,3%)<br />
Operating profit before non recurring items 50,2 4,2% 89,2 5,9% (39,1) (43,8%)<br />
Operating profit 15,4 1,3% 72,4 4,7% (57,0) (78,8%)<br />
Profit before taxation (20,8) (1,7%) 58,5 3,8% (79,3) (135,5%)<br />
Profit for the period (22,6) (1,9%) 34,1 2,2% (56,7) (166,3%)<br />
Profit attributable to the Group (22,5) (1,9%) 33,7 2,2% (56,2) (166,9%)<br />
II Q <strong>2009</strong> II Q 2008 Change<br />
Euro<br />
Euro<br />
Euro<br />
%<br />
%<br />
milion<br />
milion<br />
milion<br />
Revenue 613,0 100,0% 769,1 100,0% (156,1) (20,3%)<br />
Gross operating profit before non recurring items 62,6 10,2% 73,6 9,6% (11,0) (14,9%)<br />
Gross operating profit 49,3 8,0% 59,5 7,7% (10,3) (17,2%)<br />
Operating profit before non recurring items 32,3 5,3% 44,1 5,7% (11,7) (26,7%)<br />
Operating profit 14,1 2,3% 26,2 3,4% (12,0) (46,0%)<br />
Profit before taxation (4,3) (0,7%) 22,7 2,9% (27,0) (119,0%)<br />
Profit for the period (7,9) (1,3%) 12,6 1,6% (20,5) (162,8%)<br />
Profit attributable to the Group (8,0) (1,3%) 12,1 1,6% (20,1) (165,8%)<br />
%<br />
%<br />
2
<strong>Half</strong>-year report at 30 June <strong>2009</strong><br />
Board of Directors<br />
Chairman<br />
Vice Chairman<br />
Chief Executive Officer<br />
Directors<br />
Board of Statutory Auditors<br />
Chairman<br />
Auditors<br />
Alternate Auditors<br />
Human Resources Committee<br />
Audit Committee<br />
Innovation and Technology Committee<br />
Members who are directors<br />
Members who are not directors<br />
Representative of the savings shareholders<br />
Indipendent Auditor<br />
Company bodies<br />
Vittorio Merloni<br />
Andrea Merloni<br />
Marco Milani<br />
Bruno Busacca<br />
Innocenzo Cipolletta<br />
Adriano De Maio<br />
Luca Garavoglia<br />
Mario Greco<br />
Hugh Malim<br />
Emma Marcegaglia<br />
Antonella Merloni<br />
Maria Paola Merloni<br />
Paolo Monferino<br />
Angelo Casò<br />
Andrea Amaduzzi<br />
Luigi Biscozzi<br />
Francesco Nobili<br />
Serenella Rossano<br />
Mario Greco (Chairman)<br />
Maria Paola Merloni<br />
Paolo Monferino<br />
Hugh Malim (Chairman)<br />
Innocenzo Cipolletta<br />
Antonella Merloni<br />
Adriano De Maio (Chairman)<br />
Andrea Merloni<br />
Marco Milani<br />
Luca Garavoglia<br />
Paolo Monferino<br />
Francesco Trovato<br />
Adriano Mencarini<br />
Massimo Rosini<br />
Adriano Gandola<br />
KPMG S.p.A.<br />
Manager charged with preparing the company’s financial reports<br />
Andrea Crenna<br />
3
<strong>Half</strong>-year report at 30 June <strong>2009</strong><br />
Interim report on<br />
operations<br />
at 30 June <strong>2009</strong><br />
4
<strong>Half</strong>-year report at 30 June <strong>2009</strong><br />
Introduction<br />
The <strong>Half</strong>-year <strong>Report</strong> at 30 June <strong>2009</strong>, presented pursuant to paragraph 2 of article 154-ter<br />
of the Consolidated Finance Act, has been prepared in accordance with International<br />
Financial <strong>Report</strong>ing Standards (IFRS) and, in particular, IAS 34 – Interim Financial<br />
<strong>Report</strong>ing. It comprises this Interim report on operations, the condensed, half-year<br />
consolidated financial statements and the confirmation required by paragraph 5 of article<br />
154-bis of the Consolidated Finance Act.<br />
The condensed, half-year consolidated financial statements have been reviewed by KPMG<br />
S.p.A..<br />
All the amounts presented below are stated in millions of euro, and the comparisons made<br />
(in brackets) relate to information for the prior year. Percentages (margins and changes) are<br />
determined with reference to amounts stated in thousands of euro.<br />
The Group reporting to <strong>Indesit</strong> Company S.p.A. is hereafter referred to “<strong>Indesit</strong> Company” or<br />
“<strong>Indesit</strong>” or simply the “Group”. When the commentary relates to the parent company or<br />
individual subsidiaries, their names and legal form are stated in full.<br />
The amounts presented at constant exchange rates with respect to 2008 were estimated by<br />
taking account of the transaction effects and the effect of translating to euro (the Group's<br />
functional currency) the operations reported in the foreign currency financial statements.<br />
Economic background<br />
During the first half of <strong>2009</strong>, the Group was heavily penalised by the major contraction in<br />
demand for household appliances in almost every market and, in particular, in those where<br />
<strong>Indesit</strong> Company has a leadership position: UK, Italy, France and Russia. By contrast, the<br />
slowdown in demand in countries where the Group's market share is not significant or, in any<br />
case, is lower - such as Germany - was less marked, with moderate growth in some cases.<br />
In western markets, the downward trend has affected sales of built-in products more than<br />
those of free-standing appliances, while the opposite is true in eastern markets where there<br />
is less emphasis on built-in items due to lifestyle considerations.<br />
The market downturn has been most severe for the cooking and refrigeration families of<br />
products. Demand for washers and dryers has fallen by slightly less than the overall<br />
average.<br />
5,0%<br />
0,0%<br />
-5,0%<br />
-10,0%<br />
-15,0%<br />
-20,0%<br />
Industry shipment (variation % vs the same period of previous<br />
year) Exchage rates vs EUR 30 June 09 30 June 08<br />
1,6% 1,0%<br />
GBP Average exchange rate 0,894 0,775<br />
Closing exchange rate 0,852 0,792<br />
RUR<br />
-1,9%<br />
Average exchange rate<br />
Closing exchange rate<br />
44,103<br />
43,881<br />
36,620<br />
36,948<br />
PLN Average exchange rate 4,475 3,490<br />
-11,4%<br />
Closing exchange rate 4,452 3,351<br />
-17,4%<br />
-15,6%<br />
TRY Average exchange rate 2,165 1,890<br />
Closing exchange rate 2,161 1,932<br />
Q108 Q208 Q308 Q408 Q109 Q209<br />
The considerations for the principal currencies used by the Group are somewhat similar to<br />
those made above in relation to market demand: the generalised depreciation against the<br />
euro of the British pound, the Russian rouble, the Polish zloty and the Turkish lira has<br />
squeezed the results of the Group in terms of both sales and margins.<br />
5
<strong>Half</strong>-year report at 30 June <strong>2009</strong><br />
During the first half of <strong>2009</strong>, with respect to the first half of 2008, the euro 1 appreciated by<br />
10.9% against the British pound, 18.6% against the Russian rouble, 8.6% against the<br />
Turkish lira and 30.6% against the Polish zloty.<br />
Consolidated results<br />
Group revenue for the first half of <strong>2009</strong> totalled 1,203.7 million euro (1,525.3 million euro),<br />
down 21.1%. At constant exchange rates, <strong>2009</strong> first half revenue would have been 1,293.7<br />
million euro, down 15.2%.<br />
The reduction in revenue principally reflects the lower sales of finished products, while<br />
revenue from services was down only slightly despite the depreciation of the British pound.<br />
900<br />
800<br />
700<br />
600<br />
500<br />
400<br />
300<br />
200<br />
100<br />
0<br />
Total Revenue (euro/million)<br />
Q1 2008 Q2 2008 Q3 2008 Q4 2008 Q1 <strong>2009</strong> Q2 <strong>2009</strong><br />
Revenue Breakdown 30 June 09 30 June 08 Change<br />
%<br />
%<br />
Appliances 1.102,1 1.421,9 -22,5%<br />
Services 101,6 103,4 -1,7%<br />
Total Revenue 1.203,7 1.525,3 -21,1%<br />
The decline in revenue from the sale of finished products was mainly due to lower volume,<br />
down about 20.3%, following the slump in demand in certain markets where the Group has a<br />
leadership position. This was compounded by approximately a 5.6% exchange rate effect<br />
resulting from the appreciation of the euro against the principal currencies in which the<br />
Group operates. These adverse effects were partially offset by a significant 3.5% rise in unit<br />
revenues (price/mix effect).<br />
1 Determined with reference to the average monthly rates reported by the European Central Bank<br />
6
<strong>Half</strong>-year report at 30 June <strong>2009</strong><br />
The gross operating profit (EBITDA 2 ) for the first half of <strong>2009</strong> was 83.0 million euro (136.8<br />
million euro), representing 6.9% (9.0%) of revenue.<br />
The operating profit (EBIT 3 ) for the first half of <strong>2009</strong> was 15.4 million euro (72.4 million<br />
euro), representing 1.3% (4.7%) of revenue.<br />
Before non-recurring income and expenses, operating profit (EBIT) was 50.2 million euro<br />
(89.2 million euro), representing 4.2% (5.8%) of revenue.<br />
7,0%<br />
6,0%<br />
5,0%<br />
4,0%<br />
3,0%<br />
2,0%<br />
1,0%<br />
0,0%<br />
EBIT after of non recurring items by quarter<br />
Q108 Q208 Q308 Q408 IQ09 IIQ09<br />
60<br />
50<br />
40<br />
30<br />
20<br />
10<br />
0<br />
EBIT after of non<br />
recurring (million euro<br />
- right)<br />
EBIT after of non<br />
recurring (% of<br />
revenue -left )<br />
Non recurring items - first half <strong>2009</strong><br />
Non recurring charges for restructuring (41,1)<br />
Other non recurrings items 6,3<br />
Total (34,8)<br />
The decline in operating profitability with respect to the first half of 2008 was due to negative<br />
factors associated with international market conditions, negative factors affecting the results<br />
for <strong>2009</strong> which will benefit the Group over the medium term, and positive factors deriving<br />
from successful actions and corporate transactions.<br />
The Group's operating results were penalised by a marked reduction in the volume of sales<br />
caused by the collapse in demand; with regard to production, this contraction in volume<br />
resulted in the lower absorption of industrial fixed costs. Unfavourable exchange rate<br />
movements during the first half of <strong>2009</strong> also lowered operating profits by about 33.0 million<br />
euro overall.<br />
The higher non-recurring charges will, on the other hand, benefit future years. These<br />
charges principally relate to closure of the Kinmel Park factory in the UK and the<br />
reorganisation of production at the None factory in Italy.<br />
The Group has partially offset the adverse effects described above by an improvement in the<br />
price/mix, the constant enhancement of product quality and the positive results from Service<br />
activities. Additional positive effects stemmed from a reduction in logistics costs, mainly due<br />
to lower volume despite a deterioration in the market mix with respect to the first half of 2008,<br />
as well as from the lower cost of raw materials and lower transformation costs due to the<br />
steady improvement of production processes. Efforts have also continued to lower general<br />
expenses and, in particular, to reduce advertising and promotion costs.<br />
At constant exchange rates, EBIT for the first half of <strong>2009</strong> would have been 48.4 million euro.<br />
Net financial expenses amounted to 36.2 million euro (13.9 million euro); this increase<br />
mainly reflects the higher cost of hedging exchange rate risks and an increase in the<br />
exchange rate losses incurred in relation to unhedged exposures, due to the greater volatility<br />
of exchange rates and a rise in the total average exposure. An additional adverse effect<br />
came from the mark-to-market adjustment of derivatives hedging the interest-rate risk on<br />
borrowings, including the income statement effect generated by financial instruments<br />
representing cash flow hedges.<br />
Net borrowing costs, on the other hand, fall due to the decline in interest rates.<br />
2 EBITDA: operating profit reported in the consolidated income statement, stated gross of depreciation<br />
and amortisation.<br />
3 EBIT: operating profit reported in the consolidated income statement.<br />
7
<strong>Half</strong>-year report at 30 June <strong>2009</strong><br />
The consolidated net loss for the first half of <strong>2009</strong> was 22.5 million euro (profit of 33.7<br />
million euro), after recognising significant net non-recurring charges, as mentioned above,<br />
totalling 34.8 million euro (16.8 million euro).<br />
Results by segment<br />
The Group's operating segments consist of geographical areas. Pursuant to IFRS 8, these<br />
were determined with reference to the availability of separate financial information and<br />
consistent with the principal way in which results are periodically reviewed by the Chief<br />
operating decision maker, in order to evaluate performance and the effect of strategic<br />
decisions.<br />
The Group identifies the following operating segments:<br />
- Italy;<br />
- UK and Ireland;<br />
- Russia, comprising Russia and the Asian republics;<br />
- Western Europe, comprising France, Spain, Portugal, Germany, Austria, Switzerland,<br />
Benelux, Scandinavia, Lithuania, Estonia and Latvia;<br />
- Eastern Europe, comprising Poland, Ukraine, Moldova, Czech Republic, Hungary,<br />
Romania, Greece, Turkey, Bulgaria and the Balkans;<br />
- Overseas, which includes all other non-European markets.<br />
First half of <strong>2009</strong><br />
(million Euro)<br />
Total<br />
Areas<br />
Costs not<br />
allocated<br />
Total<br />
Group<br />
Revenue 1.203,7 1.203,7<br />
Operative costs (1.129,3) (59,1) (1.188,4)<br />
Operating margin 74,5 (59,1) 15,4<br />
First half of 2008<br />
(million Euro)<br />
Total<br />
Areas<br />
Costs not<br />
allocated<br />
Total<br />
Group<br />
Revenue 1.525,3 1.525,3<br />
Operative costs (1.409,9) (43,1) (1.452,9)<br />
Operating margin 115,4 (43,1) 72,4<br />
The costs not allocated to segments principally comprise corporate costs and restructuring<br />
charges.<br />
8
<strong>Half</strong>-year report at 30 June <strong>2009</strong><br />
Italy Area<br />
(million Euro) 30 June <strong>2009</strong> 30 June 2008 Change<br />
Revenue 229,0 250,2 (21,2)<br />
Operating Margin 26,0 25,0 1,0<br />
Operating Margin % 11,4% 10,0% 1,4%<br />
The Industry shipment of household appliances sales to retailers in Italy declined in the first<br />
half <strong>2009</strong> by approximately 8.6% compared to the comparative prior year period. This fall in<br />
demand has contributed significantly to the erosion of the revenue generated by the Italy<br />
Area. In particular, the decline in the market for built-in appliances was somewhat greater<br />
than that for free-standing items. The total revenue deriving from the Group's Italian sales<br />
reflects this trend, although the effect has been attenuated by a noticeable price-mix effect<br />
combined, essentially, with the maintenance of market share and therefore market<br />
leadership.<br />
In this context and despite the higher provision for doubtful accounts with respect to 2008,<br />
the operating profit for the period achieved by the Italy Area was in line with that for the<br />
comparative prior year period. This was due to the improvement in the price/mix, a focus on<br />
fixed costs and an inevitable reduction in advertising and promotional costs.<br />
140,0<br />
135,0<br />
130,0<br />
125,0<br />
120,0<br />
115,0<br />
110,0<br />
105,0<br />
100,0<br />
120,6<br />
107,6<br />
Italy Area<br />
Revenue (million Euro)<br />
129,6<br />
121,3<br />
2008<br />
<strong>2009</strong><br />
50,0<br />
45,0<br />
40,0<br />
35,0<br />
30,0<br />
25,0<br />
20,0<br />
15,0<br />
10,0<br />
5,0<br />
-<br />
14,7<br />
Italy Area<br />
Operating Margin (million Euro)<br />
9,2<br />
10,3<br />
16,8<br />
2008<br />
<strong>2009</strong><br />
Q1<br />
Q2<br />
Q1<br />
Q2<br />
UK and Ireland Area<br />
(million Euro) 30 June <strong>2009</strong> 30 June 2008 Change<br />
Revenue 340,3 385,4 (45,1)<br />
Operating Margin 20,7 7,4 13,3<br />
Operating Margin % 6,1% 1,9% 4,2%<br />
The results for the UK and Ireland Area reflect the most significant discontinuity experienced<br />
by the Group during the first half of <strong>2009</strong>. Despite the marked depreciation of the Uk pound<br />
with respect to the comparative prior year period (15.4% drop in the average exchange rate)<br />
and the steady reduction in the proportion of production carried out in the UK (down from<br />
40% in the first half of 2008 to 31% in the first half of <strong>2009</strong>), the British organisation easily<br />
offset the adverse exchange rate effect with an improvement in the sales price/mix and a<br />
significant reduction in non-quality costs. Operating profit was more than the double of that<br />
achieved in 2008 and the market share also increased significantly, almost overshadowing<br />
the approximately 16% contraction in the market (industry shipment) during the first half of<br />
<strong>2009</strong> with respect to the comparative period. In general, all the performance indicators for<br />
the UK and Ireland Area were very good in the first half of the year.<br />
9
<strong>Half</strong>-year report at 30 June <strong>2009</strong><br />
220,0<br />
210,0<br />
200,0<br />
190,0<br />
180,0<br />
170,0<br />
160,0<br />
150,0<br />
140,0<br />
198,6<br />
169,1<br />
UK and Ireland Area<br />
Revenue (million Euro)<br />
186,8<br />
171,2<br />
2008<br />
<strong>2009</strong><br />
50,0<br />
45,0<br />
40,0<br />
35,0<br />
30,0<br />
25,0<br />
20,0<br />
15,0<br />
10,0<br />
5,0<br />
-<br />
4,7<br />
UK and Ireland Area<br />
Operating Margin( million Euro)<br />
3,2<br />
2,6<br />
17,3<br />
2008<br />
<strong>2009</strong><br />
Q1<br />
Q2<br />
Q1<br />
Q2<br />
West Europe Area<br />
(million Euro) 30 June <strong>2009</strong> 30 June 2008 Change<br />
Revenue 261,9 293,2 (31,3)<br />
Operating Margin 6,0 2,4 3,6<br />
Operating Margin % 2,3% 0,8% 1,5%<br />
Overall, sales in Western Europe declined faster during the second quarter than in the first,<br />
when the fall was relatively moderate. In particular, the two most significant markets in this<br />
area, France and Spain, suffered serious losses in sales due, once again, to the slump in<br />
demand by an estimated 10% in France and 22% in Spain (industry shipment). Despite the<br />
drop in sales, the Area's operating profit rose by 3.6 million euro with respect to the<br />
comparative period, largely due to an improvement in the sales price/mix for free-standing<br />
products, the reduction of fixed costs, the containment of advertising and promotion costs,<br />
and the lower incidence of distribution expenses. The sales performance of built-in<br />
appliances was less satisfactory in almost all West European countries, given the effects of<br />
the real estate market crisis afflicting this area.<br />
180,0<br />
170,0<br />
160,0<br />
150,0<br />
140,0<br />
130,0<br />
120,0<br />
110,0<br />
100,0<br />
90,0<br />
80,0<br />
144,6<br />
West Europe Area<br />
Revenue (million Euro)<br />
148,6<br />
131,7 130,2<br />
2008<br />
<strong>2009</strong><br />
40,0<br />
35,0<br />
30,0<br />
25,0<br />
20,0<br />
15,0<br />
10,0<br />
5,0<br />
-<br />
-5,0<br />
3,0<br />
Q1<br />
West Europe Area<br />
Operating Margin (million Euro)<br />
1,0<br />
-0,6<br />
Q2<br />
5,0<br />
2008<br />
<strong>2009</strong><br />
Q1<br />
Q2<br />
Russian Fed. Area<br />
(million Euro) 30 June <strong>2009</strong> 30 June 2008 Change<br />
Revenue 152,6 274,1 (121,5)<br />
Operating Margin 17,6 58,0 (40,4)<br />
Operating Margin % 11,5% 21,2% (9,6%)<br />
In Russia, excluding the growth achieved in January <strong>2009</strong>, the remaining months of the<br />
period experienced contractions (industry shipment) of largely more than 30% with respect to<br />
the prior year. The large decline in euro revenue from this geographical area reflects a<br />
combination of lower demand with the major depreciation of the rouble with respect to the<br />
comparative period in 2008 (20.8% drop in the average exchange rate). The decrease in<br />
operating profit, equal to 40.4 million euro, was however slowed down due to the essential<br />
self-sufficiency of the Russia Area in terms of production (74 % of sales were produced<br />
10
<strong>Half</strong>-year report at 30 June <strong>2009</strong><br />
locally during the first half), the improvement in the price/mix and the actions taken to contain<br />
overheads. Even under these circumstances, the profitability percentage achieved by the<br />
Russia Area is still among the best in the Group.<br />
140,0<br />
120,0<br />
140,3<br />
Russian Fed. Area<br />
Revenue (million Euro)<br />
133,8<br />
90,0<br />
80,0<br />
70,0<br />
60,0<br />
Russian Fed. Area<br />
Operating Margin (million Euro)<br />
100,0<br />
80,0<br />
90,8<br />
2008<br />
<strong>2009</strong><br />
50,0<br />
40,0<br />
30,0<br />
30,0 28,0<br />
2008<br />
<strong>2009</strong><br />
60,0<br />
61,7<br />
20,0<br />
10,0<br />
13,0<br />
4,6<br />
40,0<br />
-<br />
Q1<br />
Q2<br />
Q1<br />
Q2<br />
East Europe Area<br />
(million Euro) 30 June <strong>2009</strong> 30 June 2008 Change<br />
Revenue 160,7 233,8 (73,1)<br />
Operating Margin -0,7 14,9 (15,6)<br />
Operating Margin % -0,4% 6,4% (6,8%)<br />
The decline in operating profit and revenue experienced in Eastern Europe during the first<br />
half of <strong>2009</strong> was second only to that seen in Russia.<br />
The only significant exception was found in Turkey, where there was a notable rise in sales<br />
(+6.6%) and operating profit (3.4 million euro); this positive performance reflects an<br />
improvement in the market situation due to the introduction of government incentives and an<br />
increase in the Group's market penetration.<br />
Results in Poland were penalised by the marked depreciation of the zloty with respect to the<br />
first half of the prior year (28.8% fall in the average exchange rate) and the overall weakness<br />
of demand (down in the second quarter following a positive first quarter), although the limited<br />
price increases made during the second quarter did have some positive effect.<br />
Although positive operating profit is expected for the full year, this Area - as elsewhere - will<br />
only return to acceptable levels of profitability when market demand picks up again.<br />
150,0<br />
140,0<br />
130,0<br />
120,0<br />
110,0<br />
100,0<br />
90,0<br />
80,0<br />
70,0<br />
60,0<br />
50,0<br />
111,4<br />
65,4<br />
Q1<br />
East Europa Area<br />
Revenue (million Euro)<br />
Q2<br />
122,4<br />
95,3<br />
2008<br />
<strong>2009</strong><br />
35,0<br />
30,0<br />
25,0<br />
20,0<br />
15,0<br />
10,0<br />
5,0<br />
-<br />
-5,0<br />
-10,0<br />
5,8<br />
Q1<br />
East Europe Area<br />
Operating Margin (million Euro)<br />
-5,9<br />
9,1<br />
Q2<br />
5,2<br />
2008<br />
<strong>2009</strong><br />
Overseas Area<br />
(million Euro) 30 June <strong>2009</strong> 30 June 2008 Change<br />
Revenue 59,2 88,6 (29,4)<br />
Operating Margin 4,9 7,8 (2,9)<br />
Operating Margin % 8,2% 8,8% (0,6%)<br />
The Overseas Area includes those markets that are usually served by independent<br />
11
<strong>Half</strong>-year report at 30 June <strong>2009</strong><br />
distributors. As an exception, the Group has a direct presence in Argentina via a commercial<br />
branch. The principal contractions in revenue and operating profit were suffered in the United<br />
States, the Middle East and Asia.<br />
60,0<br />
55,0<br />
50,0<br />
45,0<br />
40,0<br />
35,0<br />
30,0<br />
25,0<br />
20,0<br />
15,0<br />
10,0<br />
40,7<br />
26,1<br />
Q1<br />
Overseas Area<br />
Revenue (million Euro)<br />
Q2<br />
47,9<br />
33,1<br />
2008<br />
<strong>2009</strong><br />
35,0<br />
30,0<br />
25,0<br />
20,0<br />
15,0<br />
10,0<br />
5,0<br />
-<br />
3,9 3,9<br />
1,6<br />
Q1<br />
Overseas Area<br />
Operating Margin (million Euro)<br />
Q2<br />
3,2<br />
2008<br />
<strong>2009</strong><br />
Revenue by product line and brand<br />
In the first half of <strong>2009</strong> sales of free-standing and built-in appliances declined in an almost<br />
identical fashion, by 22.4% and 22.6% respectively, although the dynamics were different<br />
when analysed by channel, product and geographical area.<br />
(million Euro) 30 June <strong>2009</strong> 30 June 2008 Change %<br />
Free Standing 832,0 1.072,7 -22,4%<br />
Built In 270,1 349,2 -22,6%<br />
Total 1.102,1 1.421,9 -22,5%<br />
The decline in sales affected the <strong>Indesit</strong> brand more than Hotpoint-Ariston, since <strong>Indesit</strong> has<br />
a greater presence in the geographical areas more seriously hit by the crisis, such as<br />
Eastern Europe and Russia.<br />
(million Euro) 30 June <strong>2009</strong> 30 June 2008 Change %<br />
<strong>Indesit</strong> 515,5 675,2 -23,6%<br />
Hotpoint-Ariston 550,3 695,2 -20,8%<br />
Altri marchi 36,3 51,6 -29,6%<br />
Total 1.102,1 1.421,9 -22,5%<br />
The larger reduction in the revenue from Other brands confirms pursuit of the Group's<br />
strategy of focusing sales on the two principal brands.<br />
(million Euro) 30 June <strong>2009</strong> 30 June 2008 Change %<br />
Cooking 266,0 359,2 -26,0%<br />
Cooling 346,1 442,2 -21,7%<br />
Washing 490,0 620,4 -21,0%<br />
Total 1.102,1 1.421,9 -22,5%<br />
Cooking and cooling were the product families that saw the greatest declines. The reduction<br />
in the sales of washing appliances was lower due to the performance achieved in Western<br />
Europe.<br />
12
<strong>Half</strong>-year report at 30 June <strong>2009</strong><br />
Cash flows 4<br />
(million Euro) 30 June 09 31 Dec 08 30 June 08<br />
EBITDA 83,0 270,5 136,8<br />
Change in NWC (98,7) (62,7) (247,9)<br />
Other Operating Flow (15,9) (162,0) (53,2)<br />
Operating cash flow (31,5) 45,8 (164,3)<br />
Net CapEx (18,5) (136,1) (44,4)<br />
Cash Flow before financial activies (50,0) (90,3) (208,7)<br />
Financial operations & others (0,2) (52,4) (52,7)<br />
Free cash flow (50,2) (142,7) (261,3)<br />
The cash flow absorbed by operating activities during the first half of <strong>2009</strong> was 31.5 million<br />
euro (absorbed 164.3 million euro).<br />
The absorption of cash flow was much lower than in the first half of 2008, despite the<br />
reduction in gross operating profit (EBITDA). This improvement in cash flows was mainly due<br />
to the management of net working capital. In particular, aside from the lower volume of<br />
sales, the reduction in trade receivables was also due to the sale without recourse of trade<br />
receivables totalling 54.3 million euro.<br />
Capital expenditure net of the proceeds from asset disposals diminished significantly,<br />
consistency with the policy announced by the Group, and amounted to 18.5 million euro<br />
(44.4 million euro).<br />
Lastly, no dividends were paid during the first half of <strong>2009</strong>.<br />
The free cash flow 5 generated during the first half of <strong>2009</strong> was therefore negative by 50.2<br />
million euro (261.3 million euro), resulting in an increase in net borrowings of the same<br />
amount since 31 December 2008.<br />
4<br />
In the above Cash flow view, the change in net working capital includes the change in Trade payables<br />
incurred for investment purposes, classified as part of the Cash flows from investing activities in the<br />
Consolidated statement of cash flows, where the amounts of cash flow from operating activities and<br />
Cash flow from investing activities are different.<br />
5 Free Cash Flow: the cash flow from/for operating and investing activities, net of dividend payments<br />
and capital increases.<br />
13
<strong>Half</strong>-year report at 30 June <strong>2009</strong><br />
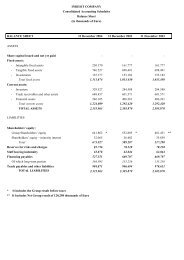
Balance sheet 6<br />
(million Euro) 30 June 09 31 Dec 08 30 June 08<br />
Trade receivables 416,2 459,0 649,0<br />
Inventories 338,0 374,1 457,6<br />
Trade payables (590,5) (767,9) (856,3)<br />
Net working capital 163,8 65,1 250,3<br />
Non-current assets 1.088,2 1.113,5 1.196,0<br />
Other current assets and liabilities and non-current liabilities (327,1) (282,2) (321,0)<br />
Net invested capital 924,9 896,4 1.125,4<br />
Net financial indebtedness 524,1 473,8 592,5<br />
Equity attributable to the Group 398,3 420,0 530,7<br />
Minority interests 2,5 2,5 2,2<br />
Equity and financial liabilities 924,9 896,4 1.125,4<br />
The reduction in Net working capital as a percentage of sales (from 7.4% of rolling sales in<br />
June 2008 to 5.8% in June <strong>2009</strong>) was made possible by the sale without recourse of trade<br />
receivables. Without these sales, the incidence on sales would have been 7.9%. The fall in<br />
the volume of production was greater than the decline in the volume of sales, resulting in a<br />
reduction in trade payables that was larger than the decrease in trade receivables, despite<br />
the slowdown in collections due to the challenging general economic situation. Lastly,<br />
consistent with the Group’s policy, inventory levels were reduced.<br />
The decrease in shareholders' equity since 31 December 2008 was mainly due to the net<br />
loss for the half year period of 22.5 million euro. The translation reserve increased by 10.8<br />
million euro overall, due the appreciation of Uk pound against the euro since 31 December<br />
2008, which more than offset the effect on the reserve of the appreciation of the euro against<br />
the zloty and the rouble. The cash flow hedge reserve, on the other hand, decreased by 9.9<br />
million euro.<br />
6 The trade receivables and payables, inventories and equity reported in the above reclassified balance<br />
sheet are the same as the amounts reported in the consolidated balance sheet; net financial<br />
indebtedness is analysed in the notes to the condensed, half-year consolidated financial statements;<br />
“Non-current assets” and “Other current assets and liabilities and non-current liabilities” comprise the<br />
captions of the consolidated balance sheet that are not mentioned above or included as part of net<br />
financial indebtedness.<br />
14
<strong>Half</strong>-year report at 30 June <strong>2009</strong><br />
Financial position<br />
(million Euro) 30 June <strong>2009</strong> 31 Dec 08 30 June 2008<br />
Current financial assets 27,6 43,8 53,5<br />
Cash and cash equivalents 136,1 193,2 152,3<br />
Banks and other financial payables (297,3) (268,2) (513,8)<br />
Net financial position - short term (133,6) (31,2) (307,9)<br />
Medium/long-term financial payables (392,6) (451,9) (297,8)<br />
Net financial position (*) (526,2) (483,1) (605,7)<br />
Other non-current financial assets 2,1 9,3 13,3<br />
Net financial indebtedness (524,1) (473,8) (592,5)<br />
*) As defined in CONSOB Communication DEM /6064293 dated 28/07/2006, applying the CESR recommendations<br />
dated 10/02/2005<br />
The net financial indebtedness amounts to 524.1 million euro (592.5 million euro).<br />
The Gross financial indebtedness totals 689.9 million euro (811.6 million euro), of which 57%<br />
is classified as medium and long term and 43% as short term.<br />
The maturity profile of medium and long-term loans is presented below:<br />
Medium/longterm<br />
MATURITY<br />
2010 2011 2012 2013 2014 2015 2016<br />
Bonds 201,2 4,7 57,1 6,8 6,5 111,4 0,8 13,8<br />
Due to banks and Other payables 191,4 5,6 17,4 147,4 1,3 16,8 0,0 2,8<br />
Total 392,6 10,4 74,5 154,2 7,9 128,2 0,8 16,6<br />
At 30 June <strong>2009</strong>, the Group has unused, committed lines of credit totalling 250.0 million<br />
euro.<br />
Reorganisation of activities<br />
In February <strong>2009</strong>, <strong>Indesit</strong> Company informed the parties concerned of its intention to close<br />
the factory at Kinmel Park in the UK. Consultation with the trade unions was completed in<br />
June, with the final decision agreed with the social partners being to close the factory at the<br />
end of July.<br />
In June <strong>2009</strong>, <strong>Indesit</strong> Company reached an agreement with the social partners and the<br />
institutions on the reorganisation of activities at the None factory in Italy. This agreement,<br />
involving a reduction in production levels, was signed at the Ministry for Economic<br />
Development in July.<br />
Significant events during the first half of <strong>2009</strong> and subsequent to period end<br />
Other than the events mentioned above, there were no additional significant events or<br />
transactions during the first half of <strong>2009</strong> or subsequent to period end.<br />
15
<strong>Half</strong>-year report at 30 June <strong>2009</strong><br />
Reconciliation with the shareholders' equity and net profit for the period of the<br />
parent company<br />
In accordance with Consob Communication no. DEM/6064293 dated 28 July 2006, the<br />
shareholders' equity and net results for the period of the parent company are reconciled<br />
below with the related consolidated amounts.<br />
(million Euro)<br />
30 June 09 31 Dec 08<br />
Profit (Loss) Equity Profit (Loss) Equity<br />
Financial statements of the parent company (18,9) 410,2 62,6 428,7<br />
Consolidation adjustments<br />
Difference between carrying amount and equity of group<br />
companies<br />
(4,7) (7,7) 123,0 (4,4)<br />
Dividends received from subsidiaries - - (132,7) -<br />
Effect of aligning separate financial statements with group<br />
accounting policies<br />
0,8 3,0 2,7 2,4<br />
Elimination of intercompany profits 0,3 (13,3) (1,2) (13,3)<br />
Tax effect of adjustments (0,1) 6,1 1,0 6,2<br />
Other minor effects 0,0 0,1 0,1 0,4<br />
Total consolidation adjustments (3,7) (11,9) (7,1) (8,7)<br />
Consolidated financial statements (22,6) 398,3 55,5 420,0<br />
Intercompany and related-party transactions, and significant, atypical or unusual<br />
transactions<br />
Transactions between Group companies are settled on arms'-length terms, having regard for<br />
the quality of the goods and services provided. The notes to the condensed, half year<br />
consolidated financial statements describe the nature of the principal transactions arranged<br />
by the parent and other Group companies with related parties. They also contain the detailed<br />
information required by Consob regulations and IAS 24. In accordance with Consob<br />
regulations, 7 Attachments 3 and 4 to the condensed, half year consolidated financial<br />
statements present the consolidated income statement and balance sheet showing nonrecurring<br />
items and transactions with related parties separately, together with the percentage<br />
incidence with respect to each caption.<br />
Transactions with related parties are not significant to the economic and financial position of<br />
the Group.<br />
Stock option plans<br />
The stock option plans are described in the notes to the condensed, half-year consolidated<br />
financial statements at 30 June <strong>2009</strong>, which describe the plans and provide the information<br />
required by law and the relevant Consob communications.<br />
Corporate governance<br />
The system of corporate governance adopted by <strong>Indesit</strong> Company is essentially consistent<br />
with the principles established in the Code of Conduct for Listed Companies and with<br />
international best practice. On 26 March <strong>2009</strong>, the Board of Directors approved the Annual<br />
7 Resolution no. 15519 dated 27 July 2006 and Consob Communication no. DEM/6064293 dated 28 July<br />
2006<br />
16
<strong>Half</strong>-year report at 30 June <strong>2009</strong><br />
<strong>Report</strong> on Corporate Governance, which provides a complete description of the governance<br />
model adopted by the Company and reports on the implementation of the Code.<br />
The Parent Company has adopted the ordinary model of administration and control<br />
(envisaged under Italian law), including a Board of Directors, a Board of Statutory Auditors<br />
and Independent Auditors. The company bodies are appointed at the Shareholders' Meeting<br />
and remain in office for a period of three years. The significant presence of Independent<br />
Directors, as defined in the Code, and the important role they play on both the Board and<br />
Board Committees (Human Resources Committee, Audit Committee and Innovation and<br />
Technology Committee), ensures that the interests of all shareholders are appropriately<br />
balanced and guarantees a high level of discussion at Board meetings.<br />
Further information is available in the Annual <strong>Report</strong> on Corporate Governance (available on<br />
the Company's website: www.indesitcompany.com).<br />
Forecast for operations<br />
The forecast falls in GDP 8 during <strong>2009</strong> in the principal geographical areas in which the Group<br />
operates, being the UK (-4.2%), the Euro area (-4.8%) and Russia (-6.5%), has been revised<br />
downwards with respect to the previous quarter. It is likely that demand for durable goods,<br />
including household appliances, during the second half of the year will remain affected by the<br />
currently difficult economic conditions.<br />
Demand for household appliances and trends in the three main currencies that influence the<br />
Group's results (British pound, Russian rouble and Polish zloty) will, remain decisive factors<br />
for the achievement of the Group's economic and financial objectives also in the second half<br />
year.<br />
In this context, the greatest concerns continue to be the situation in Russia and the East<br />
European markets.<br />
Demand in Russia contracted even further during the second quarter, almost halving in<br />
certain months with respect to the comparative period of the prior year. Growing<br />
unemployment and the continuing credit squeeze do not allow the coming months to be<br />
viewed with optimism; expectations for the second half year suggest that a slight<br />
improvement might emerge, but only towards the end of the fourth quarter. The pressure on<br />
the rouble, which struggles to maintain a rate of 44/45 to the euro, represents an additional<br />
risk, since it would be hard to pass on further depreciation in the form of higher selling prices.<br />
As mentioned in the last quarter, despite the expected, significant further reduction in sales<br />
and profitability, Russia will still remain one of the most important areas for the Group.<br />
Sales and profitability also fell in Eastern Europe, and this is likely to continue. Demand in<br />
the region remains poor (down about 24 % in the first half) and the weakness of the local<br />
currencies (PLN, HUF, CZK) continues with respect to the euro. The Group's priority in this<br />
area is to recoup profitability in order to offset the effects of currency depreciation and the<br />
possible loss of market share.<br />
Performance during the second quarter and current forecasts suggest that the following<br />
areas can be viewed with confidence:<br />
a) UK. The price adjustments made to cover the depreciation of the GBP, together with the<br />
cost containment measures taken, should mean – in the absence of a further significant<br />
decline in Uk pounds – that the UK will close the year with lower sales but higher<br />
profitability, despite an expected contraction of the market by at least 10% over the whole<br />
of <strong>2009</strong>.<br />
8 International Monetary Fund forecasts from World Economic Outlook July <strong>2009</strong><br />
17
<strong>Half</strong>-year report at 30 June <strong>2009</strong><br />
b) Italy and other West European countries. Italy too, despite a likely contraction in the<br />
market, is expected to close the year with profitability in line with or better than in the<br />
prior year. Similar results are expected from the other markets in Western Europe.<br />
c) Cost of purchasing raw materials and components. The stabilisation of the oil price at<br />
around 60-70 USD and the steel price at current levels will enable the Group to achieve<br />
considerable savings on procurement costs.<br />
d) Service and warranty costs. Consistently with the performance in recent years, service<br />
costs are expected to fall further in <strong>2009</strong> due to the significant improvements made to the<br />
product/ process quality and the efficiency of the Service area.<br />
The results for <strong>2009</strong> will be burdened by substantial restructuring costs (recorded during the<br />
first half) associated, in large measure, with the closure of the Kinmel Park factory (UK) and<br />
the reorganisation of production at the None factory (Italy).<br />
The outlook on the second half of the year remains hazy, especially in relation to Russia and<br />
Eastern Europe, making it difficult to develop forecasts with a low margin of error. At this<br />
time, the best expectations for market performance are based more on favourable<br />
comparisons with the prior period than on an actual upturn in consumption.<br />
Nevertheless in this difficult context, the Group believes that given:<br />
1) Stable exchange rates<br />
2) Lower market demand during the second half year in line with the second quarter trend -<br />
10% and -15%.<br />
<strong>2009</strong> sales should be between 2.5 and 2.6 billion euro, and operating profit (EBIT) should be<br />
between 60 and 70 million euro; net financial position at 31 December <strong>2009</strong> is expected to<br />
be essentially in line with the situation at 31 December 2008.<br />
Milan, 30 July <strong>2009</strong><br />
On behalf of the Board of Directors<br />
The Vice Chairman<br />
Andrea Merloni<br />
18
19<br />
Condensed interim<br />
consolidated financial<br />
statements<br />
at 30 June <strong>2009</strong>
<strong>Half</strong>-year report at 30 June <strong>2009</strong><br />
Consolidated income statement for the first half of <strong>2009</strong> 1<br />
(million Euro)<br />
Note<br />
30 June <strong>2009</strong> 30 June 2008<br />
Revenue 8.1 1.203,7 1.525,3<br />
Cost of sales 8.2 (937,6) (1.142,6)<br />
Selling and distribution expenses 8.3 (198,2) (251,9)<br />
General and administrative expenses 8.4 (52,5) (58,4)<br />
Operating profit 8.5 15,4 72,4<br />
Interest paid 8.6 (18,9) (16,9)<br />
Interest received 8.6 0,9 6,6<br />
Exchage rates and Net financial expenses 8.6 (18,2) (3,6)<br />
Share of profit (losses) of associates - -<br />
Profit before tax (20,8) 58,5<br />
Income tax expenses 8.7 (1,8) (24,4)<br />
Profit for the period (22,6) 34,1<br />
of which:<br />
Attributable to minority interests (0,1) 0,4<br />
Attributable to the group (22,5) 33,7<br />
Basic earnings per share 8.14 (0,22) 0,33<br />
Diluted earnings per share 8.14 (0,22) 0,33<br />
1 Pursuant to Consob Resolution no. 15519 dated 27 July 2006, the effects of related-party and non-recurring<br />
transactions on the consolidated income statement are reported in Attachment 3 and in notes 10 and 8.5<br />
respectively.<br />
20
<strong>Half</strong>-year report at 30 June <strong>2009</strong><br />
Consolidated statement of comprehensive income for the first half of <strong>2009</strong><br />
(million Euro)<br />
Note<br />
30 June <strong>2009</strong> 30 June 2008<br />
Profit (loss) for the period (A) (22,6) 34,1<br />
Gains/(Losses) on cash flow hedges 8.14 (9,9) 1,0<br />
Gains/(Losses) on exchange rate differences on translating 8.14 10,8 (29,4)<br />
foreign operations<br />
Total Other comprehensive income, net of tax (B) 0,8 (28,4)<br />
Total Comprehensive income (A+B) (21,7) 5,7<br />
of which:<br />
Attributable to minority interests (0,1) 0,4<br />
Attributable to the group (21,6) 5,3<br />
21
<strong>Half</strong>-year report at 30 June <strong>2009</strong><br />
Consolidated balance sheet at 30 June <strong>2009</strong> 2<br />
(million Euro)<br />
Note 30 June <strong>2009</strong> 31 December 2008 30 June 2008<br />
Assets<br />
Property, plant and equipment 8.8 635,5 692,8 747,5<br />
Goodwill and other intangible assets with an indefinite useful<br />
life<br />
8.9 232,0 207,7 275,4<br />
Other intangible assets with a finite useful life 8.10 119,7 123,9 102,3<br />
Investments in associates 0,6 0,5 0,5<br />
Other non-current assets 31,7 33,9 33,5<br />
Deferred tax assets 68,8 54,6 36,9<br />
Other non-current financial assets 8.15.5 2,1 9,3 13,3<br />
Total non-current assets 1.090,3 1.122,8 1.209,3<br />
Inventories 8.11 338,0 374,1 457,6<br />
Trade receivables 8.12 416,2 459,0 649,0<br />
Current financial assets 8.15.1 27,6 43,8 53,5<br />
Tax receivables 44,2 44,1 61,4<br />
Other receivables and current assets 8.13 42,7 63,6 67,9<br />
Cash and cash equivalents 8.15.2 136,1 193,2 152,3<br />
Total current assets 1.004,9 1.177,7 1.441,7<br />
Total assets 2.095,2 2.300,5 2.651,0<br />
Equity<br />
Share capital 92,8 92,8 92,8<br />
Reserves 176,8 176,0 308,4<br />
Retained earnings 151,3 95,8 95,8<br />
Profit attributable to the group (22,6) 55,5 33,7<br />
Equity attributable to the group 8.14 398,3 420,0 530,7<br />
Minority interests 2,5 2,5 2,2<br />
Total equity 400,8 422,6 532,9<br />
Liabilities<br />
Medium and long-term interest-bearing loans and borrowings 8.15.4 392,6 451,9 297,8<br />
Employee benefits 8.16 67,6 66,3 76,9<br />
Provisions for risks and charges 8.17 48,4 43,3 41,3<br />
Deferred tax liabilities 41,5 46,0 53,1<br />
Other non-current liabilities 8.18 38,6 42,3 52,6<br />
Total non-current liabilities 588,6 649,8 521,7<br />
Banks and other financial payables 8.15.3 297,3 268,2 513,8<br />
Provisions for risks and charges 8.17 64,6 51,9 54,2<br />
Trade payables 590,5 767,9 856,3<br />
Tax payables 33,5 34,6 36,2<br />
Other payables 8.19 119,9 105,5 136,0<br />
Total current liabilities 1.105,8 1.228,1 1.596,4<br />
Total liabilities 1.694,4 1.878,0 2.118,1<br />
Total equity and liabilities 2.095,2 2.300,5 2.651,0<br />
2 Pursuant to Consob Resolution no. 15519 dated 27 July 2006, the effects of related-party transactions on the<br />
consolidated balance sheet are reported in Attachment 4 and in note 10. The effects of non-recurring transactions<br />
on the balance sheet and financial position are described in note 8.5.<br />
22
<strong>Half</strong>-year report at 30 June <strong>2009</strong><br />
Consolidated statement of cash flows for the six-month period ended 30<br />
June <strong>2009</strong> 3<br />
(million Euro)<br />
Note<br />
30 June <strong>2009</strong> 31 December 2008 30 June 2008<br />
Total profit 8.21 (22,6) 56,0 34,1<br />
Income taxes 8.21 1,8 38,9 24,4<br />
Depreciation and amortisation 8.21 67,7 129,9 64,4<br />
Other non-monetary income and expenses, net 8.22 23,0 30,7 10,2<br />
Change in trade receivables 8.23 42,7 63,7 (126,3)<br />
Change in inventories 8.23 36,1 (39,9) (123,4)<br />
Change in trade payables 8.23 (151,5) (86,0) 27,2<br />
Change in other assets and liabilities 8.24 25,5 (65,8) (15,5)<br />
Income taxes 8.21 (15,3) (50,9) (20,1)<br />
Interest paid 8.22 (17,2) (42,1) (17,3)<br />
Interest received 8.22 4,2 11,7 3,6<br />
Cash flows from operating activities<br />
(5,6) 46,4 (138,8)<br />
Acquisition of property, plant and equipment 8.25 (40,3) (114,4) (63,4)<br />
Proceeds from sale of property, plant and equipment 8.25 6,0 7,6 3,0<br />
Acquisition of intangible assets 8.26 (10,3) (30,6) (9,5)<br />
Proceeds from sale of non-current intangible assets 8.26 0,1 - 0,1<br />
Proceeds from sale of non-current financial assets 8.27 - 0,7 -<br />
Acquisition of non-current financial assets and other investments 8.27 (0,2) - (0,2)<br />
Cash flows from (used in) investing activities<br />
(44,7) (136,6) (70,0)<br />
Dividends paid - (52,5) (52,5)<br />
New medium/long-term payables - 200,2 -<br />
Repayment of borrowing for acquisition of GDAH - (40,9) -<br />
Other repayments of medium/long-term financial payables 8.28 (7,9) (30,0) (0,2)<br />
Change in current financial payables 8.29 1,2 20,0 227,3<br />
Cash flows from (used in) financing activities<br />
Net cash flows<br />
(6,7) 96,8 174,6<br />
(57,0) 6,6 (34,2)<br />
-<br />
Cash and cash equivalents, start of period 193,2 186,5 186,5<br />
Cash and cash equivalents, end of period 136,1 193,2 152,3<br />
Total change in cash and cash equivalents (57,0) 6,6 (34,2)<br />
3 Pursuant to Consob Resolution no. 15519 dated 27 July 2006, the financial effects of non-recurring transactions<br />
are reported in note 8.5.<br />
23
Opening balances<br />
Other profit (losses) net of<br />
taxation<br />
Profit for the period<br />
Income (expense)<br />
recognised directly in<br />
equity<br />
Dividends paid<br />
Exercise of stock options<br />
Allocation of profit of the<br />
year<br />
Changes in scope of<br />
consolidation and<br />
acquisition of minority<br />
interests<br />
Total effects of<br />
transactions with shareholders<br />
Closing balances<br />
Nota 8.14<br />
Statement of changes in consolidated equity at 30 June <strong>2009</strong> (million euro)<br />
Share capital 92,8 - - - - - - - 92,8<br />
Share premium reserve 35,8 - - - - - - - 35,8<br />
Legal reserve 22,7 - - - - - - - 22,7<br />
Translation reserve (139,8) 10,8 10,8 - - - - - (129,0)<br />
Other reserves 257,2 (9,9) (9,9) - - - - - 247,3<br />
Retained earnings 95,8 - - - - 55,5 - 55,5 151,3<br />
Profit attributable to the group 55,5 - (22,6) (22,6) (55,5) (55,5) (22,6)<br />
Equity attributable to the group 420,0 0,8 (22,6) (21,7) - - - - - 398,3<br />
Minority interests 2,5 - (0,1) (0,1) - 2,5<br />
Total equity 422,6 0,8 (22,5) (21,7) - - - - - 400,8<br />
Statement of changes in consolidated equity at 30 June 2008 (million euro)<br />
Share capital 92,8 - - - - - - - - 92,8<br />
Share premium reserve 35,8 - - - - - - - - 35,8<br />
Legal reserve 22,7 - - - - - - - - 22,7<br />
Translation reserve 19,8 (29,4) - (29,4) - - - - - (9,6)<br />
Other reserves 258,5 1,0 - 1,0 - - - - - 259,5<br />
Retained earnings 42,9 - - - (52,5) - 105,4 - 52,9 95,8<br />
Profit attributable to the group 105,4 - 33,7 33,7 - - (105,4) - (105,4) 33,7<br />
Equity attributable to the group 577,9 (28,4) 33,7 5,3 (52,5) - 0,0 - (52,5) 530,7<br />
Minority interests 1,8 0,4 0,4 - 2,2<br />
Total equity 579,6 (28,4) 34,1 5,7 (52,5) - 0,0 - (52,5) 532,9<br />
24
25<br />
Explanatory notes
<strong>Half</strong>-year report at 30 June <strong>2009</strong><br />
1. Group structure and activities<br />
<strong>Indesit</strong> Company is a Group led by <strong>Indesit</strong> Company S.p.A., an Italian company based in<br />
Fabriano (near Ancona) that is listed on the Milan Stock Exchange.<br />
The Group is active in the production and sale of white goods, namely household appliances<br />
for the cooking sector (cookers, ovens and hobs), the refrigeration sector (refrigerators and<br />
freezers), and the washing sector (washing machines, dryers, combined washer-dryers and<br />
dishwashers).<br />
The Group operates mainly in Europe, Turkey and Russia.<br />
The Group's operating segments, as defined in IFRS 8 – Operating Segments, comprise the<br />
geographical areas which, in organisational terms, generate revenue and costs that are<br />
periodically reviewed by the most senior decision makers in order to evaluate performance<br />
and decide on the allocation of resources, and for which separate financial information is<br />
available.<br />
The household appliances sector is highly seasonal, which affects all the main economic and<br />
financial parameters.<br />
The reporting by business segment required by IFRS 8 is provided in note 7.<br />
2. Approval of the consolidated half-year report at 30 June <strong>2009</strong><br />
The consolidated half-year report at 30 June <strong>2009</strong> was approved by the Board of Directors<br />
on 30 July <strong>2009</strong> and the condensed interim consolidated financial statements included<br />
therein have been reviewed by the independent auditors.<br />
There have not been any significant events subsequent to the end of the first half of <strong>2009</strong>.<br />
3. Declaration of compliance with IFRS international accounting standards and<br />
basis of presentation<br />
These condensed interim consolidated financial statements have been prepared in<br />
compliance with IAS 34 and the requirements of art. 154-ter of Legislative Decree no. 58<br />
dated 24 February 1998 (Consolidated Finance Law) and subsequent amendments. They do<br />
not include all the information required for annual financial statements and should be read<br />
together with the consolidated financial statements at 31 December 2008. In particular, the<br />
income statement, balance sheet and statement of cash flows are presented in extended<br />
form using the formats adopted for the consolidated financial statements at 31 December<br />
2008, except as discussed below regarding adoption of the statement of comprehensive<br />
income and the consequent modifications made to the statement of changes in equity. On<br />
the other hand, the following notes are presented in summary form and, accordingly, do not<br />
include all the information required for annual financial statements. In particular, as<br />
envisaged by IAS 34 in order to avoid repeating the information already published, the<br />
explanatory notes relate solely to those elements of the income statement, balance sheet<br />
and statement of cash flows whose content or change, in terms of nature or amount or<br />
because unusual, must be known in order to understand the economic and financial position<br />
of the Group.<br />
The condensed interim consolidated financial statements at 30 June <strong>2009</strong> comprise the<br />
balance sheet, the income statement, the statement of comprehensive income, the<br />
statement of cash flows, the statement of changes in equity and these notes. The<br />
comparative figures presented together with the balance sheet and the statement of cash<br />
flows include those at 30 June 2008 for the balance sheet and at 31 December 2008 for the<br />
statement of cash flows, as well as those required by IAS 34 (31 December 2008 for the<br />
26
<strong>Half</strong>-year report at 30 June <strong>2009</strong><br />
balance sheet and 30 June 2008 for the statement of cash flows). This decision was made to<br />
permit the consistent comparison of data that is significantly affected by the seasonality of<br />
the sector. The income statement presents figures for the first half of <strong>2009</strong> and the first half<br />
of 2008, since the Group has adopted the six-month period for interim reference purposes.<br />
The consolidated income statement is classified with reference to the reasons for which<br />
costs were incurred, the balance sheet distinguishes between current and non-current assets<br />
and liabilities, the statement of cash flows is presented using the indirect method, and the<br />
Statement of Changes in Equity format has been adopted. In addition, as required by the<br />
revised version of IAS 1 – Presentation of financial statements, the Consolidated statement<br />
of comprehensive income is presented for the first time. This statement comprises the<br />
various components forming the results for the period, together with the income and charges<br />
deriving from transactions not carried out with shareholders that were recognised directly in<br />
equity. The transactions carried out with shareholders are presented in the statement of<br />
changes in shareholders' equity, together with the equity transactions reported in the<br />
statement of comprehensive income.<br />
The format adopted for the classification of the consolidated income statement was chosen<br />
to help the market understand more clearly the profitability of the Group; in particular,<br />
performance can be measured better with reference to the profit and cost centeres used for<br />
the allocation of income and expenses. Additionally, this format assures the provision of<br />
precise segment information that is consistent with the way results are normally measured<br />
for management accounting purposes. This approach also ensures greater comparability<br />
with direct competitors and the multinationals operating in related sectors, since classification<br />
of the income statement by function is the format most widely used in international practice.<br />
In addition, the notes provide information on the nature of expenditure and the other<br />
disclosures necessary for the market, investors and all stakeholders.<br />
4. Principal accounting policies<br />
Except as discussed in note 5 below, the accounting policies and consolidation criteria<br />
applied for the preparation of the condensed interim consolidated financial statements are<br />
consistent with those adopted for the consolidated financial statements at 31 December<br />
2008, to which explicit reference is made for further details, and which form an integral part<br />
of these notes.<br />
Basis of preparation<br />
The currency of presentation of the condensed interim consolidated financial statements is<br />
the euro, and the financial statement balances are expressed in millions of euro (except<br />
where stated otherwise). The condensed interim consolidated financial statements are<br />
prepared on an historical cost basis, except for derivative financial instruments, financial<br />
assets held for sale and financial instruments classified as available for sale, which are<br />
measured at their fair value, as applicable to going concerns. Despite the difficult economic<br />
and financial conditions, the Group has determined that there are no significant uncertainties<br />
about business continuity. This confidence takes account of the actions already identified<br />
and, in part, already implemented to adjust to the marked reduction in the level of demand<br />
and preserve the Group's financial strength and solidity. The accounting policies are applied<br />
on a consistent basis by all Group companies. There are no financial assets held to maturity.<br />
Financial transactions are recognised with reference to the trade date. The accounting<br />
policies adopted for the preparation of the condensed interim consolidated financial<br />
statements at 30 June <strong>2009</strong> have also been applied on a consistent basis to all the<br />
comparative financial information.<br />
27
<strong>Half</strong>-year report at 30 June <strong>2009</strong><br />
Accounting estimates<br />
The preparation of condensed interim consolidated financial statements involves making<br />
assumptions and estimates that affect the value of assets and liabilities and the related<br />
explanatory information, as well as the value of contingent assets and liabilities at the<br />
reference date. These estimates are used to measure the property, plant and equipment and<br />
intangible assets subject to impairment, as well as to recognise provisions for doubtful<br />
accounts, inventory obsolescence, depreciation and amortisation and the write-down of<br />
assets, employee benefits, taxation, and risks and charges. The estimates and underlying<br />
assumptions are based on historical experience and various other factors that are believed<br />
to be reasonable under the circumstances. In this context, the difficult general economic<br />
situation caused by the deterioration of the international financial crisis has heightened the<br />
uncertainties inherent in the assumptions about future performance used to make certain<br />
estimates. The financial statement captions most affected by these uncertainties are the<br />
provisions for doubtful accounts, the provisions for obsolescence and the recoverable<br />
amount of non-current assets. With regard to these captions, the prolonging and possible<br />
deterioration of the current economic and financial crisis could worsen the financial condition<br />
of debtors, or increase the risk of product obsolescence linked to high inventory levels, or<br />
reduce the forecast cash flows used for the impairment testing of non-current assets, with<br />
respect to the deterioration already contemplated when making the estimates included in<br />
these condensed interim consolidated financial statements. Estimates and assumptions are<br />
reviewed regularly and, if later estimates differ from those made initially, the effects - which<br />
obviously cannot be estimated or forecast at this time - are immediately reflected in the<br />
income statement. If the changes in estimates relate to both the current and future periods,<br />
their effects are reflected in the income statements for the periods concerned.<br />
5. Changes in accounting policies, changes in accounting estimates and<br />
reclassifications<br />
5.1 New accounting standards, amendments and interpretations adopted<br />
The revised version of IAS 1 – Presentation of Financial Statements took effect from 1<br />
January <strong>2009</strong>. The new version of the standard requires all changes generated by<br />
transactions with shareholders to be reported in a statement of changes in equity. The effect<br />
of all transactions with third parties (comprehensive income) must be reported in a single<br />
statement of comprehensive income, or in two separate statements (income statement and<br />
statement of comprehensive income).<br />
The Group has taken the second approach to the presentation of comprehensive income,<br />
including in a separate statement entitled “Consolidated statement of comprehensive<br />
income” all the changes in equity accounts generated by transactions with parties who are<br />
not shareholders. The retrospective adoption of this standard from 1 January <strong>2009</strong> has had<br />
no effect on the measurement of the captions. As a consequence of the change, the Group<br />
has modified the presentation of the statement of changes in equity.<br />
IFRS 8 Operating segments took effect from 1 January <strong>2009</strong>, replacing IAS 14 Sector<br />
information. The new accounting standard requires companies to base their segment<br />
information disclosures on the information used by the highest level of decision makers to<br />
make operating decisions. Accordingly, the standard requires the identification of operating<br />
segments with reference to the internal reports that are reviewed regularly by those decision<br />
makers for the purpose of allocating resources to such segments and analysing their<br />
performance. The adoption of this standard has had no effect on the measurement of the<br />
captions. Further information is provided in note 7.<br />
28
<strong>Half</strong>-year report at 30 June <strong>2009</strong><br />
The revised version of IAS 23 – Borrowing costs has been applied from 1 January <strong>2009</strong>. The<br />
new version of this standard prevents the immediate expensing of financial expenses<br />
incurred in relation to assets that normally require time before they become available for use<br />
or for sale. The adoption of this standard has had no significant effect on the measurement<br />
of the captions.<br />
The amendment to IAS 19 – Employee benefits took effect from 1 January <strong>2009</strong>: this<br />
amendment clarifies the definition of cost/income relating to past service and establishes, in<br />
the event of a plan curtailment, that the effect to be recognised immediately in the income<br />
statement must comprise solely the reduction in benefit relating to future periods, while the<br />
effect deriving from any reductions associated with past service must be treated as a<br />
negative cost in relation to such past service. The amendment has also redefined the<br />
meaning of short-term and long-term benefits and modified the definition of return on plan<br />
assets, establishing that this caption must be stated net of any plan administration charges<br />
not already included in the amount of the obligation. The adoption of this standard has had<br />
no significant effect on the measurement of the captions.<br />
The following amendments and interpretations, applicable from 1 January <strong>2009</strong>, govern<br />
situations and cases not relevant to the Group at the date of these condensed interim<br />
consolidated financial statements:<br />
- Amendments to IAS 32 – Financial Instruments: Presentation and IAS 1 – Presentation<br />
of Financial Statements – Financial Instruments.<br />
- Improvement to IAS 29 – Financial <strong>Report</strong>ing in Hyperinflationary Economies.<br />
- Improvement to IAS 36 – Impairment of Assets.<br />
- Improvement to IAS 39 – Financial Instruments: Recognition and Measurement.<br />
- Improvement to IAS 40 – Investment Property.<br />
- IFRIC 13 – Customer Loyalty Programmes.<br />
- IFRIC 15 – Agreements for the Construction of Real Estate.<br />
- IFRIC 16 – Hedges of a Net Investment in a Foreign Operation.<br />
5.2 Reclassifications<br />
In order to improve the presentation of the financial statements, commencing from 1 January<br />
<strong>2009</strong> certain costs (mainly relating to the central technical departments) have been<br />
reclassified to Cost of sales from General and administrative expenses. The 2008<br />
comparative information has also been reclassified accordingly. These reclassifications did<br />
not affect the Group's operating profit (EBIT), net results or shareholders' equity.<br />
In addition, in order to improve the presentation of financial captions, interest expense,<br />
interest income, exchange rate differences and other net financial expenses are stated<br />
separately in the income statement from 1 January <strong>2009</strong>. Previously, these captions were<br />
grouped together as Net financial expenses. The 2008 comparative information has also<br />
been reclassified accordingly.<br />
5.3 New accounting standards not yet applicable<br />
In January 2008, the IASB issued an updated version of IFRS 3 – Business Combinations,<br />
and amended IAS 27 – Consolidated and Separate Financial Statements. The principal<br />
modifications made to IFRS 3 relate to elimination of the obligation to measure the individual<br />
assets and liabilities of a subsidiary at fair value in each subsequent acquisition, in the case<br />
of an acquisition in stages. Goodwill in this case will be determined as the difference<br />
between the value of the investment immediately prior to the acquisition, the consideration<br />
for the transaction and the value of the net assets acquired. In addition, if the company does<br />
not acquire 100% of the equity investment, the minority interest in shareholders' equity may<br />
be measured either at fair value or using the methodology already envisaged in the previous<br />
29
<strong>Half</strong>-year report at 30 June <strong>2009</strong><br />
version of IFRS 3. The revised version of the standard also requires that all costs associated<br />
with the business combination be charged to the income statement, as well as recognition at<br />
the acquisition date of the liability for contingent consideration.<br />
In the amendment to IAS 27, the IASB established that changes in equity investments<br />
interests not involving the loss of control must be recognised as equity transactions. In<br />
addition, it was also established that when a parent company relinquishes control over an<br />
investment but will retain an equity investment in that company, such equity investment must<br />
be remeasured at fair value in the balance sheet and any profits or losses deriving from the<br />
loss of control must be recognised in the income statement. Lastly, the amendment to IAS 27<br />
requires that all losses attributable to minority shareholders be allocated to equity pertaining<br />
to minority interest, even if they exceed their interest in the equity of the subsidiary<br />
concerned. The new rules must be applied on a prospective basis from 1 January 2010.<br />
As part of the 2008 Improvement process carried out by the IASB, the amendment made to<br />
IFRS 5 – Non-current Assets Held for Sale and Discontinued Operations states that if a<br />
company is committed to a sale involving loss of control of a subsidiary, all the assets and<br />
liabilities of that subsidiary must be reclassified as held for sale, even if the company will<br />
retain a non-controlling interest in its former subsidiary after the sale. This amendment must<br />
be adopted on a prospective basis from 1 January 2010.<br />
On 31 July 2008, the IASB issued an amendment to IAS 39 – Financial Instruments:<br />
Recognition and Measurement which must be applied on a retrospective basis from 1<br />
January 2010. The amendment clarifies how to apply the standard when defining the<br />
underlying that is hedged in particular situations. At the date of preparing these condensed<br />
interim consolidated financial statements, the competent EU bodies have not yet completed<br />
the endorsement process necessary for the adoption of this amendment.<br />
On 27 November 2008, the IFRIC issued IFRIC 17 – Distributions of Non-cash Assets to<br />
Owners in order to align the accounting treatment of such distributions. In particular, this<br />
interpretation clarifies that dividends payable must be recognised when such dividends have<br />
been appropriately authorised and that the payable must reflect the fair value of the net<br />
assets that will be used to make the payment. Lastly, the business must recognise in the<br />
income statement the difference between the dividend paid and the net carrying amount of<br />
the assets used to make the payment. This interpretation is applicable on a prospective<br />
basis from 1 January 2010. At the date of preparing these condensed interim consolidated<br />
financial statements, the competent EU bodies have not yet completed the endorsement<br />
process necessary for its adoption.<br />
On 29 January <strong>2009</strong>, the IFRIC issued IFRIC 18 – Transfers of Assets from Customers to<br />
clarify the accounting treatment applicable if the business signs a contract under which it<br />
receives a tangible asset from a customer that must be used to connect it to a network, or to<br />
provide it with specific access to the supply of goods and services (such as the supply of<br />
electricity, gas or water). In particular, in certain cases the business receives cash from the<br />
customer in order to construct or purchase the tangible asset that will be used in the<br />
performance of the contract. This interpretation is applicable on a prospective basis from 1<br />
January 2010. At the date of preparing these condensed interim consolidated financial<br />
statements, the competent EU bodies have not yet completed the endorsement process<br />
necessary for its adoption.<br />
On 5 March <strong>2009</strong>, the IASB issued an amendment to IFRS 7 – Financial Instruments:<br />
Disclosures to increase the information required in the case of measurement at fair value<br />
and to strengthen existing standards with regard to disclosure of the liquidity risks associated<br />
with financial instruments. This amendment is applicable from 1 January <strong>2009</strong>. At the date<br />
of preparing these condensed interim consolidated financial statements, the competent EU<br />
bodies have not yet completed the endorsement process necessary for its adoption.<br />
On 12 March <strong>2009</strong>, the IASB issued amendments to IFRIC 9 – Reassessment of Embedded<br />
Derivatives and IAS 39 - Financial Instruments: Recognition and Measurement that allow, in<br />
specific circumstances, the reclassification of certain financial instruments away from the<br />
“measured at fair value through profit or loss” category. These amendments clarify that,<br />
30
<strong>Half</strong>-year report at 30 June <strong>2009</strong><br />
when reclassifying a financial instrument away from the above category, all related<br />
embedded derivatives must be measured and, if necessary, recognised separately in the<br />
financial statements. These amendments are applicable on a retrospective basis from 31<br />
December <strong>2009</strong>. At the date of preparing these condensed interim consolidated financial<br />
statements, the competent EU bodies have not yet completed the endorsement process<br />
necessary for their adoption.<br />
On 16 April <strong>2009</strong>, the IASB issued a number of improvements to the IFRSs. The following<br />
are mentioned since they were described by the IASB as requiring changes in the<br />
presentation, recognition or measurement of captions, while those merely involving changes<br />
in terminology or editorial corrections, with minimal effect in accounting terms, and those<br />
affecting principles and interpretations not applicable to the <strong>Indesit</strong> Group have been<br />
ignored.<br />
- IFRS 2 – Share-based Payments: this amendment, which must be applied from 1<br />
January 2010 (early adoption is allowed), clarifies - following amendment of the definition<br />
of a business combination in IFRS 3 - that the contribution of a line of business on the<br />
formation of a joint venture and the combination of businesses and lines of business in<br />
entities under joint control do not fall within the scope of application of IFRS 2.<br />
- IFRS 5 – Non-current Assets Held for Sale and Discontinued Operations: this<br />
amendment, which is applicable on a prospective basis from 1 January 2010, clarifies<br />
that IFRS 5 and the other IFRSs making specific reference to non-current assets (or<br />
groups of assets) classified as available for sale or as discontinued operations, establish<br />
all the disclosures required for these types of assets or operations.<br />
6. Changes in the scope of consolidation<br />
Commencing from these condensed interim consolidated financial statements, <strong>Indesit</strong><br />
Company Ireland Ltd and <strong>Indesit</strong> Middle East FZE are consolidated on a line-by-line basis.<br />
In addition, commencing from these condensed interim consolidated financial statements,<br />
Aeradriatica S.p.A. is now part of the scope of consolidation following its spin-off from<br />
Aermarche S.p.A., which has been sold to third parties and therefore deconsolidated.<br />
These changes in the scope of consolidation have not resulted in significant changes<br />
affecting the comparability of amounts with respect to prior periods.<br />
7. Operating segments<br />
The Group's operating segments, as defined in IFRS 8 – Operating Segments, comprise the<br />
geographical areas which, in organisational terms, generate revenues and costs that are<br />
periodically reviewed by the most senior decision makers in order to evaluate performance<br />
and decide on the allocation of resources, and for which separate financial information is<br />
available.<br />
The Group identifies the following operating segments:<br />
Italy;<br />
UK and Ireland;<br />
Russia, comprising Russia and the Asian republics;<br />
Western Europe, comprising France, Spain, Portugal, Germany, Austria, Benelux,<br />
Scandinavia, Switzerland, Estonia, Lithuania and Latvia;<br />
Eastern Europe, comprising Poland, Ukraine, Moldova, Czech Republic, Hungary,<br />
Romania, Greece, Bulgaria, Turkey and the Balkans;<br />
Overseas, which includes all other non-European markets.<br />
31
<strong>Half</strong>-year report at 30 June <strong>2009</strong><br />
Segment revenue is calculated based on the final destination of the products and segment<br />
results take account of all expenses that can be directly allocated to the geographical areas<br />
concerned. The costs not allocated to geographical areas include non-recurring charges and<br />
corporate costs. Similarly, financial income and expenses and taxation are not allocated to<br />
the various geographical areas.<br />
Except for trade receivables, assets, liabilities and investments are not allocated to<br />
geographical areas and are examined by senior management at Group level.<br />
The trade receivables allocated to geographical areas and reviewed by the most senior<br />
decision makers comprise those deriving from the sale of finished products. They do not<br />
include receivables deriving from the provision of services, advances to suppliers and the<br />
effects of any disposals of receivables.<br />
The following tables present the Group's operating information analysed by geographical<br />
area based on the final destination of the products.<br />
Analysis by operating segment at 30 June <strong>2009</strong><br />
(million Euro)<br />
UK and<br />
West East<br />
Russian<br />
Overseas Costs not<br />
Italy Area Ireland<br />
Europe Europe<br />
Total<br />
Fed. Area<br />
Area allocated<br />
Area<br />
Area Area<br />
Total Sales 229,0 340,3 152,6 261,9 160,7 59,2 0,0 1.203,7<br />
Total Sales 229,0 340,3 152,6 261,9 160,7 59,2 0,0 1.203,7<br />
Cost of sales (171,7) (261,6) (114,2) (198,1) (131,9) (43,1) (17,1) (937,6)<br />
Selling and distribution expenses (29,0) (50,5) (15,2) (51,9) (26,7) (10,3) (14,6) (198,2)<br />
General and administrative expenses (2,3) (7,5) (5,6) (5,9) (2,8) (1,0) (27,4) (52,5)<br />
Segment results 26,0 20,7 17,6 6,0 (0,7) 4,9 (59,1) 15,4<br />
Net financial expenses 0,0 0,0 0,0 0,0 0,0 0,0 (36,2)<br />
Share of profit (losses) of associates 0,0 0,0 0,0 0,0 0,0 0,0 0,0<br />
Income tax expense 0,0 0,0 (4,6) (0,1) 0,1 0,0 (1,8)<br />
Profit attributable to the Group (22,6)<br />
Analysis by operating segment of 30 June 2008<br />
(million Euro)<br />
UK and<br />
West East<br />
Russian<br />
Overseas Costs not<br />
Italy Area Ireland<br />
Europe Europe<br />
Total<br />
Fed. Area<br />
Area allocated<br />
Area<br />
Area Area<br />
Total Sales 250,2 385,4 274,1 293,2 233,8 88,6 0,0 1.525,3<br />
Total Sales 250,2 385,4 274,1 293,2 233,8 88,6 0,0 1.525,3<br />
Cost of sales (188,8) (307,5) (184,6) (226,3) (180,6) (65,9) 11,0 (1.142,6)<br />
Selling and distribution expenses (34,3) (60,7) (25,0) (58,1) (35,1) (13,5) (25,2) (251,9)<br />
General and administrative expenses (2,2) (9,8) (6,5) (6,4) (3,2) (1,4) (28,9) (58,4)<br />
Segment results 25,0 7,4 58,0 2,4 14,9 7,8 (43,1) 72,4<br />
Net financial expenses 0,0 0,0 0,0 0,0 0,0 0,0 (13,9)<br />
Share of profit (losses) of associates 0,0 0,0 0,0 0,0 0,0 0,0 0,0<br />
Income tax expense 0,0 0,0 (14,9) (0,1) (0,2) 0,0 (24,4)<br />
Profit attributable to the Group 34,1<br />
32
<strong>Half</strong>-year report at 30 June <strong>2009</strong><br />
Trade receivables by operating segment at 30 June <strong>2009</strong><br />
(million Euro)<br />
30 June <strong>2009</strong><br />
% of rolling<br />
sales<br />
(12 months)<br />
30 June 2008<br />
% of rolling<br />
sales<br />
(12 months)<br />
Italy Area 110,6 21,3% 122,5 21,9%<br />
Uk and Ireland Area 53,1 6,1% 76,2 7,3%<br />
Russia Area 29,2 5,4% 66,7 8,9%<br />
West Europe Area 74,5 11,6% 104,0 14,3%<br />
East Europe Area 89,7 18,6% 117,4 20,2%<br />
Overseas Area 29,4 20,7% 42,9 23,9%<br />
Not allocated trade receivables 29,7 - 119,4 -<br />
Total 416,2 12,6% 649,0 16,6%<br />
33
<strong>Half</strong>-year report at 30 June <strong>2009</strong><br />
8. NOTES TO THE CONSOLIDATED INCOME STATEMENT, BALANCE SHEET AND<br />
STATEMENT OF CASH FLOWS<br />
8.1. Revenue<br />
Revenue is analysed as follows:<br />
(million Euro)<br />
30 June <strong>2009</strong> 30 June 2008<br />
Revenue from sale of finished products 1.102,1 1.421,9<br />
Revenue from provision of services 101,6 103,4<br />
Total Revenue 1.203,7 1.525,3<br />
Revenues from the provision of services relate to services provided to customers (transport)<br />
and to end consumers (after-sales maintenance) and to the sale of extended warranties<br />
beyond the legal minimum period.<br />
8.2. Cost of sales<br />
Cost of sales consists of all production-related costs and mainly comprises the cost of raw<br />
materials and components, external processing, direct and indirect labour, the depreciation<br />
of property, plant and equipment, internal handling and logistics, inventory write-downs,<br />
provisions for product warranty and provisions for risks and charges, research and<br />
development expenses that are not capitalised.<br />
Cost of sales is analysed below by type of expenditure.<br />
(million Euro )<br />
30 June <strong>2009</strong> 30 June 2008<br />
Change in the inventories of finished products 1,6 133,9<br />
Purchase of raw materials, components, materials and change in inventories (655,4) (974,1)<br />
Services (66,2) (75,5)<br />
Payroll costs (131,9) (171,6)<br />
Depreciation and amortization (55,6) (52,3)<br />
Other expenses (45,9) (23,6)<br />
Other income 15,9 20,6<br />
Total (937,6) (1.142,6)<br />
The cost of sales fell by slightly less than the decrease in volume. This was due to the lower<br />
absorption of industrial overheads, partially offset by the lower cost of raw materials, an<br />
improvement in production efficiency and the positive effect of the depreciation of the Polish<br />
zloty and Russian rouble on the production costs incurred in those currencies.<br />
8.3. Selling and distribution expenses<br />
Selling and distribution expenses comprise all the costs incurred to commercialise products,<br />
including advertising and promotion, and provide after-sales services, as well as the costs of<br />
distributing products to the Group's warehouses and to customers.<br />
Selling and distribution expenses are analysed below by type.<br />
(million Euro )<br />
30 June <strong>2009</strong> 30 June 2008<br />
Change in the inventories of finished products (0,6) (0,4)<br />
Purchase of raw materials, components, materials and change in inventories (3,6) (6,8)<br />
Services (128,6) (173,5)<br />
Payroll costs (47,5) (53,1)<br />
Depreciation and amortization (4,8) (4,1)<br />
Other expenses (17,3) (21,6)<br />
Other income 4,2 7,6<br />
Total (198,2) (251,9)<br />
34
<strong>Half</strong>-year report at 30 June <strong>2009</strong><br />
The reduction in selling and distribution expenses reflects the lower volume of sales. The<br />
most significant decrease relates to the cost of services, mainly as a result of lower<br />
distribution costs and the significant reduction in advertising and promotional expenditure.<br />
8.4. General and administrative expenses<br />
General and administrative expenses include all general management and administrative<br />
costs, and all expenditure not directly attributable to production, sales or research and<br />
development units.<br />
General and administrative expenses are analysed below by type:<br />
(million Euro )<br />
30 June <strong>2009</strong> 30 June 2008<br />
Purchase of raw materials, components, materials and change in inventories (1,2) (0,3)<br />
Services (27,4) (34,2)<br />
Payroll costs (22,6) (23,4)<br />
Depreciation and amortization (7,3) (8,0)<br />
Other expenses (4,5) (4,9)<br />
Other income 10,6 12,1<br />
Total (52,5) (58,7)<br />
35
<strong>Half</strong>-year report at 30 June <strong>2009</strong><br />
8.5. Operating profit<br />
Operating profit is analysed below by type of cost.<br />
(million Euro)<br />
30 June <strong>2009</strong> 30 June 2008<br />
Revenue 1.203,7 1.525,3<br />
Change in the inventories of finished products 0,9 133,7<br />
Purchase of raw materials, components, materials and change in inventories (660,2) (981,2)<br />
Services (222,4) (283,3)<br />
Payroll costs (202,1) (247,9)<br />
Depreciation and amortisation (67,7) (64,4)<br />
Other income and expenses (37,0) (9,8)<br />
Operating profit 15,4 72,4<br />
In order to improve the presentation of the financial statements, the visible fees recovered<br />
(recharge of waste equipment disposal costs) are now deducted from the corresponding<br />
charges classified as part of the cost of services. The comparative data at 30 June 2008 has<br />
also been reclassified.<br />
The number of employees at 30 June <strong>2009</strong> is 16,805 (17,483).<br />
In addition to the factors discussed above, the increase in other costs and revenues was due<br />
to the recognition of higher restructuring charges in relation to the reorganisation of<br />
production by the Group.<br />
This caption also includes non-recurring income deriving from the relief of social security<br />
contributions and taxes for the areas affected by the 1997 earthquake.<br />
As required by Consob Communication DEM/6064293 dated 28 July 2006, non-operating<br />
income and expenses are detailed in the following table. They mainly comprise restructuring<br />
charges.<br />
(million Euro)<br />
Cost of<br />
Sales<br />
Selling and<br />
distribution<br />
expenses<br />
General and<br />
administrative<br />
expenses<br />
30 June <strong>2009</strong><br />
Non recurring restructuring charges (36,3) (4,1) (0,8) (41,1)<br />
Other non-recurring items 4,8 0,8 0,8 6,3<br />
Total (31,3) (3,3) (0,0) (34,8)<br />
The restructuring charges relate to the above-mentioned reorganisations and, in particular, to<br />
the closure of the Kinmel Park factory in the UK and the reorganisation of production at the<br />
None factory in Italy. The other net non-recurring income and charges mainly reflect the<br />
accounting recognition of relief from taxes and contributions for the areas affected by the<br />
1997 earthquake (Law 103/2008) and certain penalties incurred.<br />
Non-recurring charges have an immediate cash flow effect, except for restructuring costs<br />
whose cash flow effect is spread over a number of years consistent with the reorganisation<br />
plans concerned. Total payables and provisions for non-recurring transactions at 30 June<br />
<strong>2009</strong> amount to 32.5 million euro and the cash flows absorbed by them was 0.9 million euro.<br />
8.6. Interest expense, interest income, exchange rate differences and other net<br />
financial expenses<br />
Net financial expenses are analysed at 30 June <strong>2009</strong> as follows:<br />
36
<strong>Half</strong>-year report at 30 June <strong>2009</strong><br />
(million Euro)<br />
30 June <strong>2009</strong> 30 June 2008<br />
Interest income 0,6 5,6<br />
Interest income on UK pension schemes 0,3 3,1<br />
Mark-to-market derivatives - 0,1<br />
Total interest income 0,9 6,6<br />
Interest expense (14,0) (20,5)<br />
Interest expense on post employment employee benefits (1,2) (1,2)<br />
Mark-to-market derivatives (3,7) 4,8<br />
Total interest expense (18,9) (16,9)<br />
Exchange rate fluctuations (16,6) (2,3)<br />
Commissions (1,6) (1,3)<br />
Total net financial expenses (36,2) (13,9)<br />
See note 9 for information about derivatives outstanding at 30 June <strong>2009</strong>.<br />
8.7. Income tax<br />
Income tax, amounting to 1.8 million euro (24.4 million euro), comprises current taxes of 23.1<br />
million euro (29.9 million euro) and net deferred tax assets of 21.3 million euro (5.5 million<br />
euro), mainly recognised in relation to the provisions for restructuring costs.<br />
8.8. Property, plant and equipment<br />
Property, plant and equipment are analysed as follows:<br />
(million Euro)<br />
30 June <strong>2009</strong> 31 December 2008 30 June 2008<br />
Land and buildings 259,3 270,8 266,4<br />
Plant and machinery 240,6 261,9 271,1<br />
Industrial and commercial equipment 81,0 86,2 86,5<br />
Assets under construction 28,2 41,4 88,7<br />
Other assets 26,4 32,4 34,8<br />
Total 635,5 692,8 747,5<br />
The change in the historical cost of property, plant and equipment is shown below:<br />
(million Euro) 31 December 2008 Additions Decreases<br />
Exchange<br />
rate Reclassifications 30 June <strong>2009</strong><br />
differences<br />
Land and buildings 398,7 0,4 (1,5) (2,9) - 394,7<br />
Plant and machinery 722,9 5,6 (23,5) (0,4) 4,5 709,1<br />
Industrial and commercial equipment 423,2 1,0 (7,1) (1,8) 13,1 428,6<br />
Assets under construction 41,4 7,0 (0,4) (2,5) (17,5) 28,2<br />
Other assets 122,0 0,3 (4,6) 2,9 0,7 121,4<br />
Total 1.708,3 14,4 (37,1) (4,6) 0,8 1.681,9<br />
The changes in the related accumulated depreciation were as follows:<br />
(million Euro) 31 December 2008<br />
Depreciation<br />
and<br />
impairment<br />
losses<br />
Decreases<br />
Exchange<br />
rate<br />
differences<br />
Reclassifications 30 June <strong>2009</strong><br />
Land and buildings (127,9) (6,6) 1,1 (2,0) - (135,4)<br />
Plant and machinery (461,0) (27,2) 23,3 (3,4) (0,1) (468,4)<br />
Industrial and commercial equipment (337,0) (14,9) 6,5 (1,7) (0,5) (347,5)<br />
Other assets (89,6) (2,9) 0,4 (2,9) 0,0 (95,0)<br />
Totale (1.015,5) (51,7) 31,4 (10,0) (0,6) (1.046,4)<br />
The changes in the net carrying amount of property, plant and equipment are summarised in<br />
the following table:<br />
37
<strong>Half</strong>-year report at 30 June <strong>2009</strong><br />
(million Euro) 31 December 2008 Additions<br />
Depreciation<br />
and<br />
impairment<br />
losses<br />
Decreases<br />
Exchange rate<br />
differences<br />
Reclassificat<br />
ions<br />
30 June <strong>2009</strong><br />
Land and buildings 270,8 0,4 (6,6) (0,3) (4,9) - 259,3<br />
Plant and machinery 261,9 5,6 (27,2) (0,2) (3,8) 4,3 240,6<br />
Industrial and commercial equipment 86,2 1,0 (14,9) (0,5) (3,5) 12,7 81,0<br />
Assets under construction 41,4 7,0 - (0,4) (2,5) (17,5) 28,2<br />
Other assets 32,4 0,3 (2,9) (4,2) 0,0 0,7 26,4<br />
Total 692,8 14,4 (51,7) (5,7) (14,7) 0,2 635,5<br />
In line with the containment policy announced by the Group, in <strong>2009</strong> investments have been<br />
restricted to strategic and/or essential projects, with a focus on the development and launch<br />
of new products and the improvement of manufacturing processes.<br />
8.9. Goodwill and other intangible assets with an indefinite useful life<br />
Goodwill and other intangible assets with an indefinite useful life are analysed as follows:<br />
(million Euro)<br />
30 June <strong>2009</strong> 31 Dec 2008 30 June 2008<br />
Goodwill 129,8 116,4 139,9<br />
Brands with an indefinite useful life 102,2 91,4 135,5<br />
Total goodwill and other intangible assets with an indefinite useful life 232,0 207,7 275,4<br />
The changes in the net carrying amount of goodwill and other intangible assets with an<br />
indefinite useful life are summarised in the following table:<br />
(million Euro) 31 Dec 08<br />
Exchange rate<br />
differences<br />
Reclassifications 30 June 09<br />
Goodwill 116,4 13,5 - 129,8<br />
Brands with an indefinite useful life 91,4 10,8 - 102,2<br />
Total 207,7 24,3 - 232,0<br />
The brand name with an indefinite useful life (Hotpoint) and goodwill relate to the acquisition<br />
of General Domestic Appliances Holding Ltd. As mentioned in the consolidated financial<br />
statements at 31 December 2008, part of the goodwill deriving from this acquisition was<br />
allocated to the Group Cash Generating Units (CGUs) that benefit from the synergies<br />
deriving from this acquisition.<br />
Considering the results for the first half of <strong>2009</strong>, checks were made on the principal plan<br />
assumptions made when preparing the consolidated financial statements at 31 December<br />
2008, in order to calculate the recoverable value of the CGUs to which the intangible assets<br />
with an indefinite useful life were allocated. These checks did not identify any circumstances<br />
at 30 June <strong>2009</strong> making it necessary to repeat the impairment tests at the level of the group<br />
CGU o the UK CGU. There is no apparent need to adjust the carrying amounts of these<br />
assets, given broad compliance with the plans made by the Group and recent trends in<br />
exchange and interest rates.<br />
8.10. Other intangible assets with a finite life<br />
Other intangible assets are analysed as follows:<br />
(million Euro)<br />
30 June <strong>2009</strong> 31 Dec 2008 30 June 2008<br />
Development expenses 45,8 37,7 35,7<br />
Licences and software 39,1 42,0 39,7<br />
Brands with a finite useful life 25,3 26,5 8,4<br />
Intangible assets under development 4,3 12,4 11,9<br />
Other 5,2 5,3 6,7<br />
Total 119,7 123,9 102,3<br />
The development expenditure capitalised during the first half of <strong>2009</strong> totalled 8.2 million euro<br />
(6.1 million euro).<br />
The changes in the historical cost of other intangible assets with a finite useful life during the<br />
period are shown below:<br />
38
<strong>Half</strong>-year report at 30 June <strong>2009</strong><br />
(million Euro) 31 Dec 2008 Increases Decreases<br />
Exchange<br />
rate<br />
differences<br />
Reclassificat<br />
ions<br />
30 June <strong>2009</strong><br />
Development expenses 81,8 7,0 (13,8) 3,7 6,2 84,9<br />
Licences and software 76,1 1,5 (8,5) 1,1 0,8 70,9<br />
Brands with a finite useful life 18,3 - - 5,4 - 23,7<br />
Intangible assets under development 12,3 1,5 0,2 (2,2) (7,6) 4,3<br />
Other 4,1 0,0 (0,5) (0,2) 0,3 3,6<br />
Total 192,6 10,0 (22,7) 7,8 (0,3)<br />
The changes in the related accumulated amortisation were as follows:<br />
187,4<br />
(million Euro) 31 Dec 2008<br />
Amortization<br />
and<br />
impairment<br />
losses<br />
Decreases<br />
Exchange<br />
Reclassificat<br />
rate<br />
ions<br />
differences<br />
30 June <strong>2009</strong><br />
Development expenses (44,1) (7,6) 13,5 (1,5) 0,6 (39,1)<br />
Licences and software (34,0) (5,6) 8,5 (0,7) - (31,9)<br />
Brands with a finite useful life 8,2 (2,5) (0,0) (4,1) - 1,7<br />
Other 1,2 (0,2) 0,5 0,0 0,0 1,6<br />
Total (68,7) (15,8) 22,6 (6,4) 0,6 (67,7)<br />
The changes in the net carrying amount of other intangible assets with a finite life are<br />
summarised in the following table:<br />
(million Euro) 31 Dec 2008 Increases<br />
Amortization<br />
and<br />
impairment<br />
losses<br />
Decreases<br />
Exchange<br />
rate<br />
differences<br />
Reclassificati<br />
ons<br />
30 June <strong>2009</strong><br />
Development expenses 37,7 7,0 (7,6) (0,3) 2,1 6,8 45,8<br />
Licences and software 42,0 1,5 (5,6) (0,0) 0,4 0,8 39,1<br />
Brands with a finite useful life 26,4 - (2,5) (0,0) 1,2 - 25,3<br />
Intangible assets under development 12,3 1,5 - 0,2 (2,2) (7,6) 4,3<br />
Other 5,1 0,0 (0,2) (0,0) (0,2) 0,3 5,2<br />
Total 123,7 10,0 (15,8) (0,1) 1,4 0,3 119,7<br />
8.11. Inventories<br />
Inventories are analysed as follows:<br />
(million Euro)<br />
30 June <strong>2009</strong> 31 Dec 2008 30 June 2008<br />
Raw materials, components and semi-finished products 74,9 114,5 106,3<br />
Obsolescence provision (2,8) (2,2) (1,9)<br />
Total raw materials 72,1 112,2 104,4<br />
Finished products, components and semi-finished products 244,4 246,0 330,9<br />
Obsolescence provision (9,9) (11,3) (10,8)<br />
Total finished products and semi-finished products 234,5 234,7 320,1<br />
Spare parts 33,1 28,8 36,5<br />
Obsolescence provision (1,7) (1,7) (3,4)<br />
Total Spare part 31,4 27,1 33,1<br />
Total Inventories 338,0 374,1 457,6<br />
The reduction in inventories mainly reflects the adjustment of stocks to reflect forecasts for<br />
production and future sales.<br />
The obsolescence provision at 30 June <strong>2009</strong> totals 14.4 million euro (16.0 million euro) and<br />
the amount accrual for the period was 0.8 million euro (utilisation of 2.1 million euro).<br />
8.12. Trade receivables<br />
Trade receivables comprise amounts due from customers as a result of commercial<br />
transactions and the provision of services, stated net of the provision for doubtful accounts.<br />
The provision for doubtful accounts totals 53.3 million euro (38.1 million euro) at 30 June<br />
<strong>2009</strong>, and the related provision during the period amounted to 6.9 million euro (utilisation of<br />
1.8 million euro).<br />
39
<strong>Half</strong>-year report at 30 June <strong>2009</strong><br />
The reduction in trade receivables mainly reflects the sale without recourse of receivables<br />
and notes falling due subsequent to 30 June <strong>2009</strong>, equal to 54.3 million euro, and the lower<br />
volume of sales.<br />
8.13. Other receivables and current assets<br />
Other receivables and current assets are analysed as follows:<br />
(million Euro)<br />
30 June <strong>2009</strong> 31 Dec 2008 30 June 2008<br />
Due from employees 2,8 2,2 3,0<br />
Due from social security and pension institutions 6,1 3,0 3,9<br />
Grants due from public bodies 5,9 5,6 6,3<br />
Insurance reimbursements - 0,2 7,5<br />
VAT receivable 20,5 46,3 42,9<br />
Other receivables 7,5 6,3 4,3<br />
Total other receivables and other current assets 42,7 63,6 67,9<br />
The reduction since 31 December 2008 was mainly due to the decrease in the receivable<br />
VAT recoverable due to the decline in purchases linked to the decrease in sales.<br />
8.14. Equity attributable to the Group<br />
Share capital comprises ordinary shares and savings shares, as analysed below inclusive of<br />
treasury shares.<br />
Description<br />
30 June 09<br />
Number<br />
Euro<br />
Ordinary shares 113.630.684 102.267.616<br />
Savings shares 511.282 460.154<br />
Total 114.141.966 102.727.770<br />
No dividends were paid during the first half of <strong>2009</strong> (52.5 million euro in 2008).<br />
With reference to the amounts reported in the Consolidated Statement of Comprehensive<br />
Income, during the first half of <strong>2009</strong> the loss on cash flow hedges is negative for 9.9 million<br />
euro and it comprises: the pre-tax reduction in cash flow hedges generated during the period<br />
for 0.3 million euro, the pre-tax increase in cash flow hedges reclassified to the income<br />
statement for 14.7 million euro, and related tax effects of 4.5 million euro.<br />
The gain on the translation of foreign currency financial statements for the first half of <strong>2009</strong><br />
was 10.8 million euro.<br />
The calculations of basic earnings per share and diluted earnings per share reported in the<br />
consolidated income statements for the six months ended 30 June <strong>2009</strong> and 2008 are set<br />
out in the following table.<br />
40
<strong>Half</strong>-year report at 30 June <strong>2009</strong><br />
Basic EPS 30 June <strong>2009</strong> 30 June 2008<br />
Basic attributable earnings (million Euro) (22,6) 33,7<br />
Basic average number of ordinary shares (thousand) 102.590,9 102.590,9<br />
Ordinary EPS (without savings shares effect) (0,22) 0,33<br />
Unit earnings attributed to savings shares (Euro) (0,22) 0,33<br />
Number of savings shares (thousand) 511,3 511,3<br />
Earnings attributed to savings shares (million Euro) 0,1 (0,2)<br />
Basic attributable earnings (million Euro) (22,5) 33,5<br />
Basic average number of ordinary shares (thousands) 102.590,9 102.590,9<br />
Basic EPS (Euro) (0,22) 0,33<br />
Diluted EPS<br />
Basic attributable earnings (Euro million) (22,5) 33,5<br />
Basic average number of ordinary shares (thousands) 102.590,9 102.590,9<br />
Average number of shares granted to Directors without payment (thousands) - -<br />
Average number of shares granted to employees without payment (thousands) 21,9 150,7<br />
Total 102.612,8 102.741,7<br />
Diluted EPS (Euro) (0,22) 0,33<br />
8.15. Net financial indebtness<br />
The net financial indebtness of the Group is analysed below.<br />
(million Euro)<br />
30 June <strong>2009</strong> 31 Dec 2008 30 June 2008<br />
Current financial assets 8.15.1 27,6 43,8 53,5<br />
Cash and cash equivalents 8.15.2 136,1 193,2 152,3<br />
Banks and other financial payables 8.15.3 (297,3) (268,2) (513,8)<br />
Net financial position - short term (133,6) (31,2) (307,9)<br />
Medium/long-term financial payables 8.15.4 (392,6) (451,9) (297,8)<br />
Net financial position (1) (526,2) (483,1) (605,7)<br />
Other non-current financial assets 8.15.5 2,1 9,3 13,3<br />
Net financial position (524,1) (473,8) (592,5)<br />
1) As defined in CONSOB Communication DEM /6064293 dated 28/07/2006, applying the CESR<br />
recommendations dated 10/02/2005<br />
8.15.1 Current financial assets<br />
Current financial assets include assets deriving from the measurement of financial<br />
transactions in accordance with IAS 39. See note 9 below for more information about these<br />
financial transactions.<br />
8.15.2 Cash and cash equivalents<br />
Cash and cash equivalents include bank and postal deposits, as well as cheques and other<br />
amounts on hand. The changes in liquidity during the period are analysed in the consolidated<br />
statement of cash flows.<br />
8.15.3 Banks and other financial payables<br />
Banks and other financial payables mainly comprise amounts due within the current year.<br />
This caption is analysed below.<br />
41
<strong>Half</strong>-year report at 30 June <strong>2009</strong><br />
(million Euro)<br />
30 June <strong>2009</strong> 31 Dec 2008 30 June 2008<br />
Short-term bank loans 197,5 172,4 322,4<br />
Short-term advances for transfer of receivables 8,3 3,8 105,8<br />
Liability from the measurement of derivative instruments 18,2 18,4 8,2<br />
Current portion of bonds issued 57,1 58,5 11,0<br />
Current portion of liability from the acquisition of GDAH - - 35,1<br />
Current portion of medium/long-term bank loans 15,5 14,3 30,5<br />
Current portion of other medium/long-term loans 0,8 0,8 0,8<br />
Total 297,3 268,2 513,8<br />
Short-term bank borrowings comprise bank overdrafts, the current portion of the revolving<br />
lines of credit drawn down and other short-term advances in various forms.<br />
Short-term advances for transfer of receivables mainly relate to the sale of receivables with<br />
recourse basis.<br />
8.15.4 Medium and long-term interest-bearing loansand borrowing<br />
Medium and long-term interest-bearing loans and borrowingare analysed as follows:<br />
(million Euro)<br />
30 June <strong>2009</strong> 31 Dec 2008 30 June 2008<br />
Bonds 201,2 212,0 212,3<br />
Due to banks 168,1 227,3 31,0<br />
Other financial payables 23,3 12,6 54,5<br />
Total 392,6 451,9 297,8<br />
The bonds were subscribed by institutional investors (U.S. Private Placement) and are<br />
denominated in USD. The change in their fair value is offset by the change in the fair value of<br />
the derivative arranged to hedge this liability (Cross Currency Swap).<br />
The interest and exchange rate risks relating to the above-mentioned U.S. Private Placement<br />
have been hedged by a Cross Currency Swap which is described below in note 9 on<br />
Financial instruments.<br />
The long-term amounts due to banks mainly comprise the partial draw down of 150.0 million<br />
euro against a revolving line of credit for 350.0 million euro that expires in 2012.<br />
Other payables are analysed as follows:<br />
(million Euro)<br />
30 June <strong>2009</strong> 31 Dec 2008 30 June 2008<br />
Lease payables 0,7 0,9 1,1<br />
Liability from the measurement of derivatives 22,2 11,1 52,8<br />
Other financial payables 0,4 0,6 0,6<br />
Total 23,3 12,6<br />
Medium and long-term payables are analysed by maturity in the following table.<br />
54,5<br />
(million Euro)<br />
Medium/long-term<br />
financial payables<br />
Between 1 and 5 years<br />
Beyond 5 years<br />
Bonds 201,2 78,4 122,8<br />
Due to banks 168,1 168,1 -<br />
Other fiancial payables 23,3 3,8 19,6<br />
Total 392,6 250,2 142,4<br />
Among other obligations, the bond and the committed bank loans require compliance with<br />
certain financial covenants. In particular, the financial parameters applying at 30 June each<br />
year are set out below:<br />
42
<strong>Half</strong>-year report at 30 June <strong>2009</strong><br />
Covenants<br />
EBITDA / Net financial expenses 3,5<br />
Net borrowing / EBITDA 3,5<br />
Equity<br />
covenant limit<br />
320 million Euro<br />
In addition to the financial covenants, the bond and the committed lines of credit require<br />
<strong>Indesit</strong> Company S.p.A. and, in certain cases, a number of Group companies to comply with<br />
other undertakings (affirmative and negative covenants) that reflect market standards for<br />
transactions of a similar nature, amount, maturity and risk profile.<br />
Failure to comply with these covenants would, following the elapse of a given period of time<br />
available to correct such non-compliance, give the counterparty a right to the early<br />
repayment of the related borrowings. The above parameters are monitored constantly by the<br />
Group and, at 30 June <strong>2009</strong> all the covenants have been respected.<br />
The maturity profile of long-term borrowing is presented below:<br />
Medium/longterm<br />
financial<br />
payables 2010 2011 2012<br />
MATURITY<br />
2013 2014 2015 2016<br />
Bonds 201,2 4,7 57,1 6,8 6,5 111,4 0,8 13,8<br />
Due to banks 168,1 3,9 15,7 147,3 1,2 0,0 0,0 0,0<br />
Other financial payables 23,3 1,7 1,7 0,1 0,2 16,8 0,0 2,8<br />
Total 392,6 10,4 74,5 154,2 7,9 128,2 0,8 16,6<br />
8.15.5 Other non-current financial assets<br />
Other non-current financial assets are analysed as follows:<br />
(million Euro)<br />
30 June <strong>2009</strong> 31 Dec 2008 30 June 2008<br />
Term deposits 0,0 5,1 5,1<br />
Asset from the measurement of derivative instruments 2,0 4,2 8,2<br />
Total 2,1 9,3<br />
All mature other non-current financial assets within 5 years.<br />
13,3<br />
8.16. Employee benefits<br />
Employee benefits reflect the provisions recorded for such post-employment benefits as<br />
severance indemnities and pension plans.<br />
This caption solely comprises the liability arising in relation to defined benefit plans; these<br />
plans principally relate to the TFR accrued by Italian companies up to 31 December 2006, for<br />
46.3 million euro (48.9 million euro), the pension funds of the British companies, for 19.1<br />
million euro (25.8 million euro) and other smaller plans, for 2.2 million euro (2.3 million euro).<br />
8.17. Provisions for risks and charges<br />
The provisions for risks and charges are analysed as follows:<br />
43
<strong>Half</strong>-year report at 30 June <strong>2009</strong><br />
<strong>2009</strong><br />
Opening<br />
balance<br />
1/1/<strong>2009</strong><br />
Provisions<br />
Uses<br />
Other<br />
movements<br />
Closing<br />
balance<br />
30/6/<strong>2009</strong><br />
Current<br />
portion<br />
Noncurrent<br />
portion<br />
Provision for warranties 57,2 5,3 (5,6) 0,3 57,3 31,2 25,9<br />
Provision for agents' termination indemnities 1,4 0,0 (0,0) - 1,4 (0,0) 1,4<br />
Provisions for restructuring 0,3 21,9 (0,1) - 22,1 5,9 16,2<br />
Provision for WEEE 8,0 0,8 (0,4) 0,1 8,5 3,8 4,8<br />
Provision for onerous contracts 5,0 - (2,1) 0,5 3,4 3,4 -<br />
Provision for disputes 23,3 0,2 (2,8) (0,3) 20,3 20,3 0,1<br />
Total 95,2 28,2 (11,0) 0,6 113,0 64,6 48,4<br />
2008<br />
Opening<br />
balance<br />
1/1/2008<br />
Provisions<br />
Uses<br />
Other<br />
movements<br />
Closing<br />
balance<br />
30/6/2008<br />
Current<br />
portion<br />
Noncurrent<br />
portion<br />
Provision for warranties 61,6 4,3 (5,3) 0,4 60,9 35,0 25,9<br />
Provision for agents' termination indemnities 1,3 0,1 (0,1) (0,0) 1,3 - 1,3<br />
Provisions for restructuring 1,4 - (0,3) - 1,1 0,1 1,0<br />
Provision for WEEE 10,2 1,4 (2,5) 0,2 9,3 0,2 9,0<br />
Provision for onerous contracts 3,5 0,4 - (0,3) 3,6 3,6 -<br />
Provision for disputes 14,0 8,5 (2,6) (0,6) 19,3 15,3 4,0<br />
Total 92,0 14,6 (10,8) (0,3) 95,5 54,2 41,3<br />
The increase in the provision for restructuring reflects provisions for charges associated with<br />
the reorganisation of the Group's production activities.<br />
8.18. Other non-current liabilities<br />
Other non-current liabilities solely relate to deferred grants from the government and other<br />
bodies. These grants are analysed by country below:<br />
(million Euro )<br />
30 June <strong>2009</strong> 31 Dec 2008 30 June 2008<br />
Italy 6,9 7,6 8,3<br />
Poland 31,7 34,7 44,2<br />
Other countries - - 0,1<br />
Other non-current liabilities 38,6 42,3 52,6<br />
Deferred Italian government grants totalling 0.7 million euro (0.7 million euro) were credited<br />
to the income statement for the period, together with deferred Polish government grants<br />
amounting to 2.0 million euro (1.6 million euro).<br />
8.19. Other payables<br />
Other payables are analysed as follows:<br />
(million Euro )<br />
30 June <strong>2009</strong> 31 Dec 2008 30 June 2008<br />
Due to social security and pension institutions 23,3 24,5 27,1<br />
Due to employees 69,7 48,0 72,8<br />
VAT payable 25,2 27,0 29,5<br />
Other payables 1,6 6,0 6,5<br />
Total 119,9 105,5 136,0<br />
8.20. Share-based payments (stock options)<br />
Stock option plan for Group executives and managers<br />
The resolutions adopted at the extraordinary meetings held on 16 September 1998 and on<br />
23 October 2001 authorised, pursuant to art. 2441 of the Italian Civil Code, two increases in<br />
share capital by up to 2,700,000 euro each, via the issue of a combined maximum of<br />
6,000,000 ordinary shares, nominal value Euro 0.90 each, to service the stock option plan for<br />
the Group's executives and managers. The Board of Directors, in the person of the<br />
Chairman, determines the number of options to be granted each year and identifies - on the<br />
recommendation of the Chief Executive Officer - the beneficiaries of the options. The options<br />
granted on 24 July 2003 (last grant date) envisage a vesting period of 3 years for the first<br />
50% and 4 years for the remaining 50%. The options granted previously envisage a vesting<br />
44
<strong>Half</strong>-year report at 30 June <strong>2009</strong><br />
period of 2 years and 3, years respectively, and may be exercised within 10 years of the<br />
grant date.<br />
No new plans were authorised during the first half of <strong>2009</strong> and no stock options were<br />
granted.<br />
STATEMENT OF CASH FLOWS<br />
8.21. Total profit, Income taxes, Depreciation and amortization, Income Taxes paid<br />
The total profit, income taxes, depreciation and amortization, all non-monetary items, are<br />
reported directly on the face of the income statement and in the related notes, to which<br />
reference is made. The provision for income taxes recorded in the first half of <strong>2009</strong> totalled<br />
1.8 million euro, while payments of 15.3 million euro have been made to settle the residual<br />
amount due for the prior year and make tax advances. The amounts due are determined with<br />
reference to tax regulations in the various countries in which the Group operates.<br />
8.22. Other non-monetary income and expenses, net<br />
The other non-monetary income and expenses, net, comprise all non-monetary items<br />
recorded in the income statement, except for income taxes, depreciation and amortization<br />
and the provisions deducted directly from asset captions (provision for doubtful accounts and<br />
provisions for obsolescence). Accordingly, they include provisions for warranties, provisions<br />
for risks and charges, disposal gains and losses, unrealised exchange rate fluctuations, and<br />
accrued interest income and expense. The interest collected and paid, reported separately,<br />
was essentially the same as the amounts recognised in the income statement.<br />
8.23. Change in trade receivables, inventories, trade payables<br />
This caption reports the cash absorbed or generated by the changes in net working capital,<br />
which comprises trade receivables, inventories and trade payables. The changes in trade<br />
payables relate solely to the supply of raw materials, goods and services, and exclude the<br />
changes in amounts due to suppliers of fixed assets, which are reported in the section of the<br />
statement of cash flows that reports the cash flows generated (absorbed) by investing<br />
activities.<br />
8.24. Change in other assets and liabilities<br />
This caption reports the change in all other current and non-current assets and liabilities, net<br />
of the lelated effect of the provisions for non-monetary income and expense. This represents<br />
the changes in the related balances with a direct effect on the absorption or generation of<br />
cash.<br />
8.25. Payments for acquisition of property, plant and equipment and proceeds from<br />
their disposal<br />
The cash flow from acquisition of property, plant and equipment reflect investments in the<br />
replacement of plant and in new plant, mainly by the companies operating in Turkey, Poland<br />
and the CIS. In this context, there were also changes in payables, receivables and advances<br />
to suppliers of property, plant and equipment.<br />
8.26. Payments for acquisition of intangible assets<br />
The cash flow from investments in intangible assets relate to the purchase of licences and<br />
software, and the capitalisation of development costs.<br />
The cash flows generated (absorbed) by investing activities include the amounts capitalised<br />
since these involve payments for the related internal costs incurred (mainly payroll). These<br />
payments essentially reflect the costs capitalised during the period.<br />
45
<strong>Half</strong>-year report at 30 June <strong>2009</strong><br />
8.27. Proceeds from the sale of non-current financial assets and investment in<br />
financial and other fixed assets<br />
Proceeds from the sale of non-current financial assets include the cash flows relating to<br />
changes in the carrying amount of non-current financial assets due to the collection of<br />
dividends from associates measured using the equity method.<br />
8.28. Other refunds of medium/long-term borrowings<br />
The repayments of other medium/long-term borrowings relate to loans from banks and other<br />
providers of finance.<br />
8.29. Change in current financial payables<br />
The change in current financial payables includes the change in short-term bank borrowing<br />
since this represents a technical form of short-term borrowing.<br />
9. Financial instruments<br />
Risk management policies<br />
The Group is exposed to the following principal financial risks deriving from operations:<br />
Liquidity risk: the Group defines liquidity risk as the risk that a Group company, or the<br />
Group as a whole, may be unable to meet its obligations on a timely basis.<br />
Market risks:<br />
o exchange rate: exchange rate risk relates to the adverse effects of changes<br />
in the exchange rates for foreign currencies on the economic-financial<br />
results and equity position of the Group.<br />
o interest rate: the Group defines interest rate risk as the risk that adverse<br />
movements in the interest rate curve (both changes in slope and parallel<br />
shifts) might have a negative effect on the cost of liabilities or the yield from<br />
financial assets and, in the final analysis, on the Group's net financal<br />
expenses.<br />
o commodity prices: the Group is subject to the risk that fluctuations in the<br />
prices for the commodities used in the production process might have an<br />
adverse effect on the results for the period.<br />
Credit risk: credit risk represents the Group's exposure to potential losses deriving from<br />
the failure of counterparts to meet their obligations.<br />
The above risks are managed in accordance with the guidelines established in the Treasury<br />
Policy approved by the Board of Directors and, with regard to the commodity price risk, in the<br />
context of the Group's purchasing policies.<br />
Information about the Group's exposure to and assessment of the above financial risks is<br />
provided in the consolidated financial statements at 31 December 2008. There have not<br />
been any significant changes subsequent to that date.<br />
Transactions outstanding at period end<br />
The transactions outstanding at 30 June <strong>2009</strong> and their fair values are reported in the<br />
following table, which also indicates the change in the carrying amount value of the<br />
underlyings (where applicable). This is followed by detailed information on the individual<br />
transactions.<br />
46
Nature of risk hedged<br />
Fair value of derivatives at<br />
30.06.<strong>2009</strong><br />
Fair value of derivatives at<br />
31.12.2008<br />
Change in fair value of derivatives at<br />
30.06.<strong>2009</strong> versus 31.12.2008<br />
Change in Fair value of underlyings<br />
at 30.06.<strong>2009</strong> vs. inception date<br />
Change in Fair value of underlyings<br />
at 31.12.2008 vs. inception date<br />
Change in Fair value of underlyings<br />
at 30.06.<strong>2009</strong> versus 31.12.2008<br />
Other non-current financial<br />
assets<br />
Current financial assets<br />
Medium/long-term financial<br />
payables<br />
Banks and other financial<br />
payables<br />
Total<br />
<strong>Half</strong>-year report at 30 June <strong>2009</strong><br />
Financial Instruments<br />
Classification at 30 June <strong>2009</strong><br />
Operation of cash flow<br />
hedging<br />
a Currency options Currency 0,5 19,2 (18,7) na na na - 1,9 - (1,4) 0,5<br />
b IRS on loans Interest rate - 0,0 (0,0) na na na - - - - -<br />
c Irs on Securitization Interest rate (6,8) (1,0) (5,7) na na na - - (2,9) (3,9) (6,8)<br />
d Forward Price (4,1) (6,3) 2,2 na na na - 0,9 - (4,9) (4,1)<br />
Total (10,3) 11,9 (22,2) na na na - 2,8 (2,9) (10,2) (10,3)<br />
Fair value hedges<br />
e CCS on bonds Currency/Interest rate (20,6) (11,3) (9,3) 17,3 4,9 12,4 0,9 1,8 (19,3) (4,0) (20,6)<br />
f IRS on bonds Interest rate 1,7 1,2 0,5 (1,7) (1,4) (0,2) 1,1 0,5 - - 1,7<br />
Total (19,0) (10,1) (8,9) 15,6 3,5 12,1 2,0 2,3 (19,3) (4,0) (19,0)<br />
Other hedges<br />
g Currency options Currency - 0,1 (0,1) na na na - - - - -<br />
h Forward Currency (3,0) 5,8 (8,8) na na na - 1,0 - (4,0) (3,0)<br />
Totale (3,0) 5,9 (8,9) na na na - 1,0 - (4,0) (3,0)<br />
Totale generale (32,3) 7,7 (39,9) 15,6 3,5 12,1 2,0 6,1 (22,2) (18,2) (32,3)<br />
a. The currency options recognised as cash flow hedges were acquired to hedge the<br />
exchange rate risk on highly likely future transactions and have a notional value of<br />
194.0 million euro. The principal hedged currencies are the British pound and the<br />
Polish zloty. The reduction was mainly due to the close-out, during the first half of the<br />
year, of transactions that had a positive value at year end (especially hedges of the<br />
British pound).<br />
b. The float-to-fix interest rate swap on loans outstanding at 31 December 2008 was<br />
closed-out during the first half of <strong>2009</strong>.<br />
c. Float-to-fix Interest Rate Swaps with a nominal value of 274.8 million euro, initially<br />
arranged to transform the exposure to the U.S. Private Placement from floating rate<br />
euro to fixed rate euro during the period March 2007 – March 2011 and not<br />
recognised as a hedge, have been designated from 1 July 2008 as cash flow hedges<br />
of the interest rate risk on part of the short-term loans, the use of which is expected to<br />
be equivalent to such Interest Rate Swaps in terms of their nominal value and<br />
maturities. The necessary effectiveness tests for the adoption of hedge accounting<br />
have been performed for this hedging relationship. The reduction was mainly due to<br />
the decrease in interest rates during the first half of the year.<br />
d. The forwards, designated as cash flow hedges, were arranged to hedge the<br />
exchange rate risk on future, highly likely transactions, and the price risk on future,<br />
highly likely purchases of commodities and semi-finished products; they have a<br />
nominal value of 101.5 million euro. With regard to the forwards hedging the rate<br />
exchange risk, the principal hedged currencies are the British pound, the Polish zloty,<br />
the Turkish lira and the Chinese reminbi. The commodity forwards relate to the<br />
forward purchase of copper and aluminium at fixed exchange rates.<br />
e. The cross currency swap was arranged to hedge the interest rate and exchange rate<br />
risks deriving from commitments in relation to the US Private Placement of bonds<br />
with a nominal value of 308.0 million dollars. This transaction converted the fixed rate<br />
US dollar bonds into floating rate euro. The notional value amounts to 256.9 million<br />
euro.<br />
f. The interest rate swap on the bonds relates to the euro tranche of the US Private<br />
Placement, with a nominal value of 18.3 million euro, and was arranged to hedge the<br />
47
<strong>Half</strong>-year report at 30 June <strong>2009</strong><br />
interest rate risk which was swapped from fixed to floating at the time the loan was<br />
arranged.<br />
g. The currency options not recognised for hedge accounting purposes were all closed<br />
out during the first half of the year.<br />
h. The currency forwards not recognised for hedge accounting purposes were mainly<br />
arranged to hedge exposures in the following currencies: British pound, Polish zloty,<br />
Turkish lira, Chinese reminbi, Hungarian forint and US dollar, and have a notional<br />
value of 333.9 million euro. The reduction was mainly due to the close-out during the<br />
first half of <strong>2009</strong> of transactions that had a positive value at year end, and to the<br />
negative fair value of instruments arranged during the period.<br />
10. Information required by IAS 24 on the remuneration of management and on related<br />
parties<br />
Remuneration of management<br />
In addition to the executive and non-executive directors and the statutory auditors, the<br />
managers with strategic responsibility for operations, planning and control include the<br />
Administration, Finance and Control Manager, the Marketing Manager, the Industrial<br />
Technical Manager and the Supply Chain and IT Manager.<br />
The expected gross remuneration of the above persons for <strong>2009</strong>, comprising all forms of<br />
compensation (gross pay, bonuses, fringe benefits, etc.), and the bonuses provided but not<br />
yet paid, since subject to the achievement of long-term objectives, is shown in the following<br />
table.<br />
Remunerations of directors, statutory auditors and managers with strategic responsibility operations at<br />
30/06/<strong>2009</strong><br />
(million Euro)<br />
Short-term<br />
benefits<br />
Long-term<br />
benefits<br />
Stock options<br />
Directors 4,6 0,1 -<br />
Statutory Auditors 0,1 - -<br />
Managers with strategic responsibility operations 3,7 1,7 -<br />
Total 8,4 1,7 -<br />
Remunerations of directors, statutory auditors and managers with strategic responsibility operations at<br />
30/06/2008<br />
(million Euro)<br />
Short-term<br />
benefits<br />
Long-term<br />
benefits<br />
Stock options<br />
Directors 4,0 1,7 -<br />
Statutory Auditors 0,1 - -<br />
Managers with strategic responsibility operations 3,0 2,1 -<br />
Total 7,1 3,8 -<br />
List of related parties<br />
The principal related parties (other than subsidiaries), as defined in IAS 24, with which<br />
commercial and financial transactions have been carried out, are listed below. All commercial<br />
and financial transactions with these entities were arranged on arms'-length terms and in the<br />
interest of the Group.<br />
48
<strong>Half</strong>-year report at 30 June <strong>2009</strong><br />
List of related parties<br />
Faber Factor Spa<br />
Fines<br />
Fineldo Spa<br />
LTT Life Tool Technologies Spa<br />
Marcegaglia Spa<br />
Marcegaglia Building Spa<br />
M&B Marchi e Brevetti Spa<br />
MCP eventi Srl<br />
Merloni Maria Paola<br />
Merloni Progetti Spa<br />
MPE Spa<br />
M P & S Srl<br />
Mita srl<br />
MPE Energia Srl<br />
Protecno Sa<br />
Tradeplace BV<br />
<strong>Indesit</strong> Company UK Ltd Group<br />
Personal Pension Plan<br />
Co Env<br />
Type of relationship<br />
Other related - Controlled by Fineldo S.p.A., Group parent of <strong>Indesit</strong> company<br />
Other related - Related to a member of the Merloni family<br />
Group parent belonging to Vittorio Merloni<br />
Other related - Related to a member of the Merloni family<br />
Other related - Related to a Director of the Group<br />
Other related - Related to a Director of the Group<br />
Associate<br />
Other related - Related to a member of the Merloni family<br />
Other related - Member of the Merloni family<br />
Other related - Controlled by Fineldo S.p.A., Group parent of <strong>Indesit</strong> company<br />
Other related - Controlled by Fineldo S.p.A., Group parent of <strong>Indesit</strong> company<br />
Other related - Related to a member of the Merloni family<br />
Other related - Related to a member of the Vigilance Committee<br />
Other related - Controlled by Fineldo S.p.A., Group parent of <strong>Indesit</strong> company<br />
Other related - Related to a member of the Merloni family<br />
Associate<br />
Pension fund<br />
Associate<br />
Merloni Ireland Pension Plan Pension fund<br />
In addition to the above companies, the following physical persons are also deemed to be<br />
related parties: members of the Board of Directors and the Board of Statutory Auditors,<br />
managers with strategic responsibility for management, planning and control activities, and<br />
the close family members of these parties, as defined in IAS 24.<br />
Nature of relations with the principal related parties<br />
<strong>Indesit</strong> Company UK Ltd Group Personal Pension Plan and Merloni Ireland Pension Plan<br />
<strong>Indesit</strong> Company UK Ltd and the employees concerned contribute to The <strong>Indesit</strong> Company<br />
UK Ltd Group Personal Pension Plan and the Merloni Ireland Pension Plan under the<br />
pension rules applicable in the UK.<br />
The Merloni Progetti Group<br />
The Merloni Progetti Group leases property to <strong>Indesit</strong> Company.<br />
Schedules summarising transactions with related parties<br />
The table on the next page summarises the balances and transactions with the related<br />
parties identified above, distinguishing between the transactions with the parent company,<br />
associates and other related parties. Furthermore, in accordance with Consob Resolution no.<br />
15519 dated 27 July 2006 and Consob Communication no. DEM/6064293 dated 28 July<br />
2006, Attachments 3 and 4 present the consolidated income statement and balance sheet<br />
showing the transactions with related parties separately and indicating their percentage<br />
incidence with respect to each financial statement caption.<br />
There have not been any significant, atypical and/or unusual transactions with related parties<br />
(except those with regard to the pension funds described above).<br />
The increase in the cost of purchasing from related parties reported in Cost of sales is due to<br />
the classification of the cost of purchasing raw materials from the Marcegaglia group, which<br />
is considered a related part following the appointment of Emma Marcegaglia as a director of<br />
<strong>Indesit</strong> Company. Purchases for similar amounts were also made in previous years.<br />
49
<strong>Half</strong>-year report at 30 June <strong>2009</strong><br />
Schedules summarizing transactions with related parties<br />
(million Euro)<br />
30 June <strong>2009</strong> 30 June 2008<br />
Revenue<br />
Other related 0,0 0,0<br />
Associates - -<br />
Parent Company 0,2 0,2<br />
Total 0,2 0,2<br />
Cost of sales<br />
Associates - -<br />
Other related (3,5) (9,7)<br />
Total (3,5) (9,7)<br />
Selling and distribution expenses<br />
Other related (0,0) (0,5)<br />
Associates - -<br />
Total (0,0) (0,5)<br />
General and administrative expenses<br />
Associates - (0,4)<br />
Other related (0,0) (0,3)<br />
Parent Company - (0,1)<br />
Total (0,0) (0,7)<br />
Property, plant and equipment<br />
Associates - -<br />
Other related 3,5<br />
Total 3,5 -<br />
Trade receivables<br />
Associates - -<br />
Other related 0,9 0,2<br />
Parent Company 0,2 0,2<br />
Total 1,2 0,4<br />
Trade payables<br />
Associates - 0,0<br />
Other related (2,9) 3,7<br />
Parent Company 0,0 0,1<br />
Total (2,9) 3,8<br />
Other payables<br />
Parent Company - -<br />
Other related (0,1) (0,1)<br />
Total (0,1) (0,1)<br />
The amounts for other related parties within Cost of sales mainly relate to the Marcegaglia<br />
group, 2.8 million Euro, for the purchase of raw materials.<br />
The amounts for other related parties within Trade payables mainly relate to the Marcegaglia<br />
group, 2.6 million Euro.<br />
The amounts for other related parties within Trade receivables mainly relate to the advance<br />
paid to Vittorio Merloni (Chairman), 0.9 million Euro, for the property disposal assigned to<br />
home and guest quarters for Executives and Managers of the Group. The total amount of<br />
property disposal is 2.3 million Euro.<br />
50
<strong>Half</strong>-year report at 30 June <strong>2009</strong><br />
Attachment 1. List of companies consolidated on a line-by-line basis<br />
List of companies consolidated on a line-by-line basis<br />
Name<br />
Registered<br />
Note<br />
Share capital<br />
Group interest<br />
office<br />
direct indirect<br />
<strong>Indesit</strong> Company Luxembourg Sa Luxembourg EUR 117.977.728,65 100,00 -<br />
<strong>Indesit</strong> Electrodomesticos Sa Spain EUR 1.000.000 78,95 21,05<br />
Merloni Domestic Appliances Ltd UK GBP 90.175.500 19,60 80,40<br />
<strong>Indesit</strong> Company Portugal Electrodomésticos Sa Portugal EUR 3.129.450 - 99,44<br />
<strong>Indesit</strong> Company International Bv The Netherlands EUR 272.270 - 100,00<br />
<strong>Indesit</strong> Pts Ltd UK GBP 1.000 - 100,00<br />
<strong>Indesit</strong> Company France Sas France EUR 17.000.000 - 99,99<br />
Fabrica Portugal Sa Portugal EUR 11.250.000 - 96,40<br />
<strong>Indesit</strong> Company Beyaz Esya Sanayi ve Ticaret A.S. Turkey TUL 53.870.580 - 100,00<br />
<strong>Indesit</strong> Company Beyaz Esya Pazarlama A.S. Turkey TUL 69.744 100,00 -<br />
<strong>Indesit</strong> Company Deutschland GmbH Germany EUR 550.000 - 99,75<br />
<strong>Indesit</strong> Company Ireland Reinsurance Ltd Ireland USD 750.000 - 100,00<br />
Closed Joint Stock Company <strong>Indesit</strong> International Russia RBL 1.664.165.000 100,00 -<br />
<strong>Indesit</strong> Company Polska Sp.z o.o. Poland PLN 540.876.500 100,00 - (1)<br />
Argentron Sa Argentina ARS 22.000.000 - 100,00<br />
<strong>Indesit</strong> Company Magyarország Kft Hungary HUF 2.116.400.000 - 100,00<br />
<strong>Indesit</strong> Company Ceská s.r.o Czech Republic CZK 1.000.000 100,00 -<br />
<strong>Indesit</strong> Company International Business Sa Switzerland SFR 250.000 - 100,00<br />
<strong>Indesit</strong> Company UK Finance Llp UK EUR 95.750.000 99,00 1,00<br />
<strong>Indesit</strong> Company Uk Holdings Ltd UK EUR 163.000.000 - 100,00<br />
General Domestic Appliances Holdings Ltd UK GBP 26.000.000 - 100,00<br />
<strong>Indesit</strong> IP Srl Italy EUR 10.000 100,00 -<br />
<strong>Indesit</strong> Aeradriatica Spa Italy EUR 23.068.545 100,00 -<br />
<strong>Indesit</strong> Company Ireland LTD UK EUR 100.000 100,00<br />
Airdum Ltd UK GBP 15.000 - 100,00<br />
Cannon Industries Ltd UK GBP 3.000.000 - 100,00<br />
Creda Domestic Appliances Service Ltd UK GBP 1.000 - 100,00<br />
Creda Ltd UK GBP 5.850.000 - 100,00<br />
Fixt Ltd UK GBP 2 - 100,00<br />
General Domestic Appliances International Ltd UK GBP 100.000 - 100,00<br />
Hotpoint Sales Ltd UK GBP 775.000 - 100,00<br />
Hotpoint UK Ltd UK GBP 50 - 100,00<br />
Jackson Appliances Ltd UK GBP 750.000 - 100,00<br />
<strong>Indesit</strong> Company UK Ltd UK GBP 76.195.645 - 100,00<br />
Xpelair Ltd UK GBP 825.000 - 100,00<br />
Ariston Group Services Ltd UK GBP 100 - 100,00<br />
RTC International Ltd UK GBP 50.000 - 100,00<br />
Wuxi <strong>Indesit</strong> Home Appliance Co. Ltd China USD 13.600.000 - 70,00<br />
<strong>Indesit</strong> Company Österreich Ges. m.b.h. Austria EUR 18.168,21 - 100,00<br />
<strong>Indesit</strong> Company Belgium SA Belgium EUR 150.000 - 100,00<br />
<strong>Indesit</strong> Middle East FZE Dubai AED 1.000.000 100,00 -<br />
(1) includes the percentage held subject to a resale clause.<br />
51
<strong>Half</strong>-year report at 30 June <strong>2009</strong><br />
Attachment 2. List of other investments in subsidiaries and associates<br />
List of other investments in subsidiaries and associates<br />
Name<br />
Registered<br />
office<br />
Share capital<br />
Group interest<br />
direct indirect<br />
<strong>Indesit</strong> Company Bulgaria Ltd Bulgaria BGL 7.805.000 100,00 -<br />
<strong>Indesit</strong> Company Domestic Appliances Hellas Mepe Greece EUR 18.000 - 100,00<br />
<strong>Indesit</strong> Company Norge Ltd Norway NOK 100.000 - 100,00<br />
<strong>Indesit</strong> Company Singapore Pte. Ltd. Singapore SGD 100.000 - 100,00<br />
Co Env Italy EUR 24.000 22,20 -<br />
Tradeplace B.V. The Nederlands EUR 30.000 20,00 -<br />
<strong>Indesit</strong> Rus Ltd Russia RBL 4.340.000 1,00 99,00<br />
52
<strong>Half</strong>-year report at 30 June <strong>2009</strong><br />
Attachment 3. Consolidated income statement for the period ended 30 June <strong>2009</strong>,<br />
prepared in accordance with Consob Resolution no. 15519 dated 27 July 2006 and<br />
Consob Communication no. DEM/6064293 dated 28 July 2006<br />
(million Euro)<br />
30 June <strong>2009</strong> 30 June 2008<br />
Balances of which<br />
non<br />
recurring<br />
of which<br />
with<br />
related<br />
parties<br />
Balances of which<br />
non<br />
recurring<br />
of which<br />
with<br />
related<br />
parties<br />
Revenue 1.203,7 - (0,2) 1.525,3 - (0,2)<br />
Cost of sales (937,6) (31,3) (3,5) (1.142,6) (16,7) (9,7)<br />
Selling and distribution expenses (198,2) (3,3) (0,0) (251,9) - (0,5)<br />
General and administrative expenses (52,5) (0,0) (0,0) (58,4) (0,1) (0,7)<br />
Operating profit 15,4 - - 72,4 - -<br />
Net financial expenses (36,2) - - (13,8) - -<br />
Share of profit (losses) of associates - - - - - -<br />
Profit before tax (20,8) - - 58,6 - -<br />
Income tax expenses (1) (1,8) 9,5 n.a. (24,4) 4,7 n.a.<br />
Profit (loss) for the period (22,6) - - 34,1 - -<br />
Percentage weight over Consolidated<br />
Income Statement items<br />
30 June <strong>2009</strong> 30 June 2008<br />
Balances<br />
of which<br />
non<br />
recurring<br />
of which<br />
with<br />
related<br />
parties<br />
Balances<br />
of which<br />
non<br />
recurring<br />
of which<br />
with<br />
related<br />
parties<br />
Revenue 100,0% - (0,0%) 100,0% - 0,0%<br />
Cost of sales 100,0% 3,3% 0,4% 100,0% 1,5% 0,8%<br />
Selling and distribution expenses 100,0% 1,7% 0,0% 100,0% - 0,2%<br />
General and administrative expenses 100,0% 0,0% 0,0% 100,0% 0,2% 1,2%<br />
Other income - - - - - -<br />
Other expenses - - - - - -<br />
Operating profit 100,0% - - 100,0% - -<br />
Net financial expenses 100,0% - - 100,0% - -<br />
Share of profit (losses) of associates - - - -<br />
Profit before tax 100,0% - - 100,0%<br />
Income tax expenses 100,0% (531,5%) n.a. 100,0% (19,3%) n.a.<br />
Profit (loss) for the period 100,0% - - 100,0% - -<br />
(1) Tax effects calculated referring to tax rate of the countries in which the operations took place.<br />
53
<strong>Half</strong>-year report at 30 June <strong>2009</strong><br />
Attachment 4. Consolidated balance sheet at 30 June <strong>2009</strong>, prepared in accordance<br />
with Consob Resolution no. 15519 dated 27 July 2006 and Consob Communication no.<br />
DEM/6064293 dated 28 July 2006<br />
Million Euro and percentage weight over<br />
Consolidated Balance Sheet items<br />
30 June <strong>2009</strong> 30 June 2008<br />
Balances of which<br />
with<br />
related<br />
parties<br />
Weight % Balances of which<br />
with<br />
related<br />
parties<br />
Weight %<br />
Assets<br />
Property, plant and equipment 635,5 3,5 0,1% 747,5 - -<br />
Goodwill and other intangible assets with an<br />
232,0 - - 275,4 - -<br />
indefinite useful life<br />
Other intangible assets with a finite useful life 119,7 - - 102,3 - -<br />
Investments in associates 0,6 - - 0,5 - -<br />
Other non-current assets 31,7 - - 33,5 - -<br />
Deferred tax assets 68,8 - - 36,9 - -<br />
Other non-current financial assets 2,1 - - 13,3 - -<br />
Total non-current assets 1.090,3 1.209,3 - -<br />
Inventories 338,0 - - 457,6 - -<br />
Trade receivables 416,2 1,2 0,3% 649,0 0,4 0,1%<br />
Current financial assets 27,6 - 0,0% 53,5 - -<br />
Tax receivables 44,2 - - 61,4 - -<br />
Other receivables and current assets 42,7 - - 67,9 - -<br />
Cash and cash equivalents 136,1 - - 152,3 - -<br />
Assets held for sale - - - - - -<br />
Total current assets 1.004,9 1.441,7<br />
Total assets 2.095,2 2.651,0<br />
Equity<br />
Share capital 92,8 - - 92,8 - -<br />
Reserves 176,8 - - 308,4 - -<br />
Retained earnings 151,3 - - 95,8 - -<br />
Profit attributable to the group (22,6) - - 33,7 - -<br />
Equity attributable to the group 398,3 - - 530,7 - -<br />
Minority interests 2,5 - - 2,2 - -<br />
Total equity 400,8 - - 532,9 - -<br />
Liabilities<br />
Medium and long-term interest-bearing loans<br />
392,6 - - 297,8 - -<br />
and borrowings<br />
Employee benefits 67,6 - - 76,9 - -<br />
Provisions for risks and charges 48,4 - - 41,3 - -<br />
Deferred tax liabilities 41,5 - - 53,1 - -<br />
Other non-current liabilities 38,6 - - 52,6 - -<br />
Total non-current liabilities 588,6 - - 521,7 - -<br />
Banks and other financial payables 297,3 - - 513,8 - -<br />
Provisions for risks and charges 64,6 - - 54,2 - -<br />
Trade payables 590,5 2,9 0,5% 856,3 (3,8) (0,4%)<br />
Tax payables 33,5 - - 36,2 - -<br />
Other payables 119,9 0,1 0,1% 136,0 0,1 0,1%<br />
Total current liabilities 1.105,8 1.596,4<br />
Total liabilities 1.694,4 2.118,1<br />
- -<br />
Total equity and liabilities 2.095,2 2.651,0<br />
Milan, 30 July <strong>2009</strong><br />
on behalf of the Board of Directors<br />
The Vice Chairman<br />
Andrea Merloni<br />
54
Attestation in respect of the Company’s condensed half-yearly consolidated<br />
financial statements in accordance with art. 81-ter of Consob Regulation 11971<br />
of 14 May 1999 and subsequent amendments and additions<br />
The Chief Executive Officer Marco Milani and the Manager charged with preparing the<br />
company’s financial reports Andrea Crenna of <strong>Indesit</strong> Company S.p.A, pursuant to the<br />
provisions of Article 154-bis, clauses 3 and 4, of Legislative Decree no. 58 of 1998,<br />
hereby attest to:<br />
the adequacy with respect to the Company structure, and<br />
the effective application,<br />
of the administrative and accounting procedures applied in the preparation of the<br />
Company’s condensed half-yearly consolidated financial statements as of 30 June<br />
<strong>2009</strong>.<br />
The undersigned moreover attest that the condensed half-yearly consolidated<br />
financial statements:<br />
a) have been prepared in accordance with International Financial <strong>Report</strong>ing<br />
Standards, as endorsed by the European Union through Regulation (EC)<br />
1606/2002 of the European Parliament and Counsel, dated 19 July 2002;<br />
b) correspond to the results documented in the books, accounting and other<br />
records;<br />
c) provide a fair and correct representation of the financial conditions, results of<br />
operations and cash flows of the Company and its consolidated subsidiaries as of<br />
30 June <strong>2009</strong>.<br />
The interim management <strong>Report</strong> contains a reliable analysis of the reference to the<br />
important events affecting the Company during the first six month of the current fiscal<br />
year, including the impact of such events on the Company’s condensed half-yearly<br />
consolidated financial statements and a description of the principal risks and<br />
uncertainties for the remaining six months of the year along with a description of<br />
material related party transactions.<br />
30 July <strong>2009</strong><br />
The Chief Executive Officer<br />
Marco Milani<br />
The manager charged with preparing<br />
the company’s financial reports<br />
Andrea Crenna
www.indesitcompany.com