<strong>Half</strong>-year report at 30 June <strong>2009</strong> Consolidated statement of comprehensive income for the first half of <strong>2009</strong> (million Euro) Note 30 June <strong>2009</strong> 30 June 2008 Profit (loss) for the period (A) (22,6) 34,1 Gains/(Losses) on cash flow hedges 8.14 (9,9) 1,0 Gains/(Losses) on exchange rate differences on translating 8.14 10,8 (29,4) foreign operations Total Other comprehensive income, net of tax (B) 0,8 (28,4) Total Comprehensive income (A+B) (21,7) 5,7 of which: Attributable to minority interests (0,1) 0,4 Attributable to the group (21,6) 5,3 21
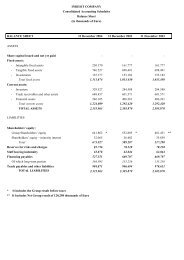
<strong>Half</strong>-year report at 30 June <strong>2009</strong> Consolidated balance sheet at 30 June <strong>2009</strong> 2 (million Euro) Note 30 June <strong>2009</strong> 31 December 2008 30 June 2008 Assets Property, plant and equipment 8.8 635,5 692,8 747,5 Goodwill and other intangible assets with an indefinite useful life 8.9 232,0 207,7 275,4 Other intangible assets with a finite useful life 8.10 119,7 123,9 102,3 Investments in associates 0,6 0,5 0,5 Other non-current assets 31,7 33,9 33,5 Deferred tax assets 68,8 54,6 36,9 Other non-current financial assets 8.15.5 2,1 9,3 13,3 Total non-current assets 1.090,3 1.122,8 1.209,3 Inventories 8.11 338,0 374,1 457,6 Trade receivables 8.12 416,2 459,0 649,0 Current financial assets 8.15.1 27,6 43,8 53,5 Tax receivables 44,2 44,1 61,4 Other receivables and current assets 8.13 42,7 63,6 67,9 Cash and cash equivalents 8.15.2 136,1 193,2 152,3 Total current assets 1.004,9 1.177,7 1.441,7 Total assets 2.095,2 2.300,5 2.651,0 Equity Share capital 92,8 92,8 92,8 Reserves 176,8 176,0 308,4 Retained earnings 151,3 95,8 95,8 Profit attributable to the group (22,6) 55,5 33,7 Equity attributable to the group 8.14 398,3 420,0 530,7 Minority interests 2,5 2,5 2,2 Total equity 400,8 422,6 532,9 Liabilities Medium and long-term interest-bearing loans and borrowings 8.15.4 392,6 451,9 297,8 Employee benefits 8.16 67,6 66,3 76,9 Provisions for risks and charges 8.17 48,4 43,3 41,3 Deferred tax liabilities 41,5 46,0 53,1 Other non-current liabilities 8.18 38,6 42,3 52,6 Total non-current liabilities 588,6 649,8 521,7 Banks and other financial payables 8.15.3 297,3 268,2 513,8 Provisions for risks and charges 8.17 64,6 51,9 54,2 Trade payables 590,5 767,9 856,3 Tax payables 33,5 34,6 36,2 Other payables 8.19 119,9 105,5 136,0 Total current liabilities 1.105,8 1.228,1 1.596,4 Total liabilities 1.694,4 1.878,0 2.118,1 Total equity and liabilities 2.095,2 2.300,5 2.651,0 2 Pursuant to Consob Resolution no. 15519 dated 27 July 2006, the effects of related-party transactions on the consolidated balance sheet are reported in Attachment 4 and in note 10. The effects of non-recurring transactions on the balance sheet and financial position are described in note 8.5. 22