2009 1st Half Report - Indesit
2009 1st Half Report - Indesit
2009 1st Half Report - Indesit

You also want an ePaper? Increase the reach of your titles
YUMPU automatically turns print PDFs into web optimized ePapers that Google loves.
<strong>Half</strong>-year report at 30 June <strong>2009</strong><br />
locally during the first half), the improvement in the price/mix and the actions taken to contain<br />
overheads. Even under these circumstances, the profitability percentage achieved by the<br />
Russia Area is still among the best in the Group.<br />
140,0<br />
120,0<br />
140,3<br />
Russian Fed. Area<br />
Revenue (million Euro)<br />
133,8<br />
90,0<br />
80,0<br />
70,0<br />
60,0<br />
Russian Fed. Area<br />
Operating Margin (million Euro)<br />
100,0<br />
80,0<br />
90,8<br />
2008<br />
<strong>2009</strong><br />
50,0<br />
40,0<br />
30,0<br />
30,0 28,0<br />
2008<br />
<strong>2009</strong><br />
60,0<br />
61,7<br />
20,0<br />
10,0<br />
13,0<br />
4,6<br />
40,0<br />
-<br />
Q1<br />
Q2<br />
Q1<br />
Q2<br />
East Europe Area<br />
(million Euro) 30 June <strong>2009</strong> 30 June 2008 Change<br />
Revenue 160,7 233,8 (73,1)<br />
Operating Margin -0,7 14,9 (15,6)<br />
Operating Margin % -0,4% 6,4% (6,8%)<br />
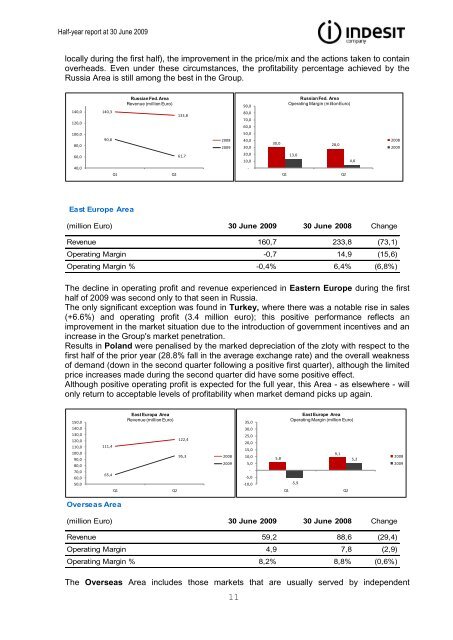
The decline in operating profit and revenue experienced in Eastern Europe during the first<br />
half of <strong>2009</strong> was second only to that seen in Russia.<br />
The only significant exception was found in Turkey, where there was a notable rise in sales<br />
(+6.6%) and operating profit (3.4 million euro); this positive performance reflects an<br />
improvement in the market situation due to the introduction of government incentives and an<br />
increase in the Group's market penetration.<br />
Results in Poland were penalised by the marked depreciation of the zloty with respect to the<br />
first half of the prior year (28.8% fall in the average exchange rate) and the overall weakness<br />
of demand (down in the second quarter following a positive first quarter), although the limited<br />
price increases made during the second quarter did have some positive effect.<br />
Although positive operating profit is expected for the full year, this Area - as elsewhere - will<br />
only return to acceptable levels of profitability when market demand picks up again.<br />
150,0<br />
140,0<br />
130,0<br />
120,0<br />
110,0<br />
100,0<br />
90,0<br />
80,0<br />
70,0<br />
60,0<br />
50,0<br />
111,4<br />
65,4<br />
Q1<br />
East Europa Area<br />
Revenue (million Euro)<br />
Q2<br />
122,4<br />
95,3<br />
2008<br />
<strong>2009</strong><br />
35,0<br />
30,0<br />
25,0<br />
20,0<br />
15,0<br />
10,0<br />
5,0<br />
-<br />
-5,0<br />
-10,0<br />
5,8<br />
Q1<br />
East Europe Area<br />
Operating Margin (million Euro)<br />
-5,9<br />
9,1<br />
Q2<br />
5,2<br />
2008<br />
<strong>2009</strong><br />
Overseas Area<br />
(million Euro) 30 June <strong>2009</strong> 30 June 2008 Change<br />
Revenue 59,2 88,6 (29,4)<br />
Operating Margin 4,9 7,8 (2,9)<br />
Operating Margin % 8,2% 8,8% (0,6%)<br />
The Overseas Area includes those markets that are usually served by independent<br />
11