2009 1st Half Report - Indesit
2009 1st Half Report - Indesit
2009 1st Half Report - Indesit

You also want an ePaper? Increase the reach of your titles
YUMPU automatically turns print PDFs into web optimized ePapers that Google loves.
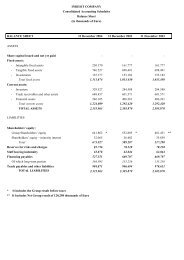
<strong>Half</strong>-year report at 30 June <strong>2009</strong><br />
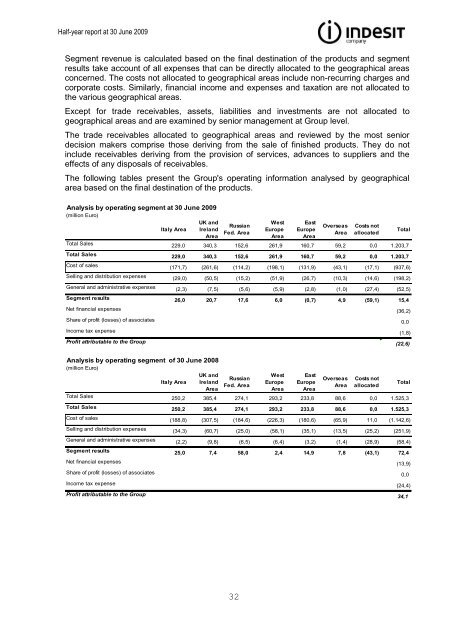
Segment revenue is calculated based on the final destination of the products and segment<br />
results take account of all expenses that can be directly allocated to the geographical areas<br />
concerned. The costs not allocated to geographical areas include non-recurring charges and<br />
corporate costs. Similarly, financial income and expenses and taxation are not allocated to<br />
the various geographical areas.<br />
Except for trade receivables, assets, liabilities and investments are not allocated to<br />
geographical areas and are examined by senior management at Group level.<br />
The trade receivables allocated to geographical areas and reviewed by the most senior<br />
decision makers comprise those deriving from the sale of finished products. They do not<br />
include receivables deriving from the provision of services, advances to suppliers and the<br />
effects of any disposals of receivables.<br />
The following tables present the Group's operating information analysed by geographical<br />
area based on the final destination of the products.<br />
Analysis by operating segment at 30 June <strong>2009</strong><br />
(million Euro)<br />
UK and<br />
West East<br />
Russian<br />
Overseas Costs not<br />
Italy Area Ireland<br />
Europe Europe<br />
Total<br />
Fed. Area<br />
Area allocated<br />
Area<br />
Area Area<br />
Total Sales 229,0 340,3 152,6 261,9 160,7 59,2 0,0 1.203,7<br />
Total Sales 229,0 340,3 152,6 261,9 160,7 59,2 0,0 1.203,7<br />
Cost of sales (171,7) (261,6) (114,2) (198,1) (131,9) (43,1) (17,1) (937,6)<br />
Selling and distribution expenses (29,0) (50,5) (15,2) (51,9) (26,7) (10,3) (14,6) (198,2)<br />
General and administrative expenses (2,3) (7,5) (5,6) (5,9) (2,8) (1,0) (27,4) (52,5)<br />
Segment results 26,0 20,7 17,6 6,0 (0,7) 4,9 (59,1) 15,4<br />
Net financial expenses 0,0 0,0 0,0 0,0 0,0 0,0 (36,2)<br />
Share of profit (losses) of associates 0,0 0,0 0,0 0,0 0,0 0,0 0,0<br />
Income tax expense 0,0 0,0 (4,6) (0,1) 0,1 0,0 (1,8)<br />
Profit attributable to the Group (22,6)<br />
Analysis by operating segment of 30 June 2008<br />
(million Euro)<br />
UK and<br />
West East<br />
Russian<br />
Overseas Costs not<br />
Italy Area Ireland<br />
Europe Europe<br />
Total<br />
Fed. Area<br />
Area allocated<br />
Area<br />
Area Area<br />
Total Sales 250,2 385,4 274,1 293,2 233,8 88,6 0,0 1.525,3<br />
Total Sales 250,2 385,4 274,1 293,2 233,8 88,6 0,0 1.525,3<br />
Cost of sales (188,8) (307,5) (184,6) (226,3) (180,6) (65,9) 11,0 (1.142,6)<br />
Selling and distribution expenses (34,3) (60,7) (25,0) (58,1) (35,1) (13,5) (25,2) (251,9)<br />
General and administrative expenses (2,2) (9,8) (6,5) (6,4) (3,2) (1,4) (28,9) (58,4)<br />
Segment results 25,0 7,4 58,0 2,4 14,9 7,8 (43,1) 72,4<br />
Net financial expenses 0,0 0,0 0,0 0,0 0,0 0,0 (13,9)<br />
Share of profit (losses) of associates 0,0 0,0 0,0 0,0 0,0 0,0 0,0<br />
Income tax expense 0,0 0,0 (14,9) (0,1) (0,2) 0,0 (24,4)<br />
Profit attributable to the Group 34,1<br />
32