2009 1st Half Report - Indesit
2009 1st Half Report - Indesit
2009 1st Half Report - Indesit

Create successful ePaper yourself
Turn your PDF publications into a flip-book with our unique Google optimized e-Paper software.
<strong>Half</strong>-year report at 30 June <strong>2009</strong><br />
<strong>Half</strong>-year report at 30 June <strong>2009</strong><br />
Milan, 30 July <strong>2009</strong><br />
Highlights<br />
Revenue of 1,203.7 million euro (1,525.3 million euro in the first<br />
half of 2008).<br />
Revenue down by 15.2% at constant exchange rates; down by<br />
21.1% at current exchange rates.<br />
Contraction of 20.3% in the volume of sales of household<br />
appliances due to the slowdown in demand.<br />
Net non-recurring charges of 34.8 million euro (16.8 million euro<br />
in the first half of 2008), mainly due to the reorganisation of<br />
manufacturing activities.<br />
Operating profit, gross of non-recurring charges of 50.2 million<br />
euro (89.2 million euro in the first half of 2008).<br />
Operating profit at constant exchange rates of 48.4 million euro;<br />
15.4 million euro at current exchange rates.<br />
Average European market share up by 0.5 percentage points<br />
during the first four months of the year.<br />
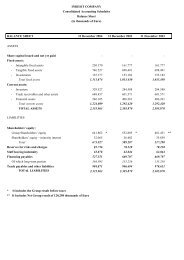
Net working capital of 163.8 million euro (250.3 million euro at 30<br />
June 2008).<br />
Net borrowing of 524.1 million euro (592.5 million euro at 30<br />
June 2008).<br />
Negative free cash flow of 50.2 million euro (negative by 261.3<br />
million euro in the first half of 2008).<br />
Contents<br />
Highlights 2<br />
Company bodies 3<br />
Interim report on operations 4<br />
Condensed half-year consolidated<br />
financial statements 19<br />
Notes 25<br />
Attachments 51<br />
30 june <strong>2009</strong> 30 june 2008 Change<br />
Euro<br />
Euro<br />
Euro<br />
%<br />
%<br />
milion<br />
milion<br />
milion<br />
Revenue 1.203,7 100,0% 1.525,3 100,0% (321,6) (21,1%)<br />
Gross operating profit before non recurring items 110,0 9,1% 149,8 9,8% (39,8) (26,6%)<br />
Gross operating profit 83,0 6,9% 136,8 9,0% (53,8) (39,3%)<br />
Operating profit before non recurring items 50,2 4,2% 89,2 5,9% (39,1) (43,8%)<br />
Operating profit 15,4 1,3% 72,4 4,7% (57,0) (78,8%)<br />
Profit before taxation (20,8) (1,7%) 58,5 3,8% (79,3) (135,5%)<br />
Profit for the period (22,6) (1,9%) 34,1 2,2% (56,7) (166,3%)<br />
Profit attributable to the Group (22,5) (1,9%) 33,7 2,2% (56,2) (166,9%)<br />
II Q <strong>2009</strong> II Q 2008 Change<br />
Euro<br />
Euro<br />
Euro<br />
%<br />
%<br />
milion<br />
milion<br />
milion<br />
Revenue 613,0 100,0% 769,1 100,0% (156,1) (20,3%)<br />
Gross operating profit before non recurring items 62,6 10,2% 73,6 9,6% (11,0) (14,9%)<br />
Gross operating profit 49,3 8,0% 59,5 7,7% (10,3) (17,2%)<br />
Operating profit before non recurring items 32,3 5,3% 44,1 5,7% (11,7) (26,7%)<br />
Operating profit 14,1 2,3% 26,2 3,4% (12,0) (46,0%)<br />
Profit before taxation (4,3) (0,7%) 22,7 2,9% (27,0) (119,0%)<br />
Profit for the period (7,9) (1,3%) 12,6 1,6% (20,5) (162,8%)<br />
Profit attributable to the Group (8,0) (1,3%) 12,1 1,6% (20,1) (165,8%)<br />
%<br />
%<br />
2