2009 1st Half Report - Indesit
2009 1st Half Report - Indesit
2009 1st Half Report - Indesit

You also want an ePaper? Increase the reach of your titles
YUMPU automatically turns print PDFs into web optimized ePapers that Google loves.
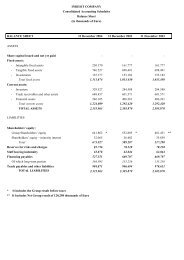
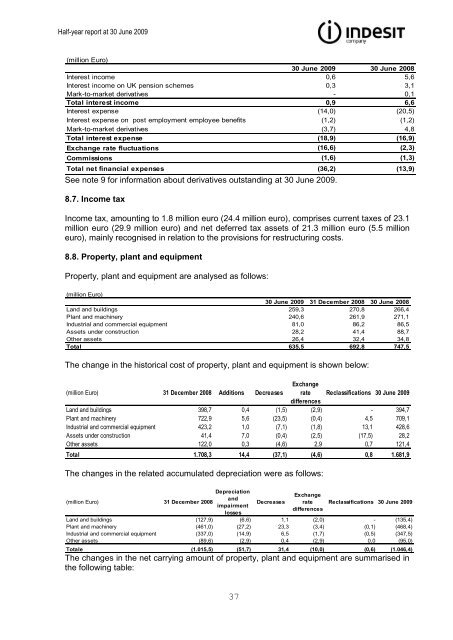
<strong>Half</strong>-year report at 30 June <strong>2009</strong><br />
(million Euro)<br />
30 June <strong>2009</strong> 30 June 2008<br />
Interest income 0,6 5,6<br />
Interest income on UK pension schemes 0,3 3,1<br />
Mark-to-market derivatives - 0,1<br />
Total interest income 0,9 6,6<br />
Interest expense (14,0) (20,5)<br />
Interest expense on post employment employee benefits (1,2) (1,2)<br />
Mark-to-market derivatives (3,7) 4,8<br />
Total interest expense (18,9) (16,9)<br />
Exchange rate fluctuations (16,6) (2,3)<br />
Commissions (1,6) (1,3)<br />
Total net financial expenses (36,2) (13,9)<br />
See note 9 for information about derivatives outstanding at 30 June <strong>2009</strong>.<br />
8.7. Income tax<br />
Income tax, amounting to 1.8 million euro (24.4 million euro), comprises current taxes of 23.1<br />
million euro (29.9 million euro) and net deferred tax assets of 21.3 million euro (5.5 million<br />
euro), mainly recognised in relation to the provisions for restructuring costs.<br />
8.8. Property, plant and equipment<br />
Property, plant and equipment are analysed as follows:<br />
(million Euro)<br />
30 June <strong>2009</strong> 31 December 2008 30 June 2008<br />
Land and buildings 259,3 270,8 266,4<br />
Plant and machinery 240,6 261,9 271,1<br />
Industrial and commercial equipment 81,0 86,2 86,5<br />
Assets under construction 28,2 41,4 88,7<br />
Other assets 26,4 32,4 34,8<br />
Total 635,5 692,8 747,5<br />
The change in the historical cost of property, plant and equipment is shown below:<br />
(million Euro) 31 December 2008 Additions Decreases<br />
Exchange<br />
rate Reclassifications 30 June <strong>2009</strong><br />
differences<br />
Land and buildings 398,7 0,4 (1,5) (2,9) - 394,7<br />
Plant and machinery 722,9 5,6 (23,5) (0,4) 4,5 709,1<br />
Industrial and commercial equipment 423,2 1,0 (7,1) (1,8) 13,1 428,6<br />
Assets under construction 41,4 7,0 (0,4) (2,5) (17,5) 28,2<br />
Other assets 122,0 0,3 (4,6) 2,9 0,7 121,4<br />
Total 1.708,3 14,4 (37,1) (4,6) 0,8 1.681,9<br />
The changes in the related accumulated depreciation were as follows:<br />
(million Euro) 31 December 2008<br />
Depreciation<br />
and<br />
impairment<br />
losses<br />
Decreases<br />
Exchange<br />
rate<br />
differences<br />
Reclassifications 30 June <strong>2009</strong><br />
Land and buildings (127,9) (6,6) 1,1 (2,0) - (135,4)<br />
Plant and machinery (461,0) (27,2) 23,3 (3,4) (0,1) (468,4)<br />
Industrial and commercial equipment (337,0) (14,9) 6,5 (1,7) (0,5) (347,5)<br />
Other assets (89,6) (2,9) 0,4 (2,9) 0,0 (95,0)<br />
Totale (1.015,5) (51,7) 31,4 (10,0) (0,6) (1.046,4)<br />
The changes in the net carrying amount of property, plant and equipment are summarised in<br />
the following table:<br />
37