2009 1st Half Report - Indesit
2009 1st Half Report - Indesit
2009 1st Half Report - Indesit

You also want an ePaper? Increase the reach of your titles
YUMPU automatically turns print PDFs into web optimized ePapers that Google loves.
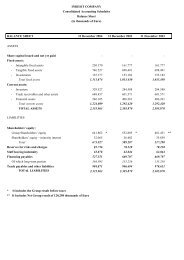
<strong>Half</strong>-year report at 30 June <strong>2009</strong><br />
(million Euro) 31 Dec 2008 Increases Decreases<br />
Exchange<br />
rate<br />
differences<br />
Reclassificat<br />
ions<br />
30 June <strong>2009</strong><br />
Development expenses 81,8 7,0 (13,8) 3,7 6,2 84,9<br />
Licences and software 76,1 1,5 (8,5) 1,1 0,8 70,9<br />
Brands with a finite useful life 18,3 - - 5,4 - 23,7<br />
Intangible assets under development 12,3 1,5 0,2 (2,2) (7,6) 4,3<br />
Other 4,1 0,0 (0,5) (0,2) 0,3 3,6<br />
Total 192,6 10,0 (22,7) 7,8 (0,3)<br />
The changes in the related accumulated amortisation were as follows:<br />
187,4<br />
(million Euro) 31 Dec 2008<br />
Amortization<br />
and<br />
impairment<br />
losses<br />
Decreases<br />
Exchange<br />
Reclassificat<br />
rate<br />
ions<br />
differences<br />
30 June <strong>2009</strong><br />
Development expenses (44,1) (7,6) 13,5 (1,5) 0,6 (39,1)<br />
Licences and software (34,0) (5,6) 8,5 (0,7) - (31,9)<br />
Brands with a finite useful life 8,2 (2,5) (0,0) (4,1) - 1,7<br />
Other 1,2 (0,2) 0,5 0,0 0,0 1,6<br />
Total (68,7) (15,8) 22,6 (6,4) 0,6 (67,7)<br />
The changes in the net carrying amount of other intangible assets with a finite life are<br />
summarised in the following table:<br />
(million Euro) 31 Dec 2008 Increases<br />
Amortization<br />
and<br />
impairment<br />
losses<br />
Decreases<br />
Exchange<br />
rate<br />
differences<br />
Reclassificati<br />
ons<br />
30 June <strong>2009</strong><br />
Development expenses 37,7 7,0 (7,6) (0,3) 2,1 6,8 45,8<br />
Licences and software 42,0 1,5 (5,6) (0,0) 0,4 0,8 39,1<br />
Brands with a finite useful life 26,4 - (2,5) (0,0) 1,2 - 25,3<br />
Intangible assets under development 12,3 1,5 - 0,2 (2,2) (7,6) 4,3<br />
Other 5,1 0,0 (0,2) (0,0) (0,2) 0,3 5,2<br />
Total 123,7 10,0 (15,8) (0,1) 1,4 0,3 119,7<br />
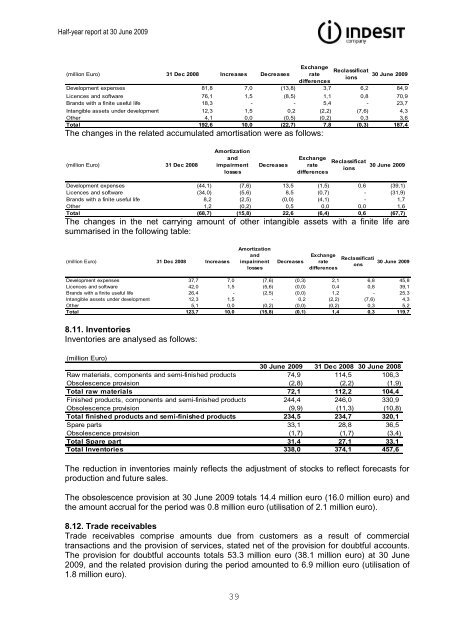
8.11. Inventories<br />
Inventories are analysed as follows:<br />
(million Euro)<br />
30 June <strong>2009</strong> 31 Dec 2008 30 June 2008<br />
Raw materials, components and semi-finished products 74,9 114,5 106,3<br />
Obsolescence provision (2,8) (2,2) (1,9)<br />
Total raw materials 72,1 112,2 104,4<br />
Finished products, components and semi-finished products 244,4 246,0 330,9<br />
Obsolescence provision (9,9) (11,3) (10,8)<br />
Total finished products and semi-finished products 234,5 234,7 320,1<br />
Spare parts 33,1 28,8 36,5<br />
Obsolescence provision (1,7) (1,7) (3,4)<br />
Total Spare part 31,4 27,1 33,1<br />
Total Inventories 338,0 374,1 457,6<br />
The reduction in inventories mainly reflects the adjustment of stocks to reflect forecasts for<br />
production and future sales.<br />
The obsolescence provision at 30 June <strong>2009</strong> totals 14.4 million euro (16.0 million euro) and<br />
the amount accrual for the period was 0.8 million euro (utilisation of 2.1 million euro).<br />
8.12. Trade receivables<br />
Trade receivables comprise amounts due from customers as a result of commercial<br />
transactions and the provision of services, stated net of the provision for doubtful accounts.<br />
The provision for doubtful accounts totals 53.3 million euro (38.1 million euro) at 30 June<br />
<strong>2009</strong>, and the related provision during the period amounted to 6.9 million euro (utilisation of<br />
1.8 million euro).<br />
39