people living in finglas and their health - School of Medicine - Trinity ...
people living in finglas and their health - School of Medicine - Trinity ...
people living in finglas and their health - School of Medicine - Trinity ...

You also want an ePaper? Increase the reach of your titles
YUMPU automatically turns print PDFs into web optimized ePapers that Google loves.
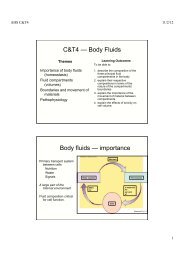
METHODS - PART 1<br />
METHODS - PART 1<br />
2.2 SAMPLING<br />
The estimated sample size was 420 households based on the proportion <strong>of</strong> <strong>in</strong>dividuals report<strong>in</strong>g chronic illness<br />
(22%) <strong>in</strong> a survey carried out <strong>in</strong> Tallaght <strong>in</strong> June 2001. 3 The sample was selected us<strong>in</strong>g a sampl<strong>in</strong>g methodology<br />
validated by the World Health Organization 4 <strong>and</strong> adapted by the Primary Health Care Management<br />
Advancement Programme for assess<strong>in</strong>g community <strong>health</strong> needs <strong>and</strong> <strong>health</strong> service coverage. 5 In this<br />
methodology cluster sampl<strong>in</strong>g rather than r<strong>and</strong>om sampl<strong>in</strong>g was employed, <strong>and</strong> for the F<strong>in</strong>glas survey 30<br />
clusters <strong>of</strong> seven households were selected from each <strong>of</strong> the low <strong>and</strong> high deprivation areas, giv<strong>in</strong>g the required<br />
number <strong>of</strong> 420 houses.<br />
Mr James Williams, Head <strong>of</strong> the Survey Unit at the Economic <strong>and</strong> Social Research Institute, supplied the<br />
sample. Williams (personal communication) reported that accord<strong>in</strong>g to the electoral register there were a total<br />
<strong>of</strong> 7,208 houses <strong>in</strong> the high deprivation group <strong>of</strong> district electoral divisions <strong>and</strong> 4,063 <strong>in</strong> the low deprivation<br />
group <strong>of</strong> district electoral divisions. The 12 district electoral divisions <strong>in</strong> the survey area were then partitioned<br />
<strong>in</strong>to 1,610 clusters, each <strong>of</strong> seven households. A systematic sample <strong>of</strong> clusters, proportional to the number <strong>of</strong><br />
households <strong>in</strong> each contribut<strong>in</strong>g district electoral division, was then selected; 30 clusters from the high<br />
deprivation group <strong>of</strong> district electoral divisions <strong>and</strong> 30 clusters from the low deprivation group <strong>of</strong> district electoral<br />
divisions. Each cluster consisted <strong>of</strong> seven adjacent houses (Appendix 1). This led to an <strong>in</strong>tentional over<br />
representation <strong>of</strong> the population <strong>liv<strong>in</strong>g</strong> <strong>in</strong> less deprived areas <strong>and</strong> the proportions for each <strong>of</strong> the key outcomes<br />
have been adjusted to take account <strong>of</strong> this sampl<strong>in</strong>g bias.<br />
Variation <strong>in</strong> the number <strong>of</strong> households listed <strong>in</strong> each district electoral division (Table 2.1) versus numbers <strong>of</strong><br />
households reported <strong>in</strong> the census arises due to under-registration <strong>of</strong> households (James Williams, personal<br />
communication 2002). The Department <strong>of</strong> the Environment has reported that 10% <strong>of</strong> households on the<br />
electoral register are not listed or else not occupied by the person named on the electoral register as a result<br />
<strong>of</strong> death or migration.<br />
The researcher adjusted each cluster <strong>of</strong> seven adjacent houses <strong>and</strong> <strong>in</strong>serted those houses miss<strong>in</strong>g from the<br />
numerical sequence (<strong>in</strong> order to <strong>in</strong>clude those not on the electoral register). The researcher then removed from<br />
the end <strong>of</strong> the sequence the number <strong>of</strong> households <strong>in</strong> excess <strong>of</strong> seven. This was done <strong>in</strong> order to ensure a<br />
representative sample <strong>of</strong> the population actually <strong>liv<strong>in</strong>g</strong> <strong>in</strong> F<strong>in</strong>glas rather than the population <strong>liv<strong>in</strong>g</strong> <strong>in</strong> F<strong>in</strong>glas<br />
accord<strong>in</strong>g to the electoral register. Of the 420 houses <strong>in</strong> the Economic <strong>and</strong> Social Research Institute sample,<br />
12 (2.8%) households were miss<strong>in</strong>g from the electoral register <strong>and</strong> were therefore placed <strong>in</strong> <strong>their</strong> numerical<br />
sequence <strong>in</strong> <strong>their</strong> respective clusters as described above.<br />
2.3 FIELDWORK<br />
Prior to the fieldwork local <strong>health</strong> care providers <strong>in</strong> the Northern Area Health Board <strong>and</strong> the general practitioners<br />
<strong>in</strong> the F<strong>in</strong>glas area were <strong>in</strong>formed <strong>of</strong> the survey. Posters were designed for display at the two <strong>health</strong> centres <strong>and</strong><br />
five general practices <strong>in</strong> F<strong>in</strong>glas (Appendix 2a). An article was placed <strong>in</strong> the local newspaper to <strong>in</strong>form the<br />
community about the survey. In March 2002, each <strong>of</strong> the 420 selected households was sent a letter signed by<br />
the General Manager <strong>of</strong> Community Care Area 6, <strong>in</strong> the Northern Area Health Board <strong>and</strong> the Pr<strong>of</strong>essor <strong>of</strong><br />
General Practice at the Department <strong>of</strong> Community Health <strong>and</strong> General Practice (Appendix 2b).<br />
People <strong>liv<strong>in</strong>g</strong> <strong>in</strong> the area were <strong>in</strong>vited to participate as data collectors for the household survey. Those <strong>people</strong><br />
who expressed an <strong>in</strong>terest attended a tra<strong>in</strong><strong>in</strong>g programme prior to the survey. Each <strong>in</strong>terviewer was given a<br />
survey pack which <strong>in</strong>cluded; formal identification, a map <strong>of</strong> the survey area (<strong>in</strong>corporat<strong>in</strong>g selected clusters), a<br />
list <strong>of</strong> the sample households, additional copies <strong>of</strong> the household letters, call back slips for no access visits <strong>and</strong><br />
an <strong>in</strong>formation sheet for the data collectors (Appendices 2 <strong>and</strong> 3).<br />
The data collection commenced <strong>in</strong> mid March <strong>and</strong> data were collected each even<strong>in</strong>g between 6 <strong>and</strong> 9 pm unless<br />
otherwise requested by the respondents (Appendices 2 <strong>and</strong> 4). The questionnaire used for the survey was<br />
similar to that used <strong>in</strong> two previous <strong>health</strong> needs assessments. 3 6 The questionnaire was adm<strong>in</strong>istered by the<br />
<strong>in</strong>terviewers to the primary carer (def<strong>in</strong>ed as the person <strong>in</strong> the household who manages the welfare <strong>and</strong> <strong>health</strong><br />
<strong>of</strong> the family/household) <strong>in</strong> each <strong>of</strong> the participat<strong>in</strong>g households. Flashcards were used to assist respondents<br />
identify the scale <strong>of</strong> an experience, identify the name <strong>of</strong> chronic illness <strong>and</strong> as a prompt for <strong>health</strong> services s/he<br />
may have used.<br />
When a household was not accessed, a note was left with a date for a return visit <strong>and</strong> a contact telephone<br />
number. Households were then revisited <strong>in</strong> the afternoons or even<strong>in</strong>gs, until access was ga<strong>in</strong>ed or up to a<br />
maximum <strong>of</strong> four return visits. Data collection was completed on 26th April 2002.<br />
2.4 DATA COLLECTION INSTRUMENT<br />
Prior to data collection dur<strong>in</strong>g the months <strong>of</strong> January <strong>and</strong> February 2002 the researcher met with key <strong>in</strong>dividuals<br />
with<strong>in</strong> the F<strong>in</strong>glas community <strong>and</strong> <strong>in</strong>formed them about the survey <strong>and</strong> elicited <strong>their</strong> perceived needs. Several<br />
<strong>health</strong> <strong>and</strong> social service needs were identified, many <strong>of</strong> which refer to specific groups with<strong>in</strong> the population,<br />
such as, the elderly, adults <strong>and</strong> teenagers.<br />
The needs for the elderly were:<br />
• Increased personal security both with<strong>in</strong> <strong>and</strong> outside <strong>their</strong> home <strong>in</strong>clud<strong>in</strong>g personal alarms,<br />
• A re-<strong>in</strong>stitution <strong>of</strong> meals on wheels on a daily basis,<br />
• Assistance with both house <strong>and</strong> garden ma<strong>in</strong>tenance,<br />
• Improved public transport l<strong>in</strong>k<strong>in</strong>g specific areas.<br />
16<br />
17