people living in finglas and their health - School of Medicine - Trinity ...
people living in finglas and their health - School of Medicine - Trinity ...
people living in finglas and their health - School of Medicine - Trinity ...

You also want an ePaper? Increase the reach of your titles
YUMPU automatically turns print PDFs into web optimized ePapers that Google loves.
RESULTS - PART 1<br />
RESULTS - PART 1<br />
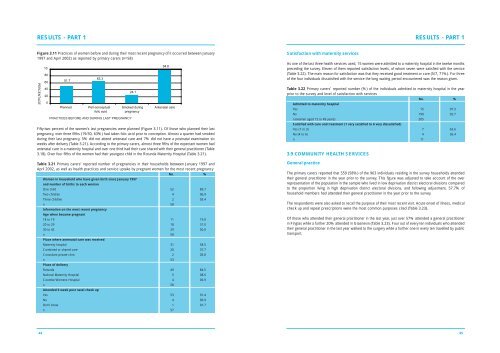
Figure 3.11 Practices <strong>of</strong> women before <strong>and</strong> dur<strong>in</strong>g <strong>their</strong> most recent pregnancy (if it occurred between January<br />
1997 <strong>and</strong> April 2002) as reported by primary carers (n=58)<br />
PERCENTAGE<br />
10<br />
80<br />
60<br />
40<br />
20<br />
0<br />
51.7<br />
Planned<br />
63.3<br />
Peri-conceptual<br />
folic acid<br />
PRACTICES BEFORE AND DURING LAST PREGNANCY<br />
Fifty-two percent <strong>of</strong> the women’s last pregnancies were planned (Figure 3.11). Of those who planned <strong>their</strong> last<br />
pregnancy, over three fifths (19/30, 63%) had taken folic acid prior to conception. Almost a quarter had smoked<br />
dur<strong>in</strong>g <strong>their</strong> last pregnancy, 5% did not attend antenatal care <strong>and</strong> 7% did not have a postnatal exam<strong>in</strong>ation six<br />
weeks after delivery (Table 3.21). Accord<strong>in</strong>g to the primary carers, almost three fifths <strong>of</strong> the expectant women had<br />
antenatal care <strong>in</strong> a maternity hospital <strong>and</strong> over one third had <strong>their</strong> care shared with <strong>their</strong> general practitioner (Table<br />
3.18). Over four fifths <strong>of</strong> the women had <strong>their</strong> youngest child <strong>in</strong> the Rotunda Maternity Hospital (Table 3.21).<br />
Table 3.21 Primary carers’ reported number <strong>of</strong> pregnancies <strong>in</strong> <strong>their</strong> households between January 1997 <strong>and</strong><br />
April 2002, as well as <strong>health</strong> practices <strong>and</strong> service uptake by pregnant women for the most recent pregnancy<br />
No. %<br />
Women <strong>in</strong> household who have given birth s<strong>in</strong>ce January 1997<br />
<strong>and</strong> number <strong>of</strong> births to each woman<br />
One child 52 89.7<br />
Two children 4 06.9<br />
Three children 2 03.4<br />
n 58<br />
Information on the most recent pregnancy<br />
Age when became pregnant<br />
18 to 19 11 19.0<br />
20 to 29 18 31.0<br />
30 to 42 29 50.0<br />
n 58<br />
Place where antenatal care was received<br />
Maternity hospital 31 58.5<br />
Comb<strong>in</strong>ed or shared care 20 37.7<br />
Consultant private cl<strong>in</strong>ic 2 03.8<br />
n 53<br />
Place <strong>of</strong> delivery<br />
Rotunda 49 84.5<br />
National Maternity Hospital 5 08.6<br />
Coombe Womens Hospital 4 06.9<br />
n 58<br />
Attended 6 week post natal check up<br />
Yes 53 91.4<br />
No 4 06.9<br />
Don’t know 1 01.7<br />
n 57<br />
24.1<br />
Smoked dur<strong>in</strong>g<br />
pregnancy<br />
94.8<br />
Antenatal care<br />
Satisfaction with maternity services<br />
As one <strong>of</strong> the last three <strong>health</strong> services used, 15 women were admitted to a maternity hospital <strong>in</strong> the twelve months<br />
preced<strong>in</strong>g the survey. Eleven <strong>of</strong> them reported satisfaction levels, <strong>of</strong> whom seven were satisfied with the service<br />
(Table 3.22). The ma<strong>in</strong> reason for satisfaction was that they received good treatment or care (5/7, 71%). For three<br />
<strong>of</strong> the four <strong>in</strong>dividuals dissatisfied with the service the long wait<strong>in</strong>g period encountered was the reason given.<br />
Table 3.22 Primary carers’ reported number (%) <strong>of</strong> the <strong>in</strong>dividuals admitted to maternity hospital <strong>in</strong> the year<br />
prior to the survey <strong>and</strong> level <strong>of</strong> satisfaction with services<br />
No. %<br />
Admitted to maternity hospital<br />
Yes 15 07.3<br />
No 190 92.7<br />
n (women aged 15 to 49 years) 205<br />
Satisfied with care <strong>and</strong> treatment (1 very satisfied to 6 very dissatisfied)<br />
Yes (1 to 3) 7 63.6<br />
No (4 to 6) 4 36.4<br />
n 11<br />
3.9 COMMUNITY HEALTH SERVICES<br />
General practice<br />
The primary carers reported that 559 (58%) <strong>of</strong> the 963 <strong>in</strong>dividuals resid<strong>in</strong>g <strong>in</strong> the survey households attended<br />
<strong>their</strong> general practitioner <strong>in</strong> the year prior to the survey. This figure was adjusted to take account <strong>of</strong> the over<br />
representation <strong>of</strong> the population <strong>in</strong> the sample who lived <strong>in</strong> low deprivation district electoral divisions compared<br />
to the proportion <strong>liv<strong>in</strong>g</strong> <strong>in</strong> high deprivation district electoral divisions, <strong>and</strong> follow<strong>in</strong>g adjustment, 57.7% <strong>of</strong><br />
household members had attended <strong>their</strong> general practitioner <strong>in</strong> the year prior to the survey.<br />
The respondents were also asked to recall the purpose <strong>of</strong> <strong>their</strong> most recent visit. Acute onset <strong>of</strong> illness, medical<br />
check up <strong>and</strong> repeat prescriptions were the most common purposes cited (Table 3.23).<br />
Of those who attended <strong>their</strong> general practitioner <strong>in</strong> the last year, just over 57% attended a general practitioner<br />
<strong>in</strong> F<strong>in</strong>glas while a further 20% attended <strong>in</strong> Glasnev<strong>in</strong> (Table 3.23). Four out <strong>of</strong> every ten <strong>in</strong>dividuals who attended<br />
<strong>their</strong> general practitioner <strong>in</strong> the last year walked to the surgery while a further one <strong>in</strong> every ten travelled by public<br />
transport.<br />
44<br />
45