people living in finglas and their health - School of Medicine - Trinity ...
people living in finglas and their health - School of Medicine - Trinity ...
people living in finglas and their health - School of Medicine - Trinity ...

Create successful ePaper yourself
Turn your PDF publications into a flip-book with our unique Google optimized e-Paper software.
RESULTS - PART 1<br />
RESULTS - PART 1<br />
Primary carers were asked what service they would access when seek<strong>in</strong>g a doctor after hours (Table 3.25).<br />
Sixty two percent would contact <strong>their</strong> general practitioner practice <strong>and</strong> 12% said they would go straight to the<br />
accident <strong>and</strong> emergency department. When primary carers were asked about satisfaction with current ‘out <strong>of</strong><br />
hours’ general practitioner service, 16% said that they were unhappy with the service <strong>and</strong> 49% did not know<br />
whether or not they were satisfied or dissatisfied with the service.<br />
Table 3.25 Primary carers’ reported use <strong>of</strong> <strong>and</strong> satisfaction with ‘out <strong>of</strong> hours’ medical services<br />
No. %<br />
Services used for doctor out <strong>of</strong> hours<br />
Call GP practice 200 61.7<br />
Go to hospital accident <strong>and</strong> emergency 40 12.3<br />
Depends on situation 30 9.3<br />
Never had to use the service 54 16.1<br />
n 324<br />
Satisfied with choice <strong>of</strong> out <strong>of</strong> hours service<br />
Yes 113 35.0<br />
No 52 16.1<br />
Do not know 158 48.9<br />
n 323<br />
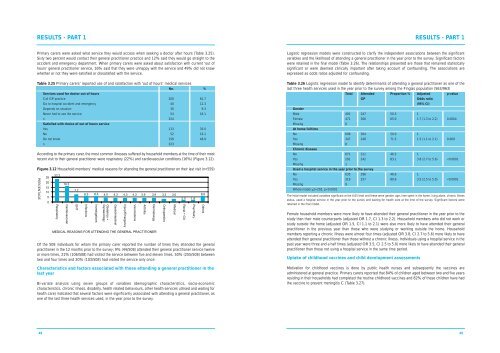
Accord<strong>in</strong>g to the primary carer, the most common illnesses suffered by household members at the time <strong>of</strong> <strong>their</strong> most<br />
recent visit to <strong>their</strong> general practitioner were respiratory (22%) <strong>and</strong> cardiovascular conditions (16%) (Figure 3.12).<br />
Figure 3.12 Household members’ medical reasons for attend<strong>in</strong>g the general practitioner on <strong>their</strong> last visit (n=559)<br />
PERCENTAGE<br />
25<br />
20<br />
15<br />
10<br />
5<br />
0<br />
22.2<br />
Respiratory<br />
16.3<br />
Cardiovascular<br />
7.7<br />
ENT<br />
6.3 6.3 4.5 4.3 4.3 4.3 3.9 3.9 3.2 3.0<br />
Infections<br />
Investigations<br />
Obstetrics +<br />
Gynaecology<br />
MEDICAL REASONS FOR ATTENDING THE GENERAL PRACTITIONER<br />
GastroIntest<strong>in</strong>al<br />
Injury/Emergency<br />
2.0 1.8<br />
Of the 508 <strong>in</strong>dividuals for whom the primary carer reported the number <strong>of</strong> times they attended the general<br />
practitioner <strong>in</strong> the 12 months prior to the survey; 9% (44/508) attended <strong>their</strong> general practitioner service twelve<br />
or more times, 21% (106/508) had visited the service between five <strong>and</strong> eleven times, 50% (255/508) between<br />
two <strong>and</strong> four times <strong>and</strong> 20% (103/508) had visited the service only once.<br />
Characteristics <strong>and</strong> factors associated with those attend<strong>in</strong>g a general practitioner <strong>in</strong> the<br />
last year<br />
Bi-variate analysis us<strong>in</strong>g seven groups <strong>of</strong> variables (demographic characteristics, socio-economic<br />
characteristics, chronic illness, disability, <strong>health</strong> related behaviours, other <strong>health</strong> services utilised <strong>and</strong> wait<strong>in</strong>g for<br />
<strong>health</strong> care) <strong>in</strong>dicated that several factors were significantly associated with attend<strong>in</strong>g a general practitioner, as<br />
one <strong>of</strong> the last three <strong>health</strong> services used, <strong>in</strong> the year prior to the survey.<br />
Vacc<strong>in</strong>ations<br />
Arthritis<br />
Dermatology<br />
Orthopaedics<br />
Medical<br />
Renal + GU<br />
Psychiatry<br />
6.0<br />
Others<br />
Logistic regression models were constructed to clarify the <strong>in</strong>dependent associations between the significant<br />
variables <strong>and</strong> the likelihood <strong>of</strong> attend<strong>in</strong>g a general practitioner <strong>in</strong> the year prior to the survey. Significant factors<br />
were reta<strong>in</strong>ed <strong>in</strong> the f<strong>in</strong>al model (Table 3.26). The relationships presented are those that rema<strong>in</strong>ed statistically<br />
significant or were deemed cl<strong>in</strong>ically important after tak<strong>in</strong>g account <strong>of</strong> confound<strong>in</strong>g. The associations are<br />
expressed as odds ratios adjusted for confound<strong>in</strong>g.<br />
Table 3.26 Logistic regression model to identify determ<strong>in</strong>ants <strong>of</strong> attend<strong>in</strong>g a general practitioner as one <strong>of</strong> the<br />
last three <strong>health</strong> services used <strong>in</strong> the year prior to the survey among the F<strong>in</strong>glas population (563/963)<br />
Total Attended Proportion % Adjusted p-value<br />
GP<br />
Odds ratio<br />
(95% CI)<br />
Gender<br />
Male 491 247 50.3 1<br />
Female 471 306 65.0 1.7 (1.3 to 2.2) 0.0004<br />
Miss<strong>in</strong>g 0<br />
At home fulltime<br />
No 608 304 50.0 1<br />
Yes 347 248 71.5 1.5 (1.1 to 2.1) 0.009<br />
Miss<strong>in</strong>g 8<br />
Chronic disease<br />
No 671 311 46.3 1<br />
Yes 291 242 83.1 3.8 (2.7 to 5.6)