people living in finglas and their health - School of Medicine - Trinity ...
people living in finglas and their health - School of Medicine - Trinity ...
people living in finglas and their health - School of Medicine - Trinity ...

Create successful ePaper yourself
Turn your PDF publications into a flip-book with our unique Google optimized e-Paper software.
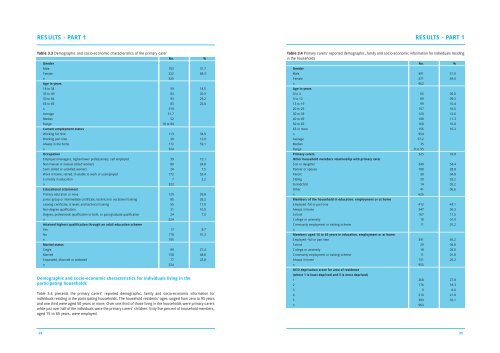
RESULTS - PART 1<br />
RESULTS - PART 1<br />
Table 3.3 Demographic <strong>and</strong> socio-economic characteristics <strong>of</strong> the primary carer<br />
No. %<br />
Gender<br />
Male 103 31.7<br />
Female 222 68.3<br />
n 325<br />
Age <strong>in</strong> years<br />
18 to 34 59 18.5<br />
35 to 49 84 26.3<br />
50 to 64 93 29.2<br />
65 to 85 83 26.0<br />
n 319<br />
Average 51.7<br />
Median 52<br />
Range 18 to 84<br />
Current employment status<br />
Work<strong>in</strong>g full time 113 34.9<br />
Work<strong>in</strong>g part time 39 12.0<br />
Always <strong>in</strong> the home 172 53.1<br />
n 324<br />
Occupation<br />
Employers/managers, higher/lower pr<strong>of</strong>essionals, self employed 39 12.1<br />
Non manual or manual skilled workers 80 24.8<br />
Semi skilled or unskilled workers 24 7.5<br />
Work <strong>in</strong> home, retired, ill-unable to work or unemployed 172 53.4<br />
Currently <strong>in</strong> education 7 2.2<br />
n 322<br />
Educational atta<strong>in</strong>ment<br />
Primary education or none 129 39.8<br />
Junior group or <strong>in</strong>termediate certificate, technical or vocational tra<strong>in</strong><strong>in</strong>g 85 26.2<br />
Leav<strong>in</strong>g certificate, A levels <strong>and</strong> technical tra<strong>in</strong><strong>in</strong>g 55 17.0<br />
Non degree qualification 31 10.0<br />
Degree, pr<strong>of</strong>essional qualification or both, or post-graduate qualification 24 7.0<br />
n 324<br />
Atta<strong>in</strong>ed highest qualification through an adult education scheme<br />
Yes 17 8.7<br />
No 178 91.3<br />
n 195<br />
Marital status<br />
S<strong>in</strong>gle 89 27.4<br />
Married 158 48.8<br />
Separated, divorced or widowed 77 23.8<br />
n 324<br />
Demographic <strong>and</strong> socio-economic characteristics for <strong>in</strong>dividuals <strong>liv<strong>in</strong>g</strong> <strong>in</strong> the<br />
participat<strong>in</strong>g households<br />
Table 3.4 presents the primary carers’ reported demographic, family <strong>and</strong> socio-economic <strong>in</strong>formation for<br />
<strong>in</strong>dividuals resid<strong>in</strong>g <strong>in</strong> the participat<strong>in</strong>g households. The household residents’ ages ranged from zero to 95 years<br />
<strong>and</strong> one third were aged 50 years or more. Over one third <strong>of</strong> those <strong>liv<strong>in</strong>g</strong> <strong>in</strong> the households were primary carers<br />
while just over half <strong>of</strong> the <strong>in</strong>dividuals were the primary carers’ children. Sixty five percent <strong>of</strong> household members,<br />
aged 15 to 65 years, were employed.<br />
Table 3.4 Primary carers’ reported demographic, family <strong>and</strong> socio-economic <strong>in</strong>formation for <strong>in</strong>dividuals resid<strong>in</strong>g<br />
<strong>in</strong> the households<br />
No. %<br />
Gender<br />
Male 491 51.0<br />
Female 471 49.0<br />
n 962<br />
Age <strong>in</strong> years<br />
0 to 4 65 06.8<br />
5 to 12 89 09.3<br />
13 to 19 99 10.4<br />
20 to 29 157 16.5<br />
30 to 39 120 12.6<br />
40 to 49 108 11.3<br />
50 to 65 160 16.8<br />
65 or more 156 16.3<br />
n 954<br />
Average 37.2<br />
Median 35<br />
Range 0 to 95<br />
Primary carers 325 33.8<br />
Other household members relationship with primary carer<br />
Son or daughter 340 54.4<br />
Partner or spouse 180 28.8<br />
Parent 30 04.8<br />
Sibl<strong>in</strong>g 20 03.2<br />
Gr<strong>and</strong>child 14 02.2<br />
Other 41 06.6<br />
n 625<br />
Members <strong>of</strong> the household <strong>in</strong> education, employment or at home<br />
Employed -full or part time 412 43.1<br />
Always <strong>in</strong> home 347 36.3<br />
<strong>School</strong> 167 17.5<br />
College or university 18 01.9<br />
Community employment or tra<strong>in</strong><strong>in</strong>g scheme 11 01.2<br />
n<br />
Members aged 16 to 65 years <strong>in</strong> education, employment or at home<br />
Employed –full or part time 391 65.2<br />
<strong>School</strong> 29 04.8<br />
College or university 18 03.0<br />
Community employment or tra<strong>in</strong><strong>in</strong>g scheme 11 01.8<br />
Always <strong>in</strong> home 151 25.2<br />
n 955<br />
DED deprivation score for area <strong>of</strong> residence<br />
(where 1 is least deprived <strong>and</strong> 5 is most deprived)<br />
1 268 27.8<br />
2 176 18.3<br />
3 0 0.0<br />
4 210 21.8<br />
5 309 32.1<br />
n 963<br />
24<br />
25