people living in finglas and their health - School of Medicine - Trinity ...
people living in finglas and their health - School of Medicine - Trinity ...
people living in finglas and their health - School of Medicine - Trinity ...

You also want an ePaper? Increase the reach of your titles
YUMPU automatically turns print PDFs into web optimized ePapers that Google loves.
RESULTS - PART 1<br />
RESULTS - PART 1<br />
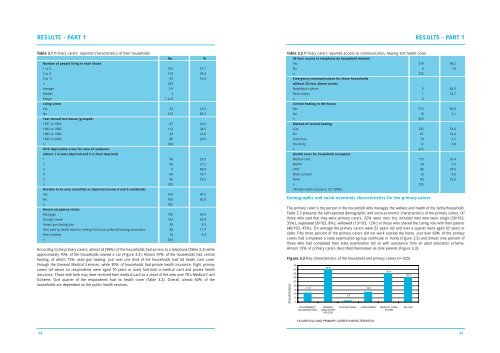
Table 3.1 Primary carers’ reported characteristics <strong>of</strong> <strong>their</strong> households<br />
No. %<br />
Number <strong>of</strong> <strong>people</strong> <strong>liv<strong>in</strong>g</strong> <strong>in</strong> each house<br />
1 to 2 155 47.7<br />
3 to 4 115 35.4<br />
5 to 11 55 16.9<br />
n 325<br />
Average 2.9<br />
Median 3<br />
Range 1 to 8<br />
Liv<strong>in</strong>g alone<br />
Yes 53 16.3<br />
No 272 83.7<br />
Year moved <strong>in</strong>to house (grouped)<br />
1937 to 1962 87 26.9<br />
1963 to 1982 112 34.6<br />
1983 to 1992 39 12.0<br />
1993 to 2002 86 26.5<br />
n 324<br />
DED deprivation score for area <strong>of</strong> residence<br />
(where 1 is least deprived <strong>and</strong> 5 is most deprived)<br />
1 96 29.5<br />
2 69 21.2<br />
3 0 00.0<br />
4 64 19.7<br />
5 96 29.5<br />
n 325<br />
Resides <strong>in</strong> an area classified as deprived (scores 4 <strong>and</strong> 5 comb<strong>in</strong>ed)<br />
Yes 160 49.2<br />
No 165 50.8<br />
n 325<br />
House occupancy status<br />
Mortgage 100 30.9<br />
Outright owner 142 43.8<br />
Tenant purchas<strong>in</strong>g plan 30 9.3<br />
Rent paid by <strong>health</strong> board or rent<strong>in</strong>g from local authority/hous<strong>in</strong>g association 38 11.7<br />
Rent privately 14 4.3<br />
n 324<br />
Accord<strong>in</strong>g to the primary carers, almost all (98%) <strong>of</strong> the households had access to a telephone (Table 3.2) while<br />
approximately 70% <strong>of</strong> the households owned a car (Figure 3.3). Almost 97% <strong>of</strong> the households had central<br />
heat<strong>in</strong>g, <strong>of</strong> which 73% used gas heat<strong>in</strong>g. Just over one third <strong>of</strong> the households had full <strong>health</strong> care cover<br />
through the General Medical Services, while 30% <strong>of</strong> households had private <strong>health</strong> <strong>in</strong>surance. Eight primary<br />
carers (<strong>of</strong> whom six respondents were aged 70 years or over) had both a medical card <strong>and</strong> private <strong>health</strong><br />
<strong>in</strong>surance. Those with both may have received <strong>their</strong> medical card as a result <strong>of</strong> the new over 70’s Medical Card<br />
Scheme. One quarter <strong>of</strong> the respondents had no <strong>health</strong> cover (Table 3.2). Overall, almost 60% <strong>of</strong> the<br />
households are dependent on the public <strong>health</strong> services.<br />
Table 3.2 Primary carers reported access to communication, heat<strong>in</strong>g <strong>and</strong> <strong>health</strong> cover<br />
PERCENTAGE<br />
24 hour access to telephone by household member<br />
Yes 319 98.2<br />
No 6 1.8<br />
n 325<br />
Emergency communications for those households<br />
without 24 hour phone access<br />
Neighbour’s phone 5 83.3<br />
Panic button 1 16.7<br />
n 6<br />
Central heat<strong>in</strong>g <strong>in</strong> the house<br />
Yes 315 96.9<br />
No 10 3.1<br />
n 325<br />
Method <strong>of</strong> central heat<strong>in</strong>g<br />
Gas 232 73.6<br />
Oil 61 19.4<br />
Solid Fuel 10 3.2<br />
Electricity 12 3.8<br />
n 325<br />
Health cover for household occupants<br />
Medical card 115 35.4<br />
BUPA† 18 5.5<br />
VHI† 96 29.5<br />
Other private† 13 4.0<br />
None 83 25.6<br />
n 325<br />
†Private <strong>health</strong> <strong>in</strong>surance 127 (39%)<br />
Demographic <strong>and</strong> socio-economic characteristics for the primary carers<br />
The primary carer is the person <strong>in</strong> the household who manages the welfare <strong>and</strong> <strong>health</strong> <strong>of</strong> the family/household.<br />
Table 3.3 presents the self-reported demographic <strong>and</strong> socio-economic characteristics <strong>of</strong> the primary carers. Of<br />
those who said that they were primary carers, 32% were men; this <strong>in</strong>cluded men who were s<strong>in</strong>gle (36/103,<br />
35%), separated (8/103, 8%), widowed (13/103, 12%) or those who shared the car<strong>in</strong>g role with <strong>their</strong> partner<br />
(46/103, 45%). On average the primary carers were 52 years old <strong>and</strong> over a quarter were aged 65 years or<br />
older. Fifty three percent <strong>of</strong> the primary carers did not work outside the home. Just over 60% <strong>of</strong> the primary<br />
carers had completed a state exam<strong>in</strong>ation (group certificate or more) (Figure 3.3) <strong>and</strong> almost n<strong>in</strong>e percent <strong>of</strong><br />
those who had completed <strong>their</strong> state exam<strong>in</strong>ation did so with assistance from an adult education scheme.<br />
Almost 13% <strong>of</strong> primary carers described themselves as lone parents (Figure 3.3).<br />
Figure 3.3 Key characteristics <strong>of</strong> the household <strong>and</strong> primary carers (n=325)<br />
45<br />
40<br />
35<br />
30<br />
25<br />
20<br />
15<br />
10<br />
5<br />
0<br />
11.7<br />
39.8<br />
1.9<br />
12.7<br />
35.4<br />
30.5<br />
GOVERNMENT<br />
ACCOMODATION<br />
PRIMARY<br />
EDUCATION<br />
OR LESS<br />
NON-NATIONAL LONE PARENT MEDICAL CARD<br />
COVER<br />
NO CAR<br />
HOUSEHOLD AND PRIMARY CARER CHARACTERISTICS<br />
22<br />
23