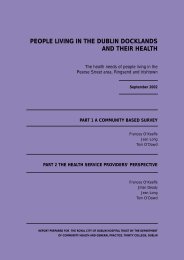
people living in finglas and their health - School of Medicine - Trinity ...
people living in finglas and their health - School of Medicine - Trinity ...
people living in finglas and their health - School of Medicine - Trinity ...

Create successful ePaper yourself
Turn your PDF publications into a flip-book with our unique Google optimized e-Paper software.
RESULTS - PART 1<br />
RESULTS - PART 1<br />
3.7 ACUTE HOSPITAL SERVICES<br />
Proportion <strong>of</strong> households with one or more members who used hospital services<br />
Accord<strong>in</strong>g to the primary carers, at least one person <strong>in</strong> two thirds <strong>of</strong> the households used one or more <strong>of</strong> the<br />
hospital services <strong>in</strong> the year prior to the survey. Thirty one percent (102/325) <strong>of</strong> households had one or more<br />
persons admitted to a hospital dur<strong>in</strong>g the same period (Table 3.17).<br />
Table 3.17 Primary carers’ reported numbers (%) who attended the hospital<br />
No. %<br />
Used hospital <strong>in</strong> last 12 months<br />
Yes 215 66.2<br />
No 110 33.8<br />
n 325<br />
Number admitted to hospital<br />
No one 223 68.6<br />
One person 80 24.6<br />
More than one person 22 6.8<br />
n 325<br />
Proportion <strong>of</strong> <strong>in</strong>dividuals who used hospital services <strong>in</strong> participat<strong>in</strong>g households<br />
The primary carers reported that 324 (33.6%) <strong>of</strong> the 963 <strong>in</strong>dividuals resid<strong>in</strong>g <strong>in</strong> the survey households used a<br />
hospital service <strong>in</strong> the year prior to the survey. This figure was adjusted to take account <strong>of</strong> the over<br />
representation <strong>of</strong> the population <strong>in</strong> the sample who lived <strong>in</strong> low deprivation district electoral divisions compared<br />
to the proportion <strong>liv<strong>in</strong>g</strong> <strong>in</strong> high deprivation district electoral divisions, <strong>and</strong> follow<strong>in</strong>g adjustment, 33.4% <strong>of</strong><br />
household members used a hospital service <strong>in</strong> the year prior to the survey. Seventy-three (7.6%) <strong>of</strong> all<br />
household members were admitted to hospital <strong>in</strong> the year prior to the survey. Of those who used the hospital,<br />
43% attended outpatients, 24% attended accident <strong>and</strong> emergency, 23% were admitted <strong>in</strong>to the hospital <strong>and</strong><br />
11% used the day hospital facilities (Figure 3.7).<br />
Figure 3.7 Hospital facilities used by household members as reported by primary carers (n=323)<br />
PERCENTAGE<br />
50<br />
40<br />
30<br />
20<br />
10<br />
0<br />
43.0<br />
Outpatient<br />
HOSPITAL FACILITY USED<br />
23.9<br />
Accident &<br />
emergency<br />
Accord<strong>in</strong>g to the primary carers, <strong>of</strong> those who attended the hospital, 18% attended as a result <strong>of</strong> an acute<br />
emergency <strong>and</strong> 15% had a cardiovascular disease (Figure 3.8).<br />
22.6<br />
Inpatient<br />
10.5<br />
Day case<br />
Figure 3.8 Household members’ reasons for attend<strong>in</strong>g hospital as reported by primary carers (n=319)<br />
PERCENTAGE<br />
20<br />
15<br />
10<br />
5<br />
0<br />
18.5<br />
Emergency<br />
15.1<br />
Cardiovascular<br />
11.3<br />
ENT, eye, Dental<br />
9.7 8.5<br />
8.1<br />
6.6 5.6<br />
4.1 3.5 3.5 2.8 2.8<br />
Obstetrics +<br />
Gynaecology<br />
Gastro-Intest<strong>in</strong>al<br />
Respiratory<br />
REASONS FOR ATTENDING HOSPITAL<br />
Orthopaedic<br />
The primary carers reported just over three fifths had a planned appo<strong>in</strong>tment at the time they attended the<br />
hospital (Table 3.18). Accord<strong>in</strong>g to the primary carers, 35% <strong>of</strong> those who used a hospital service referred<br />
themselves. The respondents reported that 33 <strong>of</strong> the 324 household members who used the hospital service<br />
were transported by ambulance, <strong>of</strong> these, 29 were emergency cases.<br />
Similar proportions <strong>of</strong> household members who reported us<strong>in</strong>g a hospital service <strong>in</strong> the year prior to the survey<br />
were <strong>liv<strong>in</strong>g</strong> <strong>in</strong> the less deprived areas <strong>and</strong> the more deprived areas (143/444 32% versus 176/519, 34%, p=0.6).<br />
Table 3.18 Primary carers’ reported type <strong>of</strong> appo<strong>in</strong>tment for, channel <strong>of</strong> referral to <strong>and</strong> means <strong>of</strong> transport used<br />
by <strong>in</strong>dividuals <strong>in</strong> <strong>their</strong> households to attend a hospital service <strong>in</strong> the 12 months prior to the survey<br />
Utilisation planned or emergency No. %<br />
Planned 200 62.1<br />
Emergency 122 37.9<br />
n 322<br />
Referral to hospital by:<br />
Self 114 35.3<br />
GP 143 44.3<br />
Hospital doctor 62 19.2<br />
Other <strong>health</strong> pr<strong>of</strong>essional 4 01.2<br />
n 323<br />
Hospital facility used<br />
Out patient 139 43.0<br />
Accident <strong>and</strong> emergency 77 23.9<br />
In patient 73 22.6<br />
Day 34 10.5<br />
n 323<br />
Transport used to travel to hospital<br />
Private 189 59.8<br />
Public 94 29.8<br />
Ambulance 33 10.4<br />
n 316<br />
Characteristics <strong>and</strong> factors associated with those us<strong>in</strong>g a hospital service <strong>in</strong> the last year<br />
Arthritis<br />
Diabetes<br />
Investigations<br />
Cancer<br />
Dermatology<br />
Others<br />
Bi-variate analysis us<strong>in</strong>g seven groups <strong>of</strong> variables (demographic characteristics, socio-economic<br />
characteristics, chronic illness, disability, <strong>health</strong> related behaviours, other <strong>health</strong> services utilised <strong>and</strong> wait<strong>in</strong>g for<br />
<strong>health</strong> care) <strong>in</strong>dicated that several factors were significantly associated with us<strong>in</strong>g a hospital service <strong>in</strong> the year<br />
prior to the survey.<br />
38<br />
39