View - CTU
View - CTU
View - CTU

Create successful ePaper yourself
Turn your PDF publications into a flip-book with our unique Google optimized e-Paper software.
32<br />
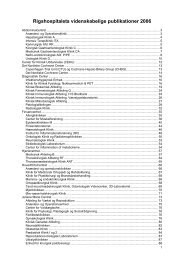
GDP:= - =<br />
Decisive influence<br />
100<br />
100<br />
100<br />
• ... p= 0.0010<br />
·----1-----------1 I<br />
100<br />
fp = 0.0110<br />
--t-----------1<br />
~<br />
~-------1<br />
no<br />
< 0.0001<br />
·-----------i<br />
= 0.0446<br />
-----------1<br />
I<br />
100<br />
I<br />
100<br />
100<br />
I<br />
100<br />
I<br />
100<br />
I<br />
100<br />
I<br />
100<br />
100<br />
ic outcome compared to the<br />
e significant results from the<br />
from OOOOE, Elsevier Inc.,<br />
1995--1999 2000--2004<br />
Categories Number % Number %<br />
Crown & Bridge 559 23.0 678 22.S<br />
Dentures 372 15.3 302 10.2<br />
Endodontic treatment 354 14.5 388 13.1<br />
Diagnostics 308 12.7 356 11.9<br />
Cad es 237 9.7 380 12.S<br />
'Periodontal treatment 171 7.0 168 5.7<br />
lmplantology 109 4.5 51 1.2<br />
Oral surgery 108 4.4 120 4.0<br />
Informed consent 75 3.1 122 4.1<br />
Other 61 2.5 110 3.7<br />
'Pain 33 1.4 166 5.6<br />
Office records 19 0.8 91 3.1<br />
Aesthetic dentistry 14 0.6 22 0.7<br />
Preventive care 13 0.5 19 0.6<br />
Financial cost 1 0.0 o.o<br />
Total 2434 100.0 2973 100.0<br />
Table 8. Number of malpractice claims for different categories. More than one category could be<br />
used in a single claim (Source: Table 2, Study VI. Reprinted with permission from International<br />
Endodontic Journal, Wiley-Blackwell, Oxford).<br />
A specific report was available in 93% (n = 482) of the endodontic-related cases in<br />
the period 1995-2002. A classification of the causes of these endodontic cases<br />
showed that the malpractice claims in 28% (n = 137) reflected technical shortcomings<br />
(occurring in the course of treatment) or technical treatment complications (as<br />
experienced by the patient), such as symptoms of infection, tooth fracture or post<br />
operative pain (Table 9).<br />
ims<br />
most frequent category<br />
om all the categories the<br />
y of the appealed cases<br />
:al Complaint Board.<br />
Technical complications 55<br />
or incorrect treatment<br />
Other reasons 56<br />
Persistent pain 24<br />
Wrong treatment 11<br />
Lack of information 11<br />
Prolonged treatment 10<br />
No data 12<br />
Total 179<br />
DCB decisions<br />
Verdict of<br />
malpractice<br />
No verdict of<br />
malpractice<br />
74<br />
26<br />
39<br />
37<br />
10<br />
6<br />
21<br />
213<br />
Settlement<br />
3<br />
69<br />
80<br />
Rejection<br />
3<br />
6<br />
10<br />
Total 11 (%)<br />
137 (28.4)<br />
86 (17.8)<br />
64 (13.3)<br />
50 110.4)<br />
21 (4.4)<br />
16 (3.3)<br />
108 (22.4)<br />
482 1100)<br />
Table 9. Endodontic claims and Dental Complaint Board (DCB) decisions 1995-2002. (Source: Table<br />
3, Study VI. Reprinted with permission from International Endodontic Journal, Wiley-Blackwell,<br />
Oxford).<br />
31