View - CTU
View - CTU
View - CTU

Create successful ePaper yourself
Turn your PDF publications into a flip-book with our unique Google optimized e-Paper software.
c treatments in DK<br />
Endodontic treatments in DK<br />
8j¢rndal & Reit<br />
1ly the number<br />
Therefore, the<br />
estimated. Each<br />
st during these<br />
I examinations,<br />
s was estimated<br />
• Potential users<br />
I a Actual users<br />
ts were basically<br />
th. However, a<br />
:anal of a tooth<br />
feen the arumal<br />
canals. In the<br />
with endodontic<br />
i was not availiagnosis.<br />
:d teeth were not<br />
d 1992.<br />
t was included in<br />
. was recommentnically<br />
judged to<br />
ics as gender and<br />
in 1996, and as<br />
. 1998.<br />
mined by linear<br />
of the line of the<br />
d an estimate of<br />
ce interval (B ± 2<br />
rth) was rejected<br />
alues of B indicate<br />
1lues of B indicate<br />
1ed canals in 1977<br />
ading to a 36%<br />
d teeth increased<br />
1979 1983 1987 1991 1995<br />
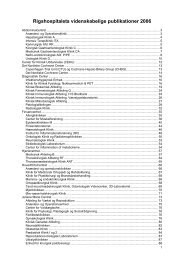
from 160 119 to 191 803 during the registered period<br />
(20% increase). The added number of annually performed<br />
root fillings was partly explained by an<br />
increased number of individuals (16%) using the NHI<br />
system (Fig. 1). As calculated per 1000 patients, the<br />
number of root fillings showed a statistically significant<br />
increase of 17% (B = 1.1 ± 0.24; P 0.000) {Fig. 2).<br />
The ratio between the number of root filled canals<br />
and teeth increased continuously from 1.67 to 1.96<br />
(B = 0.014 ± 0.000; P = 0.000) indicating that more<br />
and more multi-rooted teeth were treated during the<br />
period.<br />
The distribution of annually recorded root fillings<br />
over age and gender is displayed in Tables 1-3.<br />
Endodontic treatment was frequently recorded in all<br />
age groups with the bulk of treatments performed on<br />
patients between 40 and 60 years of age. During the<br />
last 6-8 years, small changes in the treatment pattern<br />
300<br />
~ 250<br />
iji.,<br />
EE<br />
m~ 200<br />
~ c.<br />
Cg 1so<br />
!:<br />
58- 100<br />
z<br />
50<br />
1976<br />
-+-Tooth extraction<br />
-o-Root fillin s<br />
1984 1992 2000<br />
Figure 2 The number of root fillings and extractions is<br />
observed per 1000 patients from 1977 to 2003. Data on<br />
number of patients are based on estimates (1977-1987) and<br />
actual figures reported (1988-2003).<br />
1999 2003<br />
Figure 1 The annual number of potential<br />
(dark bars) and actual users (grey<br />
bars) of the DNHI system. The number of<br />
actual users are estimated up to 19 8 7.<br />
were observed. The number of root fillings increased<br />
significantly among patients (actual users) in the<br />
youngest age group, and decreased among patients<br />
60-69 years of age and over 80 {Table 2). When<br />
calculations were based on all potential users of the<br />
system, a contrasting picture emerged: decreasing rate<br />
of root fillings among younger people and increasing<br />
among older {Table 3).<br />
Tooth extractions<br />
The number of tooth extractions was more than halved<br />
during the period of the study, from 656 624 in 1977<br />
to 346 490 in 2003 (Fig. 2). The reduction rate was<br />
most obvious during the first 10 years of the period.<br />
However, on a total population basis a continuous<br />
decreased rate of extraction was observed in the later<br />
years of the period, 1996-2003, among individuals<br />
below 70 years of age. Among older persons the rate<br />
increased (Table 4).<br />
Pulpotomies, direct pulp cappings and stepwise<br />
excavations<br />
The frequency of pulpotomies was substantially<br />
reduced through the period of the study, from 30 616<br />
in 1977 to 2357 in 2003. In 2003, the total numberof<br />
direct pulp cappings reached 15 090, and 18 610<br />
stepwise excavations were recorded. Recorded treatment<br />
procedures, counted per 1000 patients over the<br />
years, are displayed in Fig. 3.<br />
Discussion<br />
With only small variations over time, 70% of the<br />
potential users of the system were annually recorded in<br />
urnal, 37, 782-788, 2004<br />
International Endodontic Journal, 37, 782-788, 2004<br />
© 2004 International Endodontic Journal