Deva user manual - ISIS
Deva user manual - ISIS
Deva user manual - ISIS

Create successful ePaper yourself
Turn your PDF publications into a flip-book with our unique Google optimized e-Paper software.
DEVA Manual 8<br />
2.6. Time zero<br />
This is the “average” arrival time of the muons in the pulse, measured from the start of the histogram. It<br />
is calibrated by measuring muon precession in a series of different transverse fields and extrapolating<br />
back to the point when all the phases are equal. The latest value is saved in the file “basetime.uda”<br />
(kept in MUT$DISK:[MUTMGR.MUT_USERS.UDA] and copied to the current directory when<br />
setting up the data analysis program UDA)<br />
The value of t0 will be different between the Lecroy and DASH2 TDC systems and completely<br />
different if triggering via a RF pulse generator. Cable lengths are significant: adding about 3m of extra<br />
cable length moves the data by one 16ns bin.<br />
The first good data bin is about 0.1 us after t0, when all the incoming muons have arrived. Some of the<br />
detectors may also show a peak around time zero due to muons decaying in flight in the beamline and<br />
the positrons produced not being properly focused and striking the detector directly.<br />
For transverse field runs, the phase at time zero is actually about +3 degrees due to the rotation of the<br />
muon spin in the kicker in a horizontal plane (actually the lack of matching rotation of the spin as the<br />
muons are deflected by the electric fields). There is also a rotation of about 6.5 degrees in the vertical<br />
direction due to the separator. The overall effect is that the muon spin points slightly up and to the left<br />
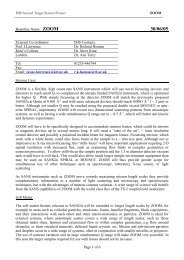
(looking upstream), ie. towards detector 16. The combined spin rotation is visible as “wiggles” of<br />
amplitude about 2.5% if looking at individual detectors in longitudinal field runs (20-200 Gauss).<br />
26<br />
24<br />
Detector 1<br />
Asymmetry (%)<br />
22<br />
20<br />
18<br />
16<br />
14<br />
0 2 4 6<br />
Time (µs)<br />
Silver, 100G LF (run 35709). Asymmetry plot of one detector only.<br />
2.7. Dead Times<br />
If two muons decay within a short interval of time and their positrons both reach the same detector,<br />
only one event may be counted. The minimum time to resolve two events is the “dead time” for that<br />
detector. This effect causes distortion, mainly at the start of the histograms when the muon count rate is<br />
highest.<br />
Asymmetry plots tend to hide the distortion as both forward and backward counts are reduced.<br />
The data can be corrected for this effect – our data analysis programs do this. However at very high<br />
count rates the correction becomes inaccurate. A count rate of 20-30 Mevents/hour is a reasonable<br />
compromise between high distortion and inefficient use of the beam.<br />
The most recent calibrated dead time values are kept in the file DTMPAR.DAT in<br />
MUT$DISK:[MUTMGR.MUT_USERS.RUMDA] . Another copy of this file is in the data directory<br />
(MUT$DISK0:[DATA.MUT] or \\NDAVMS\MUTDATA as seen on the PC). If you are analysing<br />
older data, old dead time files are preserved with names DTMPAR_date.DAT .