Policy Framework - Jacksonville Transportation Authority
Policy Framework - Jacksonville Transportation Authority
Policy Framework - Jacksonville Transportation Authority

Create successful ePaper yourself
Turn your PDF publications into a flip-book with our unique Google optimized e-Paper software.
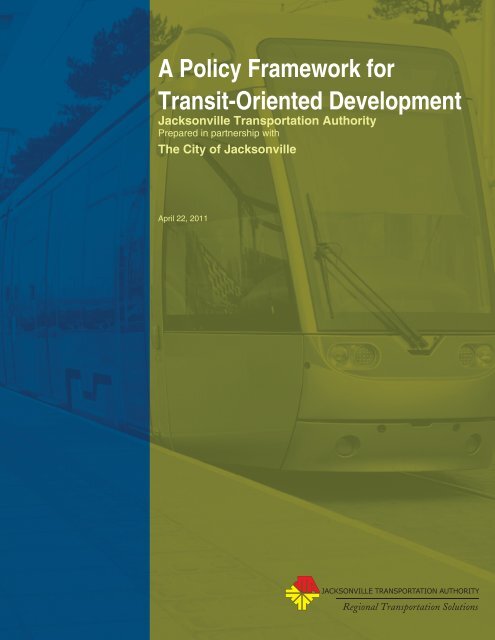
A <strong>Policy</strong> <strong>Framework</strong> for<br />
Transit-Oriented Development<br />
<strong>Jacksonville</strong> <strong>Transportation</strong> <strong>Authority</strong><br />
Prepared in partnership with<br />
The City of <strong>Jacksonville</strong><br />
April 22, 2011
A <strong>Policy</strong> <strong>Framework</strong> for<br />
Transit-Oriented Development<br />
Prepared for:`<br />
In partnership with:<br />
April 22, 2011<br />
Prepared by:
Table of Contents
City of <strong>Jacksonville</strong><br />
<strong>Policy</strong> <strong>Framework</strong> for Transit-Oriented Development<br />
Table of Contents<br />
TABLE OF CONTENTS<br />
LIST OF FIGURES AND TABLES<br />
ACKNOWLEDGEMENTS<br />
i<br />
ii<br />
iii<br />
Introduction 1<br />
Why Are We Doing This? 1<br />
What is Transit-Oriented Development? 1<br />
What Makes TOD Successful? 2<br />
What Are the Benefits? 3<br />
Current Status of Transit and TOD 4<br />
<strong>Jacksonville</strong> <strong>Transportation</strong> <strong>Authority</strong> Regional Transit Initiatives 4<br />
City of <strong>Jacksonville</strong> Documents 5<br />
Next Steps For Implementation 8<br />
What is Required to Make TOD Work? 10<br />
Market Forces 10<br />
Personal Preferences 10<br />
Existing Community Contexts 10<br />
What Other Communities Are Doing to Implement Transit and TOD 11<br />
Federal Transit Administration 12<br />
Can TOD Really Be Effective in <strong>Jacksonville</strong>? 14<br />
Evaluation of TOD Potential 16<br />
Transit Technologies 18<br />
Commuter Rail 18<br />
Express Bus 18<br />
Light Rail 19<br />
Bus Rapid Transit 19<br />
Monorail “Skyway” 20<br />
Local Bus 21<br />
<strong>Policy</strong> Issues and Opportunities 21<br />
Multimodal <strong>Transportation</strong> Plan 21<br />
Mobility Fee 22<br />
TOD Incentives 22<br />
Park and Ride 23<br />
Summary 24<br />
Table of Contents | i
City of <strong>Jacksonville</strong><br />
<strong>Policy</strong> <strong>Framework</strong> for Transit-Oriented Development<br />
List of Figures and Tables<br />
LIST OF FIGURES<br />
Figure 1 - JTA Transit Initiatives 4<br />
Figure 2 - 2030 Mobility Plan Development Areas 5<br />
Figure 3 - City of <strong>Jacksonville</strong> Comprehensive Plan 2030 - Future Land Use Map 6<br />
Figure 4 - Sample Graphics - <strong>Jacksonville</strong> Design Guidelines and Best Practices Handbook 7<br />
Figure 5 - Federal Transit Administration New Starts Project Justification Rating 12<br />
Figure 6 - TOD Corridor and Station Allocation Map 17<br />
LIST OF TABLES<br />
Table 1: Federal Transit Administration - New Starts Criteria and Measures 13<br />
Table 2: TOD Corridor and Station Area Summary 17<br />
ii | List of Figures and Tables
Acknowledgements
City of <strong>Jacksonville</strong><br />
<strong>Policy</strong> <strong>Framework</strong> for Transit-Oriented Development<br />
The City of <strong>Jacksonville</strong> Design Guidelines for Transit-Oriented Development were<br />
developed through partnership between the <strong>Jacksonville</strong> <strong>Transportation</strong> <strong>Authority</strong><br />
(JTA), The City of <strong>Jacksonville</strong> (COJ), and the consulting team of England-Thims &<br />
Miller, Inc., and Renaissance Planning Group.<br />
<strong>Jacksonville</strong> <strong>Transportation</strong> <strong>Authority</strong><br />
Michael J. Blaylock, Exec. Dir./CEO<br />
Brad Thoburn<br />
James Boyle<br />
Suraya Teeple, AICP<br />
City of <strong>Jacksonville</strong><br />
Bill Killingsworth, Planning Director<br />
Kristen Reed, AICP, City Planner Manager<br />
Susan Cohn, AICP, City Planner II<br />
Laurie Kattreh, <strong>Transportation</strong> Specialist<br />
England-Thims & Miller, Inc.<br />
Donald R. Smith, AICP<br />
Karl M. Soderholm, RLA, AICP<br />
Daniel Sorrow, RLA, Project Manager<br />
Renaissance Planning Group<br />
Alan Steinbeck, AICP<br />
Jason Espie, AICP<br />
Acknowledgements | iii
<strong>Policy</strong> <strong>Framework</strong> for TOD
City of <strong>Jacksonville</strong><br />
<strong>Policy</strong> <strong>Framework</strong> for Transit-Oriented Development<br />
Introduction<br />
The JTA and the COJ are working together to<br />
develop policies and procedures for incentivizing and<br />
implementing transit-oriented development (TOD)<br />
within the area of the existing and future transit<br />
system. Two complementary products resulted from<br />
this effort, a policy framework and design guidelines.<br />
This <strong>Policy</strong> <strong>Framework</strong> document evaluates the<br />
context, completeness and effectiveness of current<br />
policies and regulations in addressing transitsupportive<br />
developments. The Design Guidelines are<br />
a land use regulatory tool to support development<br />
and redevelopment along major transit corridors<br />
and transit stations. Together these two documents<br />
outline the context and recommended practices to<br />
foster efficient, multimodal development patterns.<br />
Why Are We Doing This?<br />
For several years, <strong>Jacksonville</strong> has been exploring<br />
the benefits of improving coordination among<br />
transportation and land use plans and analyzing<br />
strategies to foster an integrated planning approach.<br />
The JTA Board adopted a TOD policy outlining the<br />
agency goals on September 10, 2008. The policy<br />
includes the following goals:<br />
• Increase and enhance transit ridership, “peak<br />
hour” transit share and the transit experience on<br />
the JTA system.<br />
• Support a variety of transportation modes within<br />
the JTA system.<br />
• Establish, encourage and enhance community<br />
development and planning objectives for<br />
development at or around transit facilities which<br />
will support transit use and transit accessibility.<br />
• Promote a reduction in auto dependency and<br />
Vehicle Miles of Travel (VMT) per capita.<br />
• Provide a variety of services and uses within<br />
walking distance of residences.<br />
• Promote safe and attractive pedestrian-oriented<br />
public infrastructure<br />
• Facilitate an appropriate interface between street<br />
design and building frontage.<br />
The purpose of this <strong>Policy</strong> <strong>Framework</strong>, and the<br />
accompanying Design Guidelines for TOD, are<br />
Streetcar, Downtown <strong>Jacksonville</strong> (1935)<br />
to provide information, analysis and tools to help<br />
achieve the JTA goals. These documents recommend<br />
specific policies and implementation strategies to<br />
spur development patterns and urban design that<br />
complements bus and rail transit investments, and<br />
supports a high-quality, efficient and sustainable<br />
living and working environment in the City of<br />
<strong>Jacksonville</strong>.<br />
What is Transit-Oriented<br />
Development?<br />
Reconnecting America, the only national non-profit<br />
organization devoted to promoting best practices<br />
in transit-oriented development, defines TOD as<br />
“more compact development within easy walking<br />
distance of transit stations (typically a half mile)<br />
that contains a mix of uses such as housing, jobs,<br />
shops, restaurants and entertainment. TOD is really<br />
about creating walkable, sustainable communities<br />
for people of all ages and incomes and providing<br />
more transportation and housing choices (including<br />
townhomes, apartments, live-work spaces, and lofts).<br />
These neighborhoods provide for a lifestyle that’s<br />
convenient, affordable and active, and create places<br />
where our children can play and our parents can<br />
grow old comfortably.”<br />
TOD is a tool to help manage growth and improve<br />
the quality of life in areas served by transit. TOD<br />
provides communities with an alternative to low-<br />
Introduction | 1
City of <strong>Jacksonville</strong><br />
<strong>Policy</strong> <strong>Framework</strong> for Transit-Oriented Development<br />
density suburban sprawl and auto-dependent land<br />
use patterns by creating active places with a mix of<br />
uses and destinations located within an easy walk to<br />
transit – places that allow people to live, work and<br />
play without having to drive everywhere.<br />
TOD is not just development that is near transit, it’s<br />
development that also:<br />
• Increases “location efficiency” so people can walk,<br />
bike and take transit;<br />
• Boosts transit ridership and minimizes the<br />
impacts of traffic;<br />
• Provides a rich mix of housing, jobs, shopping<br />
and recreational choices;<br />
• Provides value for the public and private sectors,<br />
and for both new and existing residents;<br />
• Creates a sense of community and of place.<br />
What Makes TOD Successful?<br />
Places with high activity levels, a rich diversity of<br />
destinations, and multiple uses assembled in an<br />
environment designed with walkablity in mind will<br />
increase transit ridership. Successful TODs combine<br />
compact communities, a diverse mix of uses, a highquality<br />
pedestrian environment, and a defined center<br />
to create great places at transit stations.<br />
Compact Communities<br />
A key ingredient for walkable communities<br />
and support for transit is having more compact<br />
communities that create shorter walking distances<br />
between residences and other destinations, including<br />
commercial services, schools, parks and transit.<br />
Mix of Uses<br />
A transit-supportive environment includes a mixture<br />
of residential, commercial, service, employment, and<br />
public uses with active frontages, such as restaurants<br />
and retail, on the first floor. Mixed-use development<br />
helps to create vibrant activity throughout the day<br />
and night and makes it easier for people to live, work<br />
and play in the same area without having to travel<br />
great distances.<br />
Quality Pedestrian Environment<br />
Vibrant communities, with or without transit,<br />
are always convenient and comfortable places for<br />
pedestrians. Streets that have wide sidewalks,<br />
landscaping, and active uses such as storefront<br />
windows create inviting places where people want to<br />
walk, window shop and people watch.<br />
A Defined Center<br />
Transit is particularly successful in communities and<br />
neighborhoods that have defined centers, offering<br />
multiple attractions and reasons for pedestrians to<br />
frequent the area.<br />
Quality pedestrian environment<br />
Compact communities, higher densities<br />
2 | Introduction
City of <strong>Jacksonville</strong><br />
<strong>Policy</strong> <strong>Framework</strong> for Transit-Oriented Development<br />
What Are the Benefits?<br />
TOD conveys a number of benefits to local<br />
communities and the larger metropolitan region:<br />
Provide Mobility Choices<br />
Places linked by transit create more mobility options,<br />
especially for young people, the elderly and people<br />
who do not own cars or prefer not to drive.<br />
Increase Public Safety<br />
Active places that are busy through the day and<br />
evening provide “eyes on the street” and help to<br />
improve safety.<br />
Reduce the Need to Drive<br />
TOD allows people to walk or take transit to the<br />
destinations and services that they need without<br />
having to get in their car.<br />
Increase Disposable<br />
Household Income<br />
Housing and transportation are the first and second<br />
largest household expenses, respectively. TOD can<br />
reduce driving costs and the need for more than one<br />
car per household, saving households $3,000-$4,000<br />
per year.<br />
Reduce Air Pollution and<br />
Energy Consumption Rates<br />
By providing safe and easy pedestrian access to<br />
transit, TOD can lower rates of air pollution, energy<br />
consumption, greenhouse gas emissions, and the<br />
overall carbon footprint.<br />
Help Protect Existing Single<br />
Family Neighborhoods<br />
TOD directs more compact development to<br />
appropriate areas near transit, thereby reducing<br />
pressure for such development next to existing singlefamily<br />
neighborhoods.<br />
Play a Role in Economic<br />
Development<br />
TOD is increasingly used as a tool to help revitalize<br />
aging downtowns and urban neighborhoods.<br />
Decreasing Local<br />
Infrastructure Costs<br />
Through more compact development, TOD can<br />
reduce infrastructure costs to local governments and<br />
property owners by up to 25 percent.<br />
Provide mobility choices<br />
Reduce the need to drive<br />
Help protect existing neighborhoods<br />
Introduction | 3
City of <strong>Jacksonville</strong><br />
<strong>Policy</strong> <strong>Framework</strong> for Transit-Oriented Development<br />
Current Status of Transit and TOD<br />
<strong>Jacksonville</strong> <strong>Transportation</strong> <strong>Authority</strong> Regional Transit Initiatives<br />
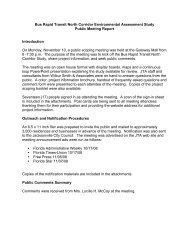
The JTA is taking a long term view of future transit<br />
needs for the city of <strong>Jacksonville</strong> and the region. The<br />
major transit routes defined by the JTA Transit Initiatives<br />
Map (TIM) are depicted in Figure 1 below. This map<br />
illustrates identified corridors for major proposed transit<br />
modes, as well as provides conceptual locations for transit<br />
stations. This map was used to organize the locations of<br />
both Transit Corridors and Place Types which are the<br />
building blocks of the Design Guidelines. As the JTA<br />
system grows, and the TIM is revised to identify new<br />
transit corridors and stations, the Design Guidelines will<br />
need to be updated to encompass any new routes in order<br />
to provide for TOD opportunities along all major transit<br />
routes within the city.<br />
Summary of JTA TOD Goals<br />
• Increase and enhance transit ridership<br />
• Support a variety of transportation<br />
modes<br />
• Encourage and enhance community<br />
development which support transit use<br />
accessibility<br />
• Reduce auto dependency<br />
• Provide a variety of services and uses<br />
within walking distance of residences<br />
• Promote safe and attractive pedestrian<br />
oriented public infrastructure<br />
4 | Current Status of Transit and TOD<br />
Figure 1 - JTA Transit Initiatives
I-10<br />
I-10<br />
BEAVER ST<br />
I-10<br />
CRYSTAL SPRINGS RD<br />
103rd ST<br />
GARDEN ST<br />
HERLONG RD<br />
COLLINS RD<br />
ST<br />
FOREST<br />
MONCRIEF RD<br />
PARK CITY RD<br />
I-295<br />
WILSON BLVD<br />
MORSE AVE<br />
BLVD<br />
DUNN AVE<br />
SAN JUAN<br />
LAKE SHORE BLVD<br />
I-10<br />
AVE<br />
CASSAT AVE<br />
PARK ST<br />
BLVD<br />
TIMUQUANA RD<br />
18th ST<br />
SOUTEL DR<br />
FARMS BLVD<br />
I-295<br />
DUNN AVE<br />
I-95<br />
Fu ler<br />
Bridge<br />
I-95<br />
8th ST<br />
BUSCH DR<br />
PICKERS RD<br />
RD<br />
I-95<br />
HAINES ST EXPY<br />
TALLEYRAND AVE<br />
John E. Mathews<br />
Bridge<br />
9A<br />
BOWDEN RD<br />
SUNBEAM RD<br />
I-295<br />
GLYNLEA RD<br />
GREENLAND RD<br />
CENTURY ST<br />
TOUCHTON RD<br />
I-295<br />
KERNAN BLVD<br />
I-295<br />
BEACH BLVD<br />
LAKE SHORE BLVD<br />
I-10<br />
LAKE SHORE BLVD<br />
CASSAT AVE<br />
I-10<br />
CASSAT AVE<br />
J. TURNER BUTLER BLVD<br />
A1A<br />
ATLANTIC BLVD<br />
FARMS BLVD<br />
HAINES ST EXPY<br />
I-295<br />
HAINES ST EXPY<br />
City of <strong>Jacksonville</strong><br />
<strong>Policy</strong> <strong>Framework</strong> for Transit-Oriented Development<br />
City of <strong>Jacksonville</strong> Documents<br />
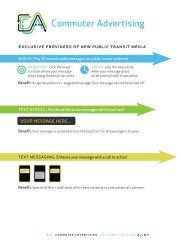
2030 Mobility Plan<br />
The <strong>Policy</strong> <strong>Framework</strong> and Design Guidelines are intended to build upon and implement the foundation laid<br />
by existing studies, reports and adopted documents. They follow the direction provided in the adopted City of<br />
<strong>Jacksonville</strong> City 2030 of Comprehensive <strong>Jacksonville</strong> City Plan and the of 2030 <strong>Jacksonville</strong><br />
Mobility Plan. The 2030 Mobility Plan is organized into<br />
five tiers of Development Areas ranging from the high-density, urbanized core to low-density outlying rural areas:<br />
Development Areas Development Areas<br />
Central Business District, Urban Priority Area (UPA), Urban Area (UA), Suburban Area (SA), and Rural Area<br />
(RA). These Central Business development District areas were integrated Central Business into District the Future Land Use Element of the 2030 Comprehensive<br />
Plan, and Urban are Priority shown Areain Figure 2 below. Urban The Priority Central AreaBusiness District is the downtown transportation concurrency<br />
exception Urban area, Area and serves as the core Urban of concentric Area development areas. The UPA generally includes the historic<br />
core of Suburban the City Areand major connecting Suburban corridors, Area and encourages infill at urban densities, revitalization and the<br />
use of existing Rural Area infrastructure through Rural redevelopment. Area The UA is the next tier and generally corresponds with<br />
the densely Roads developed portions of the Roads City that have been in residential or employment generating uses prior<br />
to consolidation. Major HighwaysLike the UPA, the UA Major is Highways expected to employ urban development characteristics. The SA tier<br />
generally<br />
River<br />
corresponds with the urbanizing<br />
River<br />
portions of the City developed after consolidation. Development<br />
within the SA should promote interconnectivity and generally have urban development characteristics. The<br />
outermost tier is the RA, which is comprised of all land not included in the previous development areas and<br />
corresponds with undeveloped, agriculture, or conservation lands intended to be developed at lower densities<br />
to minimize demand for new infrastructure. The development pattern of five concentric, development areas<br />
provided the framework for creating the Design Guidelines for TOD.<br />
City of <strong>Jacksonville</strong> of <strong>Jacksonville</strong><br />
Development Areas<br />
Development Areas<br />
Central Business District<br />
Urban Priority Area<br />
Urban Area<br />
Suburban Area<br />
Rural Area<br />
Roads<br />
Major Highways<br />
River<br />
Central Business District<br />
Urban Priority Area<br />
Urban Area<br />
Suburban Area<br />
Rural Area<br />
Roads<br />
Major Highways<br />
River<br />
*2030 Comprehensive Plan, Capital Improvement Element # CI-1,<br />
<strong>Transportation</strong> Element # T-14, Future Land Use Element # L-28<br />
Data provided by City of <strong>Jacksonville</strong>, Florida<br />
Planning and Development Department<br />
Developed by James M. Reed, AICP - jreed@coj.net<br />
November 9, 2010<br />
Content intended for illustrative purposes only.<br />
U.S 301 BALDWIN-MAXVILLE RD<br />
YELLOW WATER RD<br />
OTIS RD<br />
NORMANDY BLVD<br />
Feet<br />
0 7,500 15,000 30,000 45,000 60,000<br />
U.S. 301 BALDWIN-BRYCEVILLE RD<br />
I-10<br />
I-10<br />
U.S 301 BALDWIN-MAXVILLE RD<br />
OLD PLANK RD<br />
U.S. 301 BALDWIN-BRYCEVILLE RD<br />
U.S. 301 BALDWIN-BRYCEVILLE RD<br />
*2030 Comprehensive Plan, Capital Improvement *2030 Element Comprehensive # CI-1, Plan, Capital Improvement Element # CI-1,<br />
<strong>Transportation</strong> Element # T-14, Future Land Use Element <strong>Transportation</strong> # L-28 Element # T-14, Future Land Use Element # L-28<br />
Data provided by City of <strong>Jacksonville</strong>, Florida<br />
Planning and Development Department<br />
Developed by James M. Reed, AICP - jreed@coj.net Developed by James M. Reed, AICP - jreed@coj.net<br />
November 9, 2010<br />
November 9, 2010<br />
Content intended for illustrative purposes only.<br />
CHAFFEE RD<br />
YELLOW WATER RD<br />
YELLOW WATER RD<br />
COMMONWEALTH AVE<br />
PLUMMER RD<br />
BLAIR RD<br />
JONES RD<br />
OLD MIDDLEBURG RD<br />
NORMANDY<br />
I-10<br />
I-10<br />
JONES RD<br />
BEAVER ST<br />
PRITCHARD RD<br />
SHINDLER DR<br />
BEAVER ST<br />
A RGYLE<br />
BULLS BAY HWY<br />
FOURAKER RD<br />
WESTPORT RD<br />
OLD KINGS RD<br />
NEW KINGS RD<br />
GARDEN<br />
RICKER RD<br />
IMESON RD<br />
OLD MIDDLEBURG RD<br />
RAMPART RD<br />
PICKETTVILLE RD<br />
I-295<br />
OTIS RD<br />
OTIS RD<br />
NORMANDY BLVD<br />
Data provided by City of <strong>Jacksonville</strong>, Florida<br />
Planning and Development Department<br />
Content intended for illustrative purposes only.<br />
LANE AVE<br />
LANE AVE<br />
COMMONWEALTH AVE<br />
LEM TURNER RD<br />
JAMMES RD<br />
5th AVE<br />
BEAVER ST<br />
BLANDING BLVD<br />
EDGEWOOD AVE<br />
SEABOARD AVE<br />
LAKE SHORE<br />
TROUT RIVER BLVD<br />
POST ST<br />
RD<br />
I-295<br />
COLLINS<br />
EDGEWOOD AV E<br />
ORTEGA<br />
45th ST<br />
McDUFF AVE<br />
ROOSEVELT BLVD<br />
ROOSEVELT BLVD<br />
PARK ST<br />
KINGS RD<br />
KING ST<br />
RD<br />
MONCRIEF<br />
AVE<br />
EDGEWOOD<br />
RIVERSIDE AVE<br />
OLD PLANK RD<br />
PECAN PARK RD<br />
ST<br />
BEAVER BAY<br />
ST<br />
Wa ren<br />
DUVAL RD<br />
Bridge<br />
Henry H. Buckman Bridge<br />
PECAN PARK RD<br />
AIRPORT RD<br />
ST. Elmo<br />
Acosta<br />
BROAD ST<br />
20th ST EXPY<br />
STATE ST<br />
SAN MARCO BLVD<br />
MANDARIN RD<br />
Bridge<br />
Alsop<br />
RD<br />
MANDARIN<br />
BRADY<br />
ORANGE<br />
John T.<br />
MAIN ST<br />
SAN JOSE BLVD<br />
HENDRICKS AVE<br />
CHAFFEE RD<br />
LIBERTY ST<br />
ST AUGUSTINE RD<br />
BUSCH DR E<br />
SCOTT MILL RD<br />
COMMONWEALTH AVE<br />
I-95<br />
BEAUCLERC RD<br />
SAN JOSE BLVD<br />
Bridge<br />
BEACH BLVD<br />
J ULINGTON CREEK RD<br />
Hart<br />
EMERSON ST<br />
HECKSCHER DR<br />
Isaiah D.<br />
SAN JOSE BLVD<br />
LORETTO RD<br />
HARTLEY RD<br />
MAIN ST<br />
EASTPORT RD<br />
PHILIPS HWY<br />
DUVAL STATION RD<br />
PLUMMER RD<br />
BLAIR RD<br />
POWERS AVE<br />
ATLANTIC BLVD<br />
STARRATT RD<br />
P ULASKI RD<br />
HART EXPY<br />
OLD<br />
BAYMEADOWS RD<br />
I-10<br />
UNIVERSITY BLVD<br />
KINGS RD<br />
NEW BERLIN RD<br />
UNIVERSITY BLVD<br />
EASTPORT RD<br />
HOOD LANDING RD<br />
CESERY RD<br />
YELLOW BLUFF RD<br />
PARENTAL HOME RD<br />
HOOD RD<br />
JULINGTON CREEK RD<br />
FORT CAROLINE RD<br />
ROGERO RD<br />
ST. AUGUSTINE RD<br />
TOWNSEND RD<br />
EXPY<br />
ARLINGTON<br />
RD<br />
ARLINGTON<br />
STAR RD<br />
LONE<br />
ALTAMA RD<br />
J. TURNER BUTLER BLVD<br />
CRYSTAL SPRINGS RD<br />
YELLOW BLUFF RD<br />
CRYSTAL SPRINGS RD<br />
Feet<br />
0 7,500 15,000 30,000 0 45,000 7,500 15,000 60,000 30,000 45,000 60,000<br />
I-10<br />
U.S 301 BALDWIN-MAXVILLE RD<br />
OLD PLANK RD<br />
CHAFFEE RD<br />
U.S. 301 BALDWIN-BRYCEVILLE RD<br />
COMMONWEALTH AVE<br />
YELLOW WATER RD<br />
PLUMMER RD<br />
BLAIR RD<br />
I-10<br />
JONES RD<br />
I-10<br />
103rd ST<br />
PHILIPS HWY<br />
I-95<br />
BELFORT RD<br />
MERRILL RD<br />
HOGAN RD<br />
STARRATT RD<br />
Napoleon Bonaparte<br />
Broward Bridge<br />
SOUTHSIDE BLVD<br />
NEW BERLIN RD<br />
SOUTHSIDE CONNECTOR<br />
CEDAR POINT RD<br />
SOUTHSIDE BLVD<br />
BONEY RD<br />
MONUMENT RD<br />
9-A<br />
ST JOHNS BLUFF RD<br />
HECKSCHER DR<br />
I-95<br />
FORT CAROLINE RD<br />
ATLANTIC BLVD<br />
J. TURNER BUTLER BLVD<br />
PHILIPS HWY<br />
McCORMICK RD<br />
MT PLEASANT RD<br />
CEDAR POINT RD<br />
GIRVIN RD<br />
5th AVE<br />
HODGES BLVD<br />
Figure 2 - 2030 Mobility Plan Development Areas<br />
Feet<br />
Current<br />
WILSON BLVD<br />
Status of Transit and TOD | 5<br />
NORMANDY<br />
JONES RD<br />
OLD MIDDLEBURG RD<br />
NORMANDY<br />
BEAVER ST<br />
GARDEN ST<br />
JONES RD<br />
GARDEN ST<br />
JONES RD<br />
PRITCHARD RD<br />
PRITCHARD RD<br />
SHINDLER DR<br />
BULLS BAY HWY<br />
HERLONG RD<br />
A RGYLE<br />
BULLS BAY HWY<br />
OTIS RD<br />
HERLONG RD<br />
NORMANDY BLVD<br />
COLLINS RD<br />
FOURAKER RD<br />
OLD KINGS RD<br />
NEW KINGS RD<br />
FOURAKER RD<br />
WESTPORT RD<br />
GARDEN<br />
OLD KINGS RD<br />
IMESON RD<br />
NEW KINGS RD<br />
GARDEN<br />
ST<br />
RICKER RD<br />
IMESON RD<br />
MONCRIEF RD<br />
OLD MIDDLEBURG RD<br />
ST<br />
FOREST<br />
PICKETTVILLE RD<br />
MONCRIEF RD<br />
OLD MIDDLEBURG RD<br />
RAMPART RD<br />
PICKETTVILLE RD<br />
PARK CITY RD<br />
I-295<br />
LANE AVE<br />
LANE AVE<br />
COMMONWEALTH AVE<br />
LEM TURNER RD<br />
LANE AVE<br />
LANE AVE<br />
WILSON BLVD<br />
MORSE AVE<br />
DUNN AVE<br />
BLVD<br />
COMMONWEALTH AVE<br />
BEAVER ST<br />
SAN JUAN<br />
LEM TURNER RD<br />
DUNN AVE<br />
5th AVE<br />
BEAVER ST<br />
SAN JUAN<br />
JAMMES RD<br />
OLD PLANK RD<br />
BLANDING BLVD<br />
A1A<br />
AVE<br />
HECKSCHER DR<br />
SAN PABLO RD<br />
EDGEWOOD AVE<br />
PARK ST<br />
LAKE SHORE<br />
AVE<br />
TROUT RIVER BLVD<br />
OCEAN ST<br />
POST ST<br />
EDGEWOOD AVE<br />
PARK ST<br />
SEABOARD AVE<br />
LAKE SHORE<br />
TROUT RIVER BLVD<br />
CHAFFEE RD<br />
I-295<br />
BLVD<br />
POST ST<br />
A1A<br />
COLLINS RD<br />
BLVD<br />
COMMONWEALTH AVE<br />
EDGEWOOD AVE<br />
MAYPORT RD<br />
TIMUQUANA RD<br />
118th ST<br />
EDGEWOOD AVE<br />
ORTEGA<br />
SOUTEL DR<br />
45th ST<br />
PLUMMER RD<br />
SOUTEL DR<br />
BLAIR RD<br />
McDUFF AVE<br />
ROOSEVELT BLVD<br />
A1A<br />
45th ST<br />
McDUFF AVE<br />
I-10<br />
ROOSEVELT BLVD<br />
A1A<br />
PARK ST<br />
ROOSEVELT BLVD<br />
KINGS RD<br />
KING ST<br />
PARK ST<br />
KINGS RD<br />
KING ST<br />
I-295<br />
RD<br />
MONCRIEF<br />
AVE<br />
EDGEWOOD<br />
DUNN AVE<br />
RIVERSIDE AVE<br />
37<br />
I-295<br />
RD<br />
MONCRIEF<br />
AVE<br />
EDGEWOOD<br />
CRYSTAL SPRINGS RD<br />
103rd ST<br />
JONES RD<br />
OLD MIDDLEBURG RD<br />
NORMANDY<br />
DUNN AVE<br />
GARDEN ST<br />
JONES RD<br />
RIVERSIDE AVE<br />
PRITCHARD RD<br />
SHINDLER DR<br />
PECAN PARK RD<br />
ST<br />
BEAVER BAY<br />
ST<br />
I-95<br />
Fu ler<br />
Warren<br />
Bridge<br />
DUVAL RD<br />
Bridge<br />
PECAN PARK RD<br />
ST<br />
BEAVER BAY<br />
ST<br />
A RGYLE<br />
BULLS BAY HWY<br />
Warren<br />
Bridge<br />
HERLONG RD<br />
AIRPORT RD<br />
ST. Elmo<br />
Acosta<br />
I-95<br />
Fu ler<br />
COLLINS RD<br />
BROAD ST<br />
20th ST EXPY<br />
I-95<br />
PECAN PARK RD<br />
8th ST<br />
STATE ST<br />
SAN MARCO BLVD<br />
Bridge<br />
DUVAL RD<br />
Bridge<br />
Henry H. Buckman Bridge<br />
Alsop<br />
AIRPORT RD<br />
ST. Elmo<br />
Acosta<br />
John T.<br />
BROAD ST<br />
FOURAKER RD<br />
WESTPORT RD<br />
MAIN ST<br />
SAN JOSE BLVD<br />
20th ST EXPY<br />
MANDARIN RD<br />
HENDRICKS AVE<br />
BUSCH DR<br />
LIBERTY ST<br />
I-95<br />
RD<br />
MANDARIN<br />
BRADY<br />
ORANGE<br />
PECAN PARK RD<br />
8th ST<br />
STATE ST<br />
SAN MARCO BLVD<br />
OLD KINGS RD<br />
Bridge<br />
NEW KINGS RD<br />
Alsop<br />
GARDEN<br />
John T.<br />
MAIN ST<br />
SAN JOSE BLVD<br />
RICKER RD<br />
IMESON RD<br />
HENDRICKS AVE<br />
BUSCH DR<br />
ST AUGUSTINE RD<br />
ST<br />
LIBERTY ST<br />
FOREST<br />
BUSCH DR E<br />
OLD MIDDLEBURG RD<br />
RD<br />
RAMPART RD<br />
I-95<br />
PICKETTVILLE RD<br />
ST AUGUSTINE RD<br />
I-295<br />
PICKERS RD<br />
I-95<br />
BUSCH DR E<br />
MONCRIEF RD<br />
PARK CITY RD<br />
SCOTT MILL RD<br />
I-95<br />
Bridge<br />
BEACH BLVD<br />
I-95<br />
LANE AVE<br />
TALLEYRAND AVE<br />
Hart<br />
EMERSON ST<br />
HECKSCHER DR<br />
Isaiah D.<br />
MAIN ST<br />
DUV<br />
EASTPORT RD<br />
PHILIPS HWY<br />
LANE AVE<br />
WILSON BLVD<br />
MORSE AVE<br />
BEAUCLERC RD<br />
BLVD<br />
COMMONWEALTH AVE<br />
SAN JOSE BLVD<br />
LEM<br />
EAS<br />
DU<br />
Brid<br />
John<br />
J<br />
B<br />
BLVD<br />
PHIL<br />
SAN<br />
I-295<br />
JAMMES RD<br />
ORT
I-10<br />
I-10<br />
I-10<br />
I-10<br />
CRYSTAL SPRINGS RD<br />
103rd ST<br />
GARDEN ST<br />
PRITCHARD RD<br />
HERLONG RD<br />
COLLINS RD<br />
A R GYLE<br />
I-10<br />
ST<br />
FOREST<br />
MONCRIEF RD<br />
I-10<br />
PARK CITY RD<br />
I-295<br />
CRYSTAL SPRINGS RD<br />
WILSON BLVD<br />
103rd ST<br />
MORSE AVE<br />
BLVD<br />
DUNN AVE<br />
5th AVE<br />
COMMONWEALTH AVE<br />
SAN JUAN<br />
GARDEN ST<br />
LAKE SHORE BLVD<br />
PRITCHARD RD<br />
AVE<br />
CASSAT AVE<br />
PARK ST<br />
HERLONG RD<br />
POST S T<br />
E<br />
COLLINS RD<br />
TIMUQUANA RD<br />
A R GYLE<br />
118th ST<br />
SOUTEL DR<br />
FARMS BLVD<br />
ST<br />
FOREST<br />
MONCRIEF RD<br />
PARK CITY RD<br />
I-295<br />
I-10<br />
WILSON BLVD<br />
DUNN AVE<br />
BLVD<br />
DUNN AVE<br />
5th AVE<br />
COMMONWEALTH AVE<br />
CRYSTAL SPRINGS RD<br />
103rd ST<br />
MORSE AVE<br />
SAN JUAN<br />
E<br />
GARDEN ST<br />
LAKE SHORE BLVD<br />
AVE<br />
DUVAL RD<br />
PRITCHARD RD<br />
CASSAT AVE<br />
PARK ST<br />
HERLONG RD<br />
POST S T<br />
E<br />
20th ST EXPY<br />
8th ST<br />
LVD<br />
TIMUQUANA RD<br />
COLLINS RD<br />
118th ST<br />
A R GYLE<br />
A<br />
BUSCH DR<br />
SOUTEL DR<br />
FARMS BLVD<br />
PICKERS RD<br />
RD<br />
I-95<br />
ST<br />
FOREST<br />
MONCRIEF RD<br />
HAINES ST EXPY<br />
PARK CITY RD<br />
I-295<br />
J<br />
DUNN AVE<br />
WILSON BLVD<br />
MORSE AVE<br />
John E. Mathews<br />
Bridge<br />
BLVD<br />
DUNN AVE<br />
E<br />
5th AVE<br />
9A<br />
COMMONWEALTH AVE<br />
SAN JUAN<br />
LAKE SHORE BLVD<br />
DUVAL RD<br />
AVE<br />
BOWDEN RD<br />
CASSAT AVE<br />
I-10<br />
PARK ST<br />
SUNBEAM RD<br />
20th ST EXPY<br />
8th ST<br />
POST S T<br />
I-295<br />
FORT CAROLINE RD<br />
ROGERO RD<br />
CRYSTAL SPRINGS RD<br />
E<br />
LVD<br />
103rd ST<br />
A<br />
GLYNLEA RD<br />
BUSCH DR<br />
TIMUQUANA RD<br />
118th ST<br />
RD<br />
GREENLAND RD<br />
JULINGTON CR E EK RD<br />
TOWNSEND RD<br />
I-95<br />
SOUTEL DR<br />
PICKERS RD<br />
GARDEN ST<br />
ST<br />
RD<br />
MERRILL RD<br />
ARLINGTON EXPY<br />
FARMS BLVD<br />
ST<br />
FOREST<br />
FOREST<br />
HAINES ST EXPY<br />
ST<br />
PRITCHARD RD<br />
CENTURY ST<br />
HERLONG RD<br />
STARRATT RD<br />
I-295<br />
I-295<br />
TOUCHTON RD<br />
WILSON BLVD<br />
COLLINS RD<br />
WILSON BLVD<br />
J<br />
A R GYLE<br />
I-295<br />
DUNN AVE<br />
John E. Mathews<br />
Bridge<br />
SOUTHSIDE BLVD<br />
E<br />
ST<br />
FOREST<br />
9A<br />
MONCRIEF RD<br />
BOWDEN RD<br />
PARK CITY RD<br />
SUNBEAM RD<br />
LAKE SHORE BLVD<br />
LAKE SHORE BLVD<br />
I-295<br />
WILSON BLVD<br />
LAKE SHORE BLVD<br />
DUVAL RD<br />
MORSE AVE<br />
I-295<br />
20th ST EXPY<br />
AVE<br />
BLVD<br />
CASSAT AVE<br />
DUNN AVE<br />
FORT CAROLINE RD<br />
ROGERO RD<br />
GLYNLEA RD<br />
8th ST<br />
AVE<br />
LVD<br />
CASSAT AVE<br />
A<br />
5th AVE<br />
COMMONWEALTH AVE<br />
SAN JUAN<br />
E<br />
E<br />
LAKE SHORE BLVD<br />
AVE<br />
TIMUQUANA RD<br />
CASSAT AVE<br />
PARK ST<br />
TIMUQUANA RD<br />
GREENLAND RD<br />
JULINGTON CR E EK RD<br />
CASSAT AVE<br />
BUSCH DR<br />
TOWNSEND RD<br />
RD<br />
ARLINGTON EXPY<br />
PICKERS RD<br />
RD<br />
I-95<br />
HAINES ST EXPY<br />
MERRILL RD<br />
CENTURY ST<br />
STARRATT RD<br />
McCORMICK RD<br />
POST S T<br />
TOUCHTON RD<br />
E<br />
TIMUQUANA RD<br />
118th ST<br />
J<br />
FARMS BLVD<br />
FARMS BLVD<br />
KERNAN BLVD<br />
SOUTEL DR<br />
John E. Mathews<br />
Bridge<br />
SOUTHSIDE BLVD<br />
BEACH BLVD<br />
FARMS BLVD<br />
9A<br />
BOWDEN RD<br />
I-295<br />
SUNBEAM RD<br />
DUNN AVE<br />
DUNN AVE<br />
DUNN AVE<br />
DUNN AVE<br />
I-295<br />
FORT CAROLINE RD<br />
ROGERO RD<br />
GLYNLEA RD<br />
E<br />
E<br />
E<br />
GREENLAND RD<br />
JULINGTON CR E EK RD<br />
E<br />
TOWNSEND RD<br />
RD<br />
I-295<br />
DUVAL RD<br />
MERRILL RD<br />
ARLINGTON EXPY<br />
20th ST EXPY<br />
McCORMICK RD<br />
CENTURY ST<br />
STARRATT RD<br />
8th ST<br />
LVD<br />
TOUCHTON RD<br />
KERNAN BLVD<br />
A<br />
BUSCH DR<br />
RD<br />
LVD<br />
BEACH BLVD<br />
SOUTHSIDE BLVD<br />
LVD<br />
PICKERS RD<br />
A<br />
LVD<br />
MAYPORT RD<br />
I-95<br />
BUSCH DR<br />
BUSCH DR<br />
HAINES ST EXPY<br />
LAKE SHORE BLVD<br />
ATLANTIC BLVD<br />
BUSCH DR<br />
AVE<br />
J<br />
CASSAT AVE<br />
A1A<br />
HAINES ST EXPY<br />
John E. Mathews<br />
Bridge<br />
HAINES ST EXPY<br />
HAINES ST EXPY<br />
E<br />
A1A<br />
9A<br />
John E. Mathews<br />
BOWDEN RD<br />
John E. Mathews<br />
SUNBEAM RD<br />
FARMS BLVD<br />
McCORMICK RD<br />
Bridge<br />
Bridge<br />
I-295<br />
John E. Mathews<br />
FORT CAROLINE RD<br />
ROGERO RD<br />
GLYNLEA RD<br />
Bridge<br />
KERNAN BLVD<br />
GREENLAND RD<br />
JULINGTON CR E EK RD<br />
MAYPORT RD<br />
TOWNSEND RD<br />
RD<br />
MERRILL RD<br />
ARLINGTON EXPY<br />
ATLANTIC BLVD<br />
BEACH BLVD<br />
CENTURY ST<br />
STARRATT RD<br />
TOUCHTON RD<br />
A1A<br />
ROGERO RD<br />
ROGERO RD<br />
ROGERO RD<br />
GLYNLEA RD<br />
GLYNLEA RD<br />
GLYNLEA RD<br />
A1A<br />
SOUTHSIDE BLVD<br />
E<br />
City of <strong>Jacksonville</strong><br />
<strong>Policy</strong> <strong>Framework</strong> for Transit-Oriented Development<br />
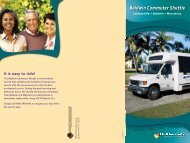
Comprehensive Plan<br />
The City of <strong>Jacksonville</strong>’s Comprehensive Plan includes a provision for TOD in the medium/high density<br />
residential as well as non-residential or commercial land use categories. This TOD allowance is applicable to<br />
all sites within ½ mile of JTA’s planned Rapid Transit System or Commuter Rail lines. TOD allowances<br />
are intended to encourage compact, mixed use development on sites that are accessible by transit. A TOD<br />
designation ensures that all new development within walking distance of an existing or planned rapid transit<br />
alignment or station is transit supportive and pedestrian focused.<br />
Figure 3 shows the City of <strong>Jacksonville</strong> 2030 Future Land Use Map. TOD allowances are included in the<br />
Community/General Commercial (CGC), Residential-Professional-Institutional (RPI), and Neighborhood<br />
Commercial (NC) future Future land Land use designations. Use* Densities to the extent allowed in the High Density Residential<br />
(HDR)<br />
City<br />
future<br />
of<br />
land<br />
<strong>Jacksonville</strong><br />
Categories<br />
use designation are allowable within TOD areas. In addition to the CGC and RPI future<br />
Agriculture I<br />
land Future use designations, Land Use* Business Agriculture II Park (BP) future land use category also includes additional density allowance<br />
for TOD. TOD densities Agriculture in each III<br />
Categories<br />
future land use designation are further categorized based on location as urban<br />
Agriculture IV<br />
priority,<br />
Agriculture<br />
urban<br />
I<br />
and suburban development areas as defined in both the 2030 Mobility Plan and the 2030<br />
Business Park<br />
Agriculture II<br />
Comprehensive Plan Future Land Use Element.<br />
City of Central <strong>Jacksonville</strong><br />
Business District<br />
Agriculture III<br />
Community/Gen. Commercial<br />
Agriculture IV<br />
City Future of Land <strong>Jacksonville</strong><br />
Use* City of <strong>Jacksonville</strong><br />
Business Park<br />
Conservation<br />
City of City <strong>Jacksonville</strong> of <strong>Jacksonville</strong><br />
Categories<br />
Agriculture I<br />
Central Business District<br />
High Density Residential<br />
Future Land Agriculture Use* II<br />
Categories<br />
Community/Gen. Commercial Heavy Industrial<br />
Agriculture III<br />
Agriculture I<br />
Categories<br />
Categories<br />
Conservation Agriculture IV Low Density Residential<br />
Agriculture II<br />
Agriculture I<br />
Agriculture I<br />
Agriculture I Business Park<br />
High Density Residential Light Industrial Agriculture III<br />
Agriculture II<br />
Agriculture II<br />
Central Business District<br />
Agriculture IV<br />
Agriculture Agriculture III<br />
Agriculture III<br />
Heavy Industrial II<br />
Medium Density Residential<br />
Community/Gen. Commercial<br />
Business Park<br />
Agriculture IV<br />
Agriculture IV<br />
Agriculture Low Density IIIResidential<br />
Conservation Neighborhood Central Commercial<br />
Business District<br />
Business Park<br />
Business Park<br />
Agriculture IV High Density Residential<br />
Community/Gen. Commercial<br />
Central Light Business Industrial District<br />
Public Buildings and Facilities<br />
Central Business District<br />
Heavy Industrial<br />
Conservation<br />
Community/Gen.<br />
Community/Gen. Commercial Business Commercial<br />
Medium Density Park Residential<br />
Low Density Residential Regional Commercial<br />
High Density Residential<br />
Conservation<br />
Conservation<br />
Central Business District Light Industrial<br />
Neighborhood Commercial Recreation and Heavy Open Industrial Space<br />
High Density Residential<br />
High Density Residential<br />
Medium Density Residential<br />
Community/Gen. Commercial<br />
Low Density Residential<br />
Heavy<br />
Heavy Industrial Public Industrial Buildings and Facilities Residential - Professional - Instutional<br />
Neighborhood Commercial<br />
Light Industrial<br />
Low<br />
Low Density Residential Conservation<br />
Density Residential<br />
Regional Commercial Public Buildings and Facilities Rural Residential Medium Density Residential<br />
Light Industrial<br />
Light Industrial<br />
High Density Residential<br />
Neighborhood Commercial<br />
Medium Recreation Density Residential and Open Space Water<br />
Medium Density Residential<br />
Public Buildings and Facilities<br />
Neighborhood Heavy Industrial<br />
Commercial<br />
Neighborhood Commercial Residential - Professional Instutional Water Dependent/Water Related<br />
City <strong>Jacksonville</strong><br />
Regional Commercial<br />
Recreation and Open Space<br />
Residential - Professional - Instutional Regional Commercial<br />
Public Buildings and Facilities<br />
Public Buildings and Facilities Low Rural Density Residential Residential Rural Residential Multi Use Recreation and Open Space<br />
Regional Commercial<br />
Regional Commercial<br />
Light Industrial Water<br />
Residential - Professional - Instutional<br />
Recreation Water and Open Space<br />
Major Highways<br />
Recreation and Open Space<br />
Water Dependent/Water Related Rural Residential<br />
Future Residential<br />
Residential - Professional - Instutional Medium - Professional<br />
Water Dependent/Water Density Land - Residential<br />
Instutional Use*<br />
Multi UseRelated<br />
River Water<br />
Rural Residential<br />
Rural Residential<br />
Categories<br />
Neighborhood Multi Use Commercial<br />
Major Highways<br />
Water Dependent/Water Related<br />
Water<br />
Duval County<br />
Water<br />
River<br />
Multi Use<br />
Water Public Buildings and Facilities<br />
Water Dependent/Water Related Major Agriculture Dependent/Water Highways I Related<br />
Duval County<br />
Major Highways<br />
Multi<br />
Multi Use<br />
Regional Use<br />
River Agriculture Commercial II<br />
River<br />
Major Highways<br />
Major Highways Recreation and Open Space<br />
Duval County<br />
River Duval Agriculture County III<br />
River<br />
Duval Residential County - Professional - Instutional<br />
Duval County<br />
Agriculture IV<br />
Future Land Future Use* Land Use*<br />
Rural Business Residential Park<br />
U.S 301 BALDWIN-MAXVILLE RD<br />
6 | Current Status of Transit and TOD<br />
U.S. 301 BALDWIN-BRYCEVILLE RD<br />
Water Central Business District<br />
YELLOW WATER RD<br />
I-10<br />
BEAVER ST<br />
Water Community/Gen. Dependent/Water Commercial Related<br />
Multi Conservation Use<br />
Major High Density Highways Residential<br />
River Heavy Industrial<br />
Duval Low Density CountyResidential<br />
Light Industrial<br />
U.S 301 BALDWIN-MAXVILLE RD<br />
Medium Density Residential<br />
Neighborhood Commercial<br />
City of <strong>Jacksonville</strong><br />
OTIS RD<br />
I-10<br />
NORMANDY BLVD<br />
I-10<br />
U.S 301 BALDWIN-MAXVILLE RD<br />
Residential Developed - Professional by James - Instutional M. Reed, AICP - jreed@coj.net<br />
* 2030 Comprehensive<br />
* 2030 Comprehensive Plan, Future Land Use September,<br />
Plan, Future<br />
Element Map 2009<br />
Land Use Element Map Data L-19 provided by Planning and Development Department<br />
L-19<br />
Rural Residential<br />
Data provided by Planning Developed by James M. Reed, AICP - jreed@coj.net<br />
Data provided by Planning and Development Content<br />
and Development<br />
Department intended for illustrative<br />
Department<br />
purposes only.<br />
Water<br />
September, 2009<br />
Developed by James M. Reed, AICP - jreed@coj.net<br />
Developed by James M. Reed, AICP - jreed@coj.net<br />
Feet<br />
September, Water 2009 Dependent/Water 0 8,000 Related 16,000 32,000 Content intended 48,000 for illustrative purposes 64,000 only.<br />
September, 2009<br />
Content intended Multi Use<br />
Data provided by Planning and Development Department<br />
for illustrative purposes only.<br />
Feet<br />
Content intended for illustrative purposes only.<br />
0 8,000 16,000 32,000 48,000 64,000<br />
* 2030 Comprehensive Major Highways Plan, Future Land Use Element Map L-19<br />
Feet<br />
Developed Feet by James M. Reed, AICP - jreed@coj.net<br />
0 8,000 16,000 32,000 48,000 64,000<br />
0 8,000 16,000 32,000 River<br />
48,000 64,000<br />
U.S 301 BALDWIN-MAXVILLE RD<br />
Future Land Use*<br />
OLD PLANK RD<br />
CHAFFEE RD<br />
COMMO N WEALTH AVE<br />
Recreation Data and Open provided Space by Planning and Development Department<br />
* 2030 Comprehensive Plan, Future Land Use Element Map L-19<br />
BLAIR RD<br />
PLUMMER RD<br />
YELLOW WATER RD<br />
U.S. 301 BALDWIN-BRYCEVILLE RD<br />
YELLOW WATER RD<br />
JONES RD<br />
OLD MIDDLEBURG RD<br />
I-10<br />
NORMANDY<br />
I-10<br />
JONES RD<br />
BEAVER ST<br />
SHINDLER DR<br />
BEAVER ST<br />
BULLS BAY HWY<br />
FOURAKER RD<br />
WESTPORT RD<br />
NEW KINGS RD<br />
OLD KINGS RD<br />
GARDEN<br />
RICKER RD<br />
IMESON RD<br />
OTIS RD<br />
OTIS RD<br />
U.S 301 BALDWIN-MAXVILLE RD<br />
NORMANDY BLVD<br />
NORMANDY BLVD<br />
RAMPART RD<br />
PICKETTVILLE RD<br />
OLD MIDDLEBURG RD<br />
I-295<br />
LANE AVE<br />
LANE AVE<br />
LEM TURNER RD<br />
JAMMES RD<br />
BEAVER ST<br />
BLANDING BLVD<br />
I-10<br />
EDGEWOOD AVE<br />
U.S. 301 BALDWIN-BRYCEVILLE RD<br />
SEABOARD AVE<br />
YELLOW WATER RD<br />
LAKE SHOR<br />
COLLINS RD<br />
I-295<br />
TROUT RIVER BLVD<br />
EDGEWOOD AVE<br />
BLVD<br />
ORTEGA<br />
I-10<br />
45th ST<br />
McDUFF AVE<br />
ROOSEVELT BLVD<br />
BEAVER ST<br />
ROOSEVELT BLVD<br />
KINGS RD<br />
OLD PLANK RD<br />
KING ST<br />
PA RK ST<br />
OLD PLANK RD<br />
I-295<br />
EDGEWOOD AVE<br />
MONCRIEF RD<br />
RIVERSIDE A V<br />
CHAFFEE RD<br />
CHAFFEE RD<br />
OTIS RD<br />
NORMANDY BLVD<br />
PECAN PARK RD<br />
I-95<br />
BAY ST<br />
Fu ler<br />
Wa ren<br />
Bridge<br />
Bridge<br />
Henry H. Buckman Bridge<br />
AIRPORT RD<br />
BROAD ST<br />
BEAVER ST<br />
ST. Elmo<br />
Acosta<br />
BLAIR RD<br />
I-95<br />
ORANGE<br />
MAND<br />
PECAN PARK RD<br />
PLUMMER RD<br />
COMMO N WEALTH AVE<br />
MAIN ST<br />
STATE ST<br />
Bridge<br />
SAN MA R CO B<br />
Alsop<br />
John T.<br />
HENDRICKS AVE<br />
MANDARIN RD<br />
B RADY<br />
LIBERTY ST<br />
COMMO N WEALTH AVE<br />
SAN<br />
I-10<br />
JOSE BLVD<br />
RIN R D<br />
BUSCH DR E<br />
I-95<br />
ST A UGUSTINE RD<br />
SC OTT MILL RD<br />
SAN JOSE BLVD<br />
Bridge<br />
CRYSTAL SPRINGS RD<br />
103rd ST<br />
JONES RD<br />
NORMANDY<br />
AND AVE<br />
TALLEYR<br />
Isaiah D.<br />
Hart<br />
MAIN ST<br />
EASTPORT RD<br />
DUVAL STATION RD<br />
HECKSCHER DR<br />
GARDEN ST<br />
BEACH BLVD<br />
EMERSON ST<br />
JONES RD<br />
PHILIPS HWY<br />
BEAUCLERC RD<br />
SAN JOSE BLVD<br />
POWERS AVE<br />
HARTLEY RD<br />
LORETTO RD<br />
P U<br />
LASKI RD<br />
UNIVERSITY B LVD<br />
OLD<br />
ULINGTON CREEK RD<br />
SHINDLER DR<br />
STARRATT RD<br />
ATLANTIC BL VD<br />
HART EXPY<br />
NEW BERLIN RD<br />
UNIVERSITY BLVD<br />
PRITCHARD RD<br />
BULLS BAY HWY<br />
KINGS RD<br />
EASTPORT RD<br />
BAYMEADOWS RD<br />
HERLONG RD<br />
CESERY RD<br />
HOOD LANDING RD<br />
YELLOW BLUFF RD<br />
Figure 3 - City of <strong>Jacksonville</strong> Comprehensive Plan 2030 - Future Land Use Map<br />
OLD MIDDLEBURG RD<br />
OLD PLANK RD<br />
CRYSTAL SPRINGS RD<br />
Data provided by Planning and September, Development 2009Department<br />
Duval County<br />
Developed by James M. Reed, Content AICP intended - jreed@coj.net for illustrative purposes only.<br />
September, 2009<br />
0 8,000 16,000<br />
Content intended for illustrative purposes only.<br />
32,000 48,000<br />
Feet<br />
64,000<br />
U.S. 301 BALDWIN-BRYCEVILLE RD<br />
OLD PLANK RD<br />
Public Buildings and Facilities<br />
* 2030 Comprehensive Plan, Future Land Use Element Map L-19<br />
Regional Commercial<br />
U.S. 301 BALDWIN-BRYCEVILLE RD<br />
YELLOW WATER RD<br />
I-10<br />
BEAVER ST<br />
OTIS RD<br />
NORMANDY BLVD<br />
CHAFFEE RD<br />
COMMO N WEALTH AVE<br />
* 2030 Comprehensive Plan, Future Land Use Element Map L-19<br />
I-10<br />
U.S 301 BALDWIN-MAXVILLE RD<br />
U.S. 301 BALDWIN-BRYCEVILLE RD<br />
U.S. 301 BALDWIN-BRYCEVILLE RD<br />
YELLOW WATER RD<br />
I-10<br />
I-10<br />
BEAVER ST<br />
BEAVER ST<br />
I-10<br />
OTIS RD<br />
NORMANDY BLVD<br />
BLAIR RD<br />
U.S 301 BALDWIN-MAXVILLE RD<br />
PLUMMER RD<br />
OTIS RD<br />
JONES RD<br />
OLD MIDDLEBURG RD<br />
NORMANDY<br />
Feet<br />
JONES RD<br />
SHINDLER DR<br />
OLD PLANK RD<br />
BULLS BAY HWY<br />
FOURAKER RD<br />
WESTPORT RD<br />
NEW KINGS RD<br />
OLD KINGS RD<br />
GARDEN<br />
U.S. 301 BALDWIN-BRYCEVILLE RD<br />
CHAFFEE RD<br />
RICKER RD<br />
IMESON RD<br />
YELLOW WATER RD<br />
RAMPART RD<br />
PICKETTVILLE RD<br />
BLAIR RD<br />
OLD MIDDLEBURG RD<br />
I-295<br />
PLUMMER RD<br />
COMMO N WEALTH AVE<br />
LANE AVE<br />
OLD PLANK RD<br />
LANE AVE<br />
I-10<br />
LEM TURNER RD<br />
JONES RD<br />
OLD MIDDLEBURG RD<br />
JAMMES RD<br />
BEAVER ST<br />
BEAVER ST<br />
NORMANDY<br />
E RD<br />
BLANDING BLVD<br />
JONES RD<br />
I-10<br />
EDGEWOOD AVE<br />
SEABOARD AVE<br />
SHINDLER DR<br />
LAKE SHOR<br />
I-295<br />
BLAIR RD<br />
PLUMMER RD<br />
TROUT RIVER BLVD<br />
COLLINS RD<br />
EDGEWOOD AVE<br />
BLVD<br />
I-10<br />
ORTEGA<br />
OTIS RD<br />
NORMANDY BLVD<br />
AIR RD<br />
BULLS BAY HWY<br />
103rd ST<br />
I-10<br />
FOURAKER RD<br />
JONES RD<br />
45th ST<br />
ROOSEVELT BLVD<br />
WESTPORT RD<br />
PLUMMER RD<br />
COMMO N WEALTH AVE<br />
NEW KINGS RD<br />
OLD KINGS RD<br />
GARDEN<br />
McDUFF AVE<br />
RICKER RD<br />
OLD MIDDLEBURG RD<br />
NORMANDY<br />
ROOSEVELT BLVD<br />
JONES RD<br />
IMESON RD<br />
KINGS RD<br />
KING ST<br />
PA RK ST<br />
RAMPART RD<br />
PICKETTVILLE RD<br />
I-295<br />
GARDEN ST<br />
EDGEWOOD AVE<br />
JONES RD<br />
OLD MIDDLEBURG RD<br />
CRYSTAL SPRINGS RD<br />
I-295<br />
MONCRIEF RD<br />
JONES RD<br />
LANE AVE<br />
LANE AVE<br />
RIVERSIDE A V<br />
CHAFFEE RD<br />
GARDEN ST<br />
LEM TURNER RD<br />
PRITCHARD RD<br />
JAMMES RD<br />
SHINDLER DR<br />
PECAN PARK RD<br />
COMMO N WEALTH AVE<br />
I-95<br />
BEAVER ST<br />
BLANDING BLVD<br />
I-10<br />
Wa ren<br />
Bridge<br />
BLAIR RD<br />
HERLONG RD<br />
COLLINS RD<br />
PLUMMER RD<br />
BULLS BAY HWY<br />
Bridge<br />
COLLINS RD<br />
A R GYLE<br />
A R GYLE<br />
AIRPORT RD<br />
BROAD ST<br />
BEAVER ST<br />
BAY ST<br />
Fu ler<br />
Henry H. Buckman Bridge<br />
PRITCHARD RD<br />
BULLS BAY HWY<br />
EDGEWOOD AVE<br />
ST. Elmo<br />
Acosta<br />
SEABOARD AVE<br />
I-95<br />
ORANGE<br />
MAND<br />
PECAN PARK RD<br />
MAIN ST<br />
STATE ST<br />
Bridge<br />
SAN MA R CO B<br />
LAKE SHOR<br />
I-295<br />
FOURAKER RD<br />
PARENTAL HOME RD<br />
HOOD RD<br />
WESTPORT FOURAKER RD RD<br />
WESTPORT RD<br />
JONES RD<br />
OLD MIDDLEBURG RD<br />
GARDEN<br />
GARDEN<br />
YELLOW BLUFF RD<br />
NEW KINGS RD<br />
OLD KINGS RD<br />
NORMANDY<br />
NEW KINGS RD<br />
OLD KINGS RD<br />
HENDRICKS AVE<br />
MANDARIN RD<br />
B RADY<br />
TROUT RIVER BLVD<br />
Alsop<br />
John T.<br />
LIBERTY ST<br />
SAN<br />
COLLINS RD<br />
JOSE BLVD<br />
RIN R D<br />
L ONE STAR<br />
ARLING TON RD<br />
ALTAMA RD<br />
RICKER RD<br />
I-95<br />
BELFORT R D<br />
ST. AUGUSTINE RD<br />
RICKER RD<br />
IMESON RD<br />
IMESON RD<br />
JONES RD<br />
H OGAN RD<br />
J. TURNER BUTLER BLVD<br />
PHILIPS HWY<br />
MONCRIEF RD<br />
BUSCH DR E<br />
OLD PLANK RD<br />
EDGEWOOD AVE<br />
BLVD<br />
ORTEGA<br />
NEW KINGS RD<br />
OLD KINGS RD<br />
GARDEN<br />
IMESON RD<br />
45th ST<br />
McDUFF AVE<br />
ROOSEVELT BLVD<br />
MONCRIEF RD<br />
I-95<br />
ST A UGUSTINE RD<br />
ROOSEVELT BLVD<br />
SHINDLER DR<br />
RAMPART RD<br />
RAMPART RD<br />
PICKETTVILLE RD<br />
PICKETTVILLE RD<br />
PARK CITY RD<br />
SC OTT MILL RD<br />
PARK CITY RD<br />
SO UTHSIDE BLVD<br />
NEW BERLIN RD<br />
CEDAR POINT RD<br />
Broward Bridge<br />
OLD MIDDLEBURG RD<br />
I-295<br />
BULLS BAY HWY<br />
OLD MIDDLEBURG RD<br />
SAN JOSE BLVD<br />
Bridge<br />
I-295<br />
AND AVE<br />
TALLEYR<br />
Isaiah D.<br />
Hart<br />
MAIN ST<br />
DUVAL STATION RD<br />
HECKSCHER DR<br />
EMERSON ST<br />
BEAUCLERC RD<br />
PICKETTVILLE RD<br />
EASTPORT RD<br />
KINGS RD<br />
KING ST<br />
PA RK ST<br />
CHAFFEE RD<br />
BEACH BLVD<br />
PHILIPS HWY<br />
MONCRIEF RD<br />
I-295<br />
Napoleon Bonaparte<br />
IDE CONNECTOR<br />
SOUTH S<br />
LANE AVE<br />
SAN JOSE BLVD<br />
LANE AVE<br />
FOURAKER RD<br />
WESTPORT RD<br />
LANE AVE<br />
LANE AVE<br />
POWERS AVE<br />
MORSE AVE<br />
HARTLEY RD<br />
LORETTO RD<br />
MORSE AVE<br />
BLVD<br />
BLVD<br />
LEM TURNER RD<br />
LEM TURNER RD<br />
NEW KINGS RD<br />
OLD KINGS RD<br />
DUNN AVE<br />
GARDEN<br />
DUNN AVE<br />
5th AVE<br />
BONEY RD<br />
MONUMENT RD<br />
9-A<br />
BLANDING BLVD<br />
I-10<br />
ST JOHNS BLUFF RD<br />
COMMONWEALTH AVE<br />
RICKER RD<br />
IMESON RD<br />
SAN JUAN<br />
JAMMES RD<br />
OLD MIDDLEBURG RD<br />
BEAVER ST<br />
RAMPART RD<br />
PICKETTVILLE RD<br />
5th AVE<br />
COMMONWEALTH AVE<br />
UNIVERSITY B LVD<br />
SAN JUAN<br />
OLD<br />
ULINGTON CREEK RD<br />
OLD MIDDLEBURG RD<br />
P U<br />
LASKI RD<br />
EDGEWOOD AVE<br />
MONCRIEF RD<br />
STARRATT RD<br />
RIVERSIDE A V<br />
ANE AVE<br />
ATLANTIC BL VD<br />
LANE AVE<br />
HART EXPY<br />
JAMMES RD<br />
NEW BERLIN RD<br />
UNIVERSITY BLVD<br />
BEAVER ST<br />
KINGS RD<br />
EASTPORT RD<br />
BLANDING BLVD<br />
I-295<br />
HOOD LANDING RD<br />
I-10<br />
YELLOW BLUFF RD<br />
COMMO N WEALTH AVE<br />
BLAIR RD<br />
LEM TURNER RD<br />
DUNN AVE<br />
BAYMEADOWS RD<br />
5th AVE<br />
PECAN PARK RD<br />
PLUMMER RD<br />
I-95<br />
Wa ren<br />
Bridge<br />
CESERY RD<br />
Bridge<br />
I-10<br />
LANE AVE<br />
HECKSCHER DR<br />
I-95<br />
LANE AVE<br />
EDGEWOOD AVE<br />
PARK ST<br />
PARENTAL HOME RD<br />
HOOD RD<br />
EDGEWOOD AVE<br />
SEABOARD AVE<br />
PARK ST<br />
SEABOARD AVE<br />
LEM TURNER RD<br />
JAMMES RD<br />
YELLOW BLUFF RD<br />
LAKE SHOR<br />
LAKE SHOR<br />
FORT CAROLINE RD<br />
CRYSTAL SPRINGS RD<br />
103rd ST<br />
COMMONWEALTH AVE<br />
BEAVER ST<br />
AIRPORT RD<br />
BROAD ST<br />
BEAVER ST<br />
BAY ST<br />
Fu ler<br />
ST. Elmo<br />
Acosta<br />
Henry H. Buckman Bridge<br />
I-10<br />
I-95<br />
ORANGE<br />
MAND<br />
PECAN PARK RD<br />
MAIN ST<br />
STATE ST<br />
Bridge<br />
SAN MA R CO B<br />
Alsop<br />
John T.<br />
JONES RD<br />
OLD MIDDLEBURG RD<br />
POST S T<br />
I-295<br />
TROUT RIVER BLVD<br />
BEAVER ST<br />
L ONE STAR<br />
ARLING TON RD<br />
I-295<br />
TROUT RIVER BLVD<br />
BLANDING BLVD<br />
I-10<br />
POST S T<br />
ALTAMA RD<br />
I-95<br />
ATLANTIC BLVD<br />
BLVD<br />
BELFORT R D<br />
118th ST<br />
BLVD<br />
COLLINS RD<br />
ST. AUGUSTINE RD<br />
EDGEWOOD AVE<br />
PARK ST<br />
HENDRICKS AVE<br />
NORMANDY<br />
PHILIPS HWY<br />
118th ST<br />
COLLINS RD<br />
EDGEWOOD AVE<br />
EDGEWOOD AVE<br />
SEABOARD AVE<br />
SOUTEL DR<br />
LAKE SHOR<br />
H OGAN RD<br />
J. TURNER BUTLER BLVD<br />
PHILIPS HWY<br />
MANDARIN RD<br />
B RADY<br />
LIBERTY ST<br />
SAN<br />
JOSE BLVD<br />
RIN R D<br />
POST S T<br />
GARDEN ST<br />
BUSCH DR E<br />
JONES RD<br />
I-95<br />
ST A UGUSTINE RD<br />
MT PLEASANT RD<br />
45th ST<br />
McDUFF AVE<br />
J. TURNER BUTLER BLVD<br />
ORTEGA<br />
EDGEWOOD AVE<br />
SC OTT MILL RD<br />
ORTEGA<br />
SOUTEL DR<br />
COLLINS RD<br />
I-295<br />
SO UTHSIDE BLVD<br />
NEW BERLIN RD<br />
TROUT RIVER BLVD<br />
SAN JOSE BLVD<br />
EDGEWOOD AVE<br />
TROUT RIVER BLVD<br />
EDGEWOOD AVE<br />
BLVD<br />
CEDAR POINT RD<br />
Broward Bridge<br />
45th ST<br />
Napoleon Bonaparte<br />
IDE CONNECTOR<br />
SOUTH S<br />
McDUFF AVE<br />
ORTEGA<br />
ROOSEVELT BLVD<br />
SHINDLER DR<br />
MAIN ST<br />
EASTPORT RD<br />
Bridge<br />
ROOSEVELT BLVD<br />
CEDAR POINT RD<br />
PRITCHARD RD<br />
AND AVE<br />
TALLEYR<br />
Isaiah D.<br />
Hart<br />
SOUTEL DR<br />
HECKSCHER DR<br />
BEACH BLVD<br />
EMERSON ST<br />
PHILIPS HWY<br />
BEAUCLERC RD<br />
DUVAL STATION RD<br />
HERLONG RD<br />
SAN JOSE BLVD<br />
ROOSEVELT BLVD<br />
45th ST<br />
McDUFF AVE<br />
ROOSEVELT BLVD<br />
ROOSEVELT BLVD<br />
BULLS BAY HWY<br />
KINGS RD<br />
KING ST<br />
PA RK ST<br />
GIRVIN RD<br />
KINGS RD<br />
KING ST<br />
ROOSEVELT BLVD<br />
PA RK ST<br />
COLLINS RD<br />
45th ST<br />
McDUFF AVE<br />
POWERS AVE<br />
HARTLEY RD<br />
LORETTO RD<br />
P U<br />
UNIVERSITY B LVD<br />
OLD<br />
ULINGTON CREEK RD<br />
STARRATT RD<br />
LASKI RD<br />
ATLANTIC BL VD<br />
HART EXPY<br />
A R GYLE<br />
BONEY RD<br />
I-295<br />
KINGS RD<br />
KING ST<br />
PA RK ST<br />
I-295<br />
MONUMENT RD<br />
9-A<br />
KINGS RD<br />
KING ST<br />
PA RK ST<br />
NEW BERLIN RD<br />
UNIVERSITY BLVD<br />
KINGS RD<br />
EASTPORT RD<br />
EDGEWOOD AVE<br />
MONCRIEF RD<br />
EDGEWOOD AVE<br />
EDGEWOOD AVE<br />
FOURAKER RD<br />
I-295<br />
BAYMEADOWS RD<br />
WESTPORT RD<br />
CESERY RD<br />
MONCRIEF RD<br />
ST JOHNS BLUFF RD<br />
HODGES BLVD<br />
HOOD LANDING RD<br />
HECKSCHER DR<br />
MONCRIEF RD<br />
FORT CAROLINE RD<br />
A1A<br />
RIVERSIDE A V<br />
RIVERSIDE A V<br />
RIVERSIDE A V<br />
I-95<br />
NEW KINGS RD<br />
YELLOW BLUFF RD<br />
OLD KINGS RD<br />
GARDEN<br />
RICKER RD<br />
IMESON RD<br />
PARENTAL HOME RD<br />
HOOD RD<br />
ST<br />
FOREST<br />
EDGEWOOD AVE<br />
MONCRIEF RD<br />
RIVERSIDE A V<br />
YELLOW BLUFF RD<br />
HECKSCH ER DR<br />
SAN PABLO RD<br />
PECAN PARK RD<br />
MONCRIEF RD<br />
L ONE STAR<br />
ARLING TON RD<br />
ALTAMA RD<br />
I-95<br />
BAY ST<br />
Fu ler<br />
Wa ren<br />
Bridge<br />
ATLANTIC BLVD<br />
RAMPART RD<br />
PECAN PARK RD<br />
PECAN PARK RD<br />
I-95<br />
Bridge<br />
I-95<br />
BAY ST<br />
Fu ler<br />
Warren<br />
Bridge<br />
Henry H. Buckman Bridge<br />
AIRPORT RD<br />
BROAD ST<br />
BEAVER ST<br />
BAY ST<br />
Acosta<br />
Bridge<br />
OCEAN ST<br />
ST. Elmo<br />
Fu ler<br />
Warren<br />
AIRPORT RD<br />
A1A<br />
DUVAL RD<br />
A1A<br />
Henry H. Buckman Bridge<br />
I-95<br />
J. TURNER BUTLER BLVD<br />
Bridge<br />
I-95<br />
BROAD ST<br />
BEAVER ST<br />
ST. Elmo<br />
Acosta<br />
ORANGE<br />
MAND<br />
PECAN PARK RD<br />
MAIN ST<br />
STATE ST<br />
Bridge<br />
SAN MA R CO B<br />
AIRPORT RD<br />
DUVAL RD<br />
Bridge<br />
MT PLEASANT RD<br />
BROAD ST<br />
BEAVER ST<br />
Alsop<br />
John T.<br />
ST. Elmo<br />
Acosta<br />
HENDRICKS AVE<br />
PECAN PARK RD<br />
20th ST EXPY<br />
8th ST<br />
MAIN ST<br />
STATE ST<br />
Bridge<br />
SAN MA R CO B<br />
Alsop<br />
John T.<br />
MANDARIN RD<br />
B RADY<br />
Henry H. Buckman Bridge<br />
PHILIPS HWY<br />
PICKETTVILLE RD<br />
PARK CITY RD<br />
OLD MIDDLEBURG RD<br />
BELFORT R D<br />
I-295<br />
LANE AVE<br />
H OGAN RD<br />
PECAN PARK RD<br />
LANE AVE<br />
WILSON BLVD<br />
J. TURNER BUTLER BLVD<br />
I-95<br />
PHILIPS HWY<br />
ST. AUGUSTINE RD<br />
LIBERTY ST<br />
SAN<br />
J. TURNER BUTLER BLVD<br />
MORSE AVE<br />
I-95<br />
BAY ST<br />
Fu ler<br />
Warren<br />
Bridge<br />
BLVD<br />
LEM TURNER RD<br />
JOSE BLVD<br />
RIN R D<br />
I-95<br />
ORANGE<br />
MAND<br />
PECAN PARK RD<br />
DUNN AVE<br />
CEDAR POINT RD<br />
MAIN ST<br />
BUSCH DR E<br />
20th ST EXPY<br />
8th ST<br />
STATE ST<br />
Bridge<br />
SAN MA R CO B<br />
Alsop<br />
John T.<br />
LIBERTY ST<br />
SAN<br />
I-95<br />
HENDRICKS AVE<br />
ST A UGUSTINE RD<br />
HENDRICKS AVE<br />
SC OTT MILL RD<br />
JOSE BLVD<br />
MANDARIN RD<br />
B RADY<br />
5th AVE<br />
COMMONWEALTH AVE<br />
SAN JUAN<br />
AIRPORT RD<br />
DUVAL RD<br />
Bridge<br />
SO UTHSIDE BLVD<br />
BROAD ST<br />
BEAVER ST<br />
ST. Elmo<br />
Acosta<br />
NEW BERLIN RD<br />
CEDAR POINT RD<br />
Broward Bridge<br />
Napoleon Bonaparte<br />
IDE CONNECTOR<br />
SOUTH S<br />
JAMMES RD<br />
I-95<br />
BEAVER ST<br />
LIBERTY ST<br />
SAN<br />
GIRVIN RD<br />
BLANDING BLVD<br />
JOSE BLVD<br />
RD<br />
RIN R D<br />
I-10<br />
PECAN PARK RD<br />
20th ST EXPY<br />
8th ST<br />
MAIN ST<br />
STATE ST<br />
Bridge<br />
SAN MA R CO B<br />
Alsop<br />
John T.<br />
MANDARIN RD<br />
SAN JOSE BLVD<br />
Bridge<br />
AND AVE<br />
I-95<br />
MAIN ST<br />
EASTPORT RD<br />
HECKSCHER DR<br />
BUSCH DR E<br />
TALLEYR<br />
Isaiah D.<br />
Hart<br />
BEACH BLVD<br />
EMERSON ST<br />
PHILIPS HWY<br />
HODGES BLVD<br />
I-95<br />
BEAUCLERC RD<br />
PICKERS RD<br />
LIBERTY ST<br />
HENDRICKS AVE<br />
BONEY RD<br />
I-95<br />
ST A UGUSTINE RD<br />
DUVAL STATION RD<br />
BUSCH DR E<br />
EDGEWOOD AVE<br />
MONUMENT RD<br />
9-A<br />
PARK ST<br />
I-95<br />
ST A UGUSTINE RD<br />
SEABOARD AVE<br />
I-95<br />
ST JOHNS BLUFF RD<br />
LAKE SHOR<br />
SAN JOSE BLVD<br />
SC OTT MILL RD<br />
POWERS AVE<br />
HARTLEY RD<br />
BUSCH DR E<br />
I-295<br />
LORETTO RD<br />
P U<br />
LASKI RD<br />
SAN JOSE BLVD<br />
Bridge<br />
AND AVE<br />
TALLEYR<br />
Isaiah D.<br />
Hart<br />
MAIN ST<br />
EASTPORT RD<br />
UNIVERSITY B LVD<br />
OLD<br />
ULINGTON CREEK RD<br />
SC OTT MILL RD<br />
A1A<br />
STARRATT RD<br />
POST S T<br />
ATLANTIC BL VD<br />
HART EXPY<br />
SAN JOSE BLVD<br />
Bridge<br />
UNIVERSITY BLVD<br />
DUVAL STATION RD<br />
HECKSCHER DR<br />
BEACH BLVD<br />
EMERSON ST<br />
PHILIPS HWY<br />
BEAUCLERC RD<br />
NEW BERLIN RD<br />
KINGS RD<br />
MAIN ST<br />
EASTPORT RD<br />
TROUT RIVER BLVD<br />
HECKSCHER DR<br />
HECKSCH ER DR<br />
SAN PABLO RD<br />
BLVD<br />
COLLINS RD<br />
EASTPORT RD<br />
BAYMEADOWS RD<br />
J<br />
AND AVE<br />
TALLEYR<br />
Isaiah D.<br />
Hart<br />
DUVAL STATION RD<br />
CESERY RD<br />
HOOD LANDING RD<br />
SAN JOSE BLVD<br />
YELLOW BLUFF RD<br />
HECKSCHER DR<br />
BEACH BLVD<br />
EMERSON ST<br />
PHILIPS HWY<br />
TIMUQUANA RD<br />
I-95<br />
118th ST<br />
I-95<br />
FORT CAROLINE RD<br />
EDGEWOOD AVE<br />
ORTEGA<br />
BEAUCLERC RD<br />
Bridge<br />
AND AVE<br />
TALLEYR<br />
SOUTEL DR<br />
MAIN ST<br />
OCEAN ST<br />
ATLANTIC BLVD<br />
EASTPORT RD<br />
PHILIPS HWY<br />
A1A<br />
SAN JOSE BLVD<br />
A1A<br />
P U<br />
POWERS AVE<br />
HARTLEY RD<br />
STARRATT RD<br />
LASKI RD<br />
PARENTAL HOME RD<br />
POWERS AVE<br />
ATLANTIC BL VD<br />
HOOD RD<br />
HARTLEY RD<br />
LORETTO RD<br />
P U<br />
LASKI RD<br />
45th ST<br />
ROOSEVELT BLVD<br />
HART EXPY<br />
UNIVERSITY B LVD<br />
OLD<br />
YELLOW BLUFF RD<br />
L ONE STAR<br />
ARLING TON RD<br />
ALTAMA RD<br />
UNIVERSITY B LVD<br />
OLD<br />
ULINGTON CREEK RD<br />
Isaiah D.<br />
Hart<br />
STARRATT RD<br />
McDUFF AVE<br />
ATLANTIC BL VD<br />
HART EXPY<br />
DUVAL STATION RD<br />
J. TURNER BUTLER BLVD<br />
HECKSCHER DR<br />
BEACH BLVD<br />
EMERSON ST<br />
P U<br />
MT PLEASANT RD<br />
J. TURNER BUTLER BLVD<br />
LASKI RD<br />
ROOSEVELT BLVD<br />
I-95<br />
18<br />
NEW BERLIN RD<br />
UNIVERSITY BLVD<br />
9A<br />
BOWDEN RD<br />
KINGS RD<br />
EASTPORT RD<br />
BELFORT R D<br />
ST. AUGUSTINE RD<br />
BAYMEADOWS RD<br />
H OGAN RD<br />
CESERY RD<br />
J. TURNER BUTLER BLVD<br />
PHILIPS HWY<br />
NEW BERLIN RD<br />
UNIVERSITY BLVD<br />
9A<br />
BOWDEN RD<br />
KINGS RD<br />
I-295<br />
EASTPORT RD<br />
KINGS RD<br />
KING ST<br />
PA RK ST<br />
STARRATT RD<br />
CEDAR POINT RD<br />
BAYMEADOWS RD<br />
ATLANTIC BL VD<br />
HART EXPY<br />
CESERY RD<br />
SUNBEAM RD<br />
UNIVERSITY BLVD<br />
HOOD LANDING RD<br />
SUNBEAM RD<br />
FORT CAROLINE RD<br />
PARENTAL HOME RD<br />
HOOD RD<br />
I-295<br />
YELLOW BLUFF RD<br />
SO UTHSIDE BLVD<br />
NEW BERLIN RD<br />
CEDAR POINT RD<br />
Broward Bridge<br />
Napoleon Bonaparte<br />
IDE CONNECTOR<br />
SOUTH S<br />
YELLOW BLUFF RD<br />
FORT CAROLINE RD<br />
PARENTAL HOME RD<br />
HOOD RD<br />
I-295<br />
YELLOW BLUFF RD<br />
DUNN AVE<br />
EDGEWOOD AVE<br />
NEW BERLIN RD<br />
9A<br />
EASTPORT RD<br />
GIRVIN RD<br />
MONCRIEF RD<br />
CESERY RD<br />
YELLOW BLUFF RD<br />
RIVERSIDE A V<br />
HODGES BLVD<br />
A1A<br />
YELLOW BLUFF RD<br />
TOWNSEND RD<br />
L ONE STAR<br />
ARLING TON RD<br />
ALTAMA RD<br />
I-95<br />
BELF<br />
J. TURNER<br />
GREENLAND<br />
BO<br />
MONU<br />
9-A<br />
BELF<br />
R<br />
ARLINGTO<br />
I-95<br />
GREENLAND<br />
ST. AUGUSTINE R<br />
PHILIPS HWY<br />
JULINGTON CR E EK RD<br />
TOWNSEND RD<br />
L ONE STAR<br />
ARLING TON RD<br />
PECAN<br />
I-95<br />
HECKSCH ER D<br />
SAN PABLO RD<br />
BEA<br />
BAY ST<br />
Fu ler<br />
Warren<br />
Bridge<br />
ALTAMA RD<br />
R<br />
ARLINGTO<br />
YELLOW BLUFF RD<br />
J. TURNER<br />
Henry H. Buckm<br />
PHILIPS HWY<br />
FORT CAROLINE RD<br />
TOWNSEND RD<br />
L ONE STAR<br />
ARLING TON RD<br />
ALTAMA RD<br />
R<br />
ARLINGTO
City of <strong>Jacksonville</strong><br />
<strong>Policy</strong> <strong>Framework</strong> for Transit-Oriented Development<br />
Zoning Code<br />
The City of <strong>Jacksonville</strong>’s Zoning Ordinance includes a section for TOD that classifies sites within ½ mile<br />
of transit based on locational criteria. The ordinance is intended to implement specific Comprehensive Plan<br />
policies to allow increased residential density, reduced automobile parking, pedestrian oriented open space,<br />
mixed use, and reduced setbacks in areas designated for mass transit stations.<br />
The ordinance classifies areas within ¼ mile of transit stations as TOD-1 and areas between ¼ and ½ mile as<br />
TOD-2. TOD-1 and TOD-2 are allowed additional density based on applicable future land use categories<br />
in the Comprehensive Plan. In addition to the density and intensity requirements, the ordinance specifies<br />
development regulations for streetscape design, parking, and pedestrian access.<br />
The ordinance lists some specific areas that are suited for TOD and requires the preparation of a station area<br />
master plan through a public process for the station areas. Form based zoning principles and consistency with<br />
<strong>Jacksonville</strong> Design Guidelines and Best Practices Handbook are required for the TOD overlay and site plan.<br />
Design Guidelines<br />
The <strong>Jacksonville</strong> Design Guidelines and Best Practices Handbook provides architectural and site design<br />
guidance for commercial development and redevelopment in the city. The handbook includes guidance for<br />
pedestrian environments, signage, landscape and buffering, lighting, and parking. The guidelines currently in<br />
place only apply to commercial. The Mobility Plan and Future Land Use Element recommend incorporating<br />
the design guidelines into the Land Development Regulations.<br />
The handbook guidance is not specific to TODs but are generally applicable to urban form issues. The TOD<br />
zoning ordinance provides specific guidance on streetscape and parking requirements for TOD.<br />
Figure 4 - Sample Graphics from <strong>Jacksonville</strong> Design Guidelines and Best Practices Handbook<br />
Current Status of Transit and TOD | 7
City of <strong>Jacksonville</strong><br />
<strong>Policy</strong> <strong>Framework</strong> for Transit-Oriented Development<br />
Next Steps For Implementation<br />
Implementing TOD is a multi-step process involving<br />
several local planning, transportation, and transit<br />
agencies. Some key steps are outlined below.<br />
Amendment of Comprehensive<br />
Plan to adopt Transit Corridor<br />
and Station AREA Typologies<br />
This step can occur immediately based on JTA’s<br />
Transit Initiatives Map and the corridor and station<br />
area intensity, density, and use recommendations in<br />
this document. Besides amending the comprehensive<br />
plan to include transit priority corridors and station<br />
typologies, this step requires the adoption of the<br />
Design Guidelines for TOD in the land development<br />
regulations/zoning code. The City of <strong>Jacksonville</strong> is<br />
primarily responsible for this amendment with input<br />
from JTA.<br />
Designation of Transit<br />
Priority Corridors within a<br />
½ mile area of influence from<br />
planned Transit alignments<br />
This step occurs after the transit corridors have<br />
been determined and designated as transit priority<br />
corridors. For the City of <strong>Jacksonville</strong>, several rapid<br />
transit corridors (light rail and bus) have already been<br />
designated as such based on JTA’s Transit Initiatives<br />
Map. The commuter rail corridor could also be<br />
designated as a transit corridor. This initial designation<br />
allows for consideration of transit supportive density,<br />
intensity and uses adopted in the Comprehensive<br />
Plan within the general area of influence of the<br />
transit corridors. This step is also primarily led by the<br />
City of <strong>Jacksonville</strong> in close coordination with JTA’s<br />
alternatives analysis process.<br />
Designation of TOD Future Land<br />
Use Floating Zone within a ½<br />
mile radius of planned Rapid<br />
Transit station locations<br />
This step occurs after the rapid transit alignments<br />
have been established based on an alternatives analysis<br />
process initiated by JTA. This initial designation<br />
allows for consideration of transit supportive density,<br />
intensity and uses adopted in the Comprehensive<br />
Plan within the general area of influence of the<br />
transit stations. This step is also primarily led by the<br />
City of <strong>Jacksonville</strong> in close coordination with JTA’s<br />
Amend Policies and Adopt TOD<br />
Typologies and Guidelines<br />
Designate Transit Corridors<br />
and Finalize Alignments<br />
Designate Floating<br />
Zone for TOD<br />
Identify Station Area<br />
Boundaries and Initiate<br />
planning process<br />
Create and Implement<br />
Station Area Master Plans<br />
8 | Current Status of Transit and TOD
City of <strong>Jacksonville</strong><br />
<strong>Policy</strong> <strong>Framework</strong> for Transit-Oriented Development<br />
alternatives analysis process but requires the adoption<br />
of an inter-local agreement to determine project<br />
roles and responsibilities for all local planning,<br />
transportation, and transit agencies.<br />
Determination of specific station<br />
area boundaries for each Rapid<br />
Transit station location<br />
This step follows the alternatives analysis process and<br />
the adoption of a locally preferred alternative. Specific<br />
boundaries for station areas are determined and a<br />
public process for station area planning is initiated.<br />
The station area planning process is led by the City of<br />
<strong>Jacksonville</strong> and guided by the inter-local agreement.<br />
The adoption of station area plans requires areawide<br />
rezoning based on adopted TOD framework<br />
in the land development regulations/zoning code.<br />
A priority ranking should be assigned to the station<br />
areas for purposes of conducting site specific TOD<br />
station area master plans.<br />
Creation of Station<br />
Area Master Plans<br />
The art of place making, namely designing stations<br />
areas for individual character, livability, walkability,<br />
diversity and vitality, happens at the station area<br />
master planning and implementation phase. The<br />
Design Guidelines for TOD provide a communitywide<br />
typology of place types, but does not<br />
provide specific details or implementation actions<br />
customized for each individual station area. Through<br />
master planning each station has the opportunity<br />
to customize its TOD potential. This phase will<br />
require a public process that involves citizens, local<br />
government, private developers and designers who<br />
can come together to address the potential urban<br />
design elements that make TOD work. These master<br />
plans will outline a station area vision and design<br />
implementation plans to help achieve that vision.<br />
The process will require a precise land use inventory<br />
and community context evaluation to understand<br />
the general market forces and social dynamics at<br />
play. The plans should develop station specific design<br />
standards and mobility strategies to achieve that<br />
vision. Implementation plans should address phasing<br />
and milestones to monitor progress, identify obstacles<br />
and potential solutions, identify public and private<br />
financing, and assign roles and responsibilities.<br />
Station Area Plan<br />
Analyze existing land use to determine vacant land and<br />
opportunities for redevelopment.<br />
Identify opportunities for infill and new transit-oriented<br />
development.<br />
Determine appropriate mix of uses and building heights.<br />
Current Status of Transit and TOD | 9
City of <strong>Jacksonville</strong><br />
<strong>Policy</strong> <strong>Framework</strong> for Transit-Oriented Development<br />
What is Required to Make TOD Work?<br />
While the fundamental elements of TOD are easy<br />
to describe, successfully implementing TOD can<br />
be challenging. TOD policies should work toward<br />
creating a development pattern that takes full<br />
advantage of the capacity for people to walk, and their<br />
desire to ride transit, while remaining compatible<br />
with market forces, personal preferences and existing<br />
community contexts.<br />
Market Forces<br />
Development and re-development projects<br />
depend heavily on market conditions, including<br />
regional population and employment growth in<br />
the <strong>Jacksonville</strong> area and the ability for developers,<br />
residents, and businesses to pay to absorb new space<br />
created by TOD projects. TOD policies and design<br />
standards need to have sufficient flexibility to allow<br />
walkable, transit-friendly communities to take shape<br />
in an affordable manner.<br />
Personal Preferences<br />
Market demand indicates two things: the ability<br />
to pay and the willingness to pay. Preferences for<br />
housing types and community design elements vary<br />
among individuals depending on a host of factors like<br />
family size, income, and age. The mixed use character<br />
of TOD provides an opportunity to cater to an array<br />
of potential residents and businesses. TOD policies<br />
should be sensitive to the appropriate design, scale,<br />
and mix of uses to account for varying preferences.<br />
Mockingbird Station, Dallas, Texas<br />
Fruitvale Station, San Francisco Bay Area, California<br />
Existing Community Contexts<br />
TODs are not intended to be mere islands of transit<br />
and pedestrian activity. TOD policies should ensure<br />
that new and redevelopment projects integrate and<br />
blend neatly with the surrounding neighborhood<br />
contexts. This allows the TOD project to reinforce<br />
the existing community character and invites<br />
neighbors from the area to utilize alternative modes<br />
of transportation to reach local destinations.<br />
Capital Metro, Austin, Texas<br />
10 | What is Required to Make TOD Work
City of <strong>Jacksonville</strong><br />
<strong>Policy</strong> <strong>Framework</strong> for Transit-Oriented Development<br />
What Other Communities Are Doing to Implement Transit and TOD<br />
TOD is a development strategy that has gained momentum around the country and the state in recent years.<br />
Communities have sought to implement transit and TOD to provide a balanced transportation network,<br />
giving people an alternative to driving. A TOD strategy also minimizes the need to provide new infrastructure<br />
to serve metropolitan growth by utilizing existing facilities. This helps to revitalize urban centers and foster<br />
vibrant neighborhoods. A couple examples of TOD strategies taking shape in American cities are described in<br />
the boxes on this page.<br />
iles<br />
Tampa, Florida<br />
In the Tampa Bay region, Hillsborough<br />
Area Regional Transit (HART) is working<br />
to implement the area’s first light rail line<br />
connecting Tampa International Airport to the<br />
University of South Florida via Tampa’s urban<br />
core. The proposed rail line is an important<br />
first piece of the regional transit vision adopted<br />
by the Tampa Bay Regional <strong>Transportation</strong><br />
<strong>Authority</strong>. To meet ridership goals and<br />
enhance the light rail project’s competitiveness<br />
for federal funding, the City of Tampa and<br />
Hillsborough County have adopted TOD<br />
policies that define transit oriented districts,<br />
encourage pedestrian activity, and promote<br />
dense, mixed-use developments. The City’s<br />
TOD policies address the Federal Transit<br />
Administration’s (FTA) increased emphasis<br />
on development policies and land use/<br />
transportation coordination methods.<br />
Charlotte, North Carolina<br />
In the early 1990s, the City of Charlotte<br />
adopted a long term growth strategy that<br />
aimed to focus population and employment<br />
growth in the City’s existing urban centers and<br />
major transportation corridors. Transit and<br />
TOD were identified as critical components<br />
for successfully implementing the “Centers<br />
and Corridors” vision. To support the<br />
growth framework, the City established TOD<br />
districts and policies and began planning for<br />
rapid transit. In 2007, Charlotte completed<br />
construction of its first light rail line, part<br />
of a network of five proposed rapid transit<br />
corridors. With the City’s TOD policies in<br />
place, the LYNX Blue Line sparked a flurry of<br />
mixed use development along its alignment.<br />
As a result, ridership in the first several years<br />
of operation has vastly exceeded projects and<br />
further rapid transit projects are progressing<br />
through the planning stages.<br />
What is Required to Make TOD Work | 11
City of <strong>Jacksonville</strong><br />
<strong>Policy</strong> <strong>Framework</strong> for Transit-Oriented Development<br />
Federal Transit Administration<br />
To receive discretionary funds from the Federal Transit<br />
Administration (FTA) for transit improvements,<br />
<strong>Jacksonville</strong> competes with other localities from across<br />
the southeast and the country. The FTA is placing a<br />
heavy emphasis on land use planning when making<br />
funding recommendations, evaluating an area’s<br />
growth management strategies, transit supportive<br />
corridor policies, station area zoning regulations, and<br />
implementation tools. A comprehensive set of TOD<br />
policies will address each of these factors in detail,<br />
based on FTA’s guidance. As such, TOD policies will<br />
be critical in capturing federal dollars to build the<br />
transit systems that are necessary to keep <strong>Jacksonville</strong><br />
and other American cities running.<br />
Federal Transit Administration<br />
New Starts Program<br />
The New Starts program supports locally planned,<br />
implemented and operated transit capital<br />
investments. It is the federal government’s primary<br />
financial resource for funding new transit projects.<br />
The New Starts program funds various types of transit<br />
- commuter rail, heavy rail, light rail or Bus Rapid<br />
Transit – and is intended for large-scale projects. As<br />
required by the Safe, Accountable, Flexible, Efficient<br />
<strong>Transportation</strong> Equity Act: A Legacy for Users, the<br />
FTA must prioritize transit projects for funding. To<br />
be eligible for federal funding, a project must advance<br />
through the different project development phases<br />
of the New Starts program, including alternatives<br />
analysis, preliminary engineering, and final design.<br />
Alternatives Analysis<br />
Using the statutorily identified criteria, FTA evaluates<br />
projects as a condition for advancement into each<br />
project development phase of the program. New Starts<br />
projects must emerge from a regional, multimodal<br />
transportation planning process. The first two phases<br />
of the New Starts process - systems planning and<br />
alternatives analysis - address this requirement. The<br />
systems planning phase identifies the transportation<br />
needs of a region, while the alternatives analysis<br />
phase provides information on the benefits, costs,<br />
and impacts of different options, such as rail lines or<br />
bus routes, in a specific corridor versus a region. The<br />
alternatives analysis phase results in the selection of a<br />
locally preferred alternative, which is the New Starts<br />
project that FTA evaluates for funding.<br />
Mobility<br />
Improvements<br />
(20%)<br />
Public<br />
<strong>Transportation</strong><br />
Supportive<br />
Land Use (20%)<br />
Environmental<br />
Benefits (10%)<br />
Project<br />
Justification<br />
Rating<br />
Economic<br />
Development<br />
Effects (20%)<br />
Cost<br />
Effectiveness<br />
(20%)<br />
Operating<br />
Efficiencies<br />
(10%)<br />
12 | What is Required to Make TOD Work<br />
Figure 5 - Federal Transit Administration New Starts Project Justification Rating
City of <strong>Jacksonville</strong><br />
<strong>Policy</strong> <strong>Framework</strong> for Transit-Oriented Development<br />
Preliminary Engineering<br />
After a locally preferred alternative is selected, the<br />
project sponsor submits an application to FTA for<br />
the project to enter the preliminary engineering<br />
phase. When this phase is completed and federal<br />
environmental requirements under the National<br />
Environmental <strong>Policy</strong> Act are satisfied, FTA may<br />
approve the project’s advancement into final design.<br />
FTA may then recommend the project for a Full<br />
Funding Grant Agreement (FFGA) and advance the<br />
project into construction.<br />
Changes to New Starts Criteria<br />
In 2009, the FTA commenced a major update to the<br />
New Starts criteria. The proposed changes include<br />
a shift from reliance on cost effectiveness as the<br />
primary criteria to a greater emphasis on land use,<br />
economic development and the potential TOD<br />
within planned transit corridors and station areas.<br />
As of January 2010, the FTA put out a press release<br />
indicating the Administration will no longer target<br />
its funding recommendations only to projects that<br />
receive a Medium or better cost-effectiveness rating,<br />
but that a project must receive an overall rating of at<br />
least Medium and be expected to be ready funding.<br />
This recent change in effect de-emphasizes the costeffectiveness<br />
rating. If a project could demonstrate<br />
an overall rating of Medium or better it could be<br />
considered for funding, and cost-effectiveness alone<br />
will not be a limiting factor.<br />
Communities around the country seeking to position<br />
themselves for New Starts funding have begun to<br />
update land use policies to enable TOD. FTA is now<br />
incorporating levels of TOD policy readiness into the<br />
criteria for New Starts prioritization. Communities<br />
that have policies in place and demonstrated success<br />
in implementing projects with transit-supportive<br />
densities will now have an advantage in competing<br />
for New Starts funds.<br />
The project justification rating of a project seeking<br />
New Starts funding will be based on ratings for<br />
the following criteria with the weights shown<br />
in parentheses: mobility improvements (20%),<br />
environmental benefits (10%), cost effectiveness<br />
(20%), operating efficiencies (10%), economic<br />
development effects (20%), and public transportation<br />
supportive land use (20%). Figure 5 and Table 1<br />
illustrate and describe this ranking and criteria.<br />
Criteria<br />
Measures/Categories<br />
Mobility Improvements<br />
Measured by travel time benefits per project passenger mile,<br />
low-income households served, and employment near stations.<br />
Environmental Benefits<br />
Cost Effectiveness<br />
Operating Efficiencies<br />
Economic Development<br />
Transit Supportive Land Use & Future Patterns<br />
Other<br />
Measured by change in regional pollutant emissions, change in<br />
regional energy consumption, and EPA air quality designation.<br />
Measured as the cost per hour of travel time saved.<br />
Measured by system operating cost per passenger mile.<br />
Measured by transit supportive plans and policies, performance<br />
and impacts of policies.<br />
Measured by existing land use, transit supportive plans and<br />
policies and performance, and impacts of policies.<br />
Includes a number of optional factors, including the projected<br />
economic impact of project.<br />
Table 1: Federal Transit Administration - New Starts Criteria and Measures<br />
What is Required to Make TOD Work | 13
City of <strong>Jacksonville</strong><br />
<strong>Policy</strong> <strong>Framework</strong> for Transit-Oriented Development<br />
Can TOD Really Be Effective in<br />
<strong>Jacksonville</strong>?<br />
In a word, yes. <strong>Jacksonville</strong> actually has a long history<br />
as a thriving transit city. Trains and street railroads<br />
played an integral part in the city’s early development.<br />
<strong>Jacksonville</strong>’s first train station opened in 1858, and<br />
as the city grew, so did its rail infrastructure. Boasting<br />
one of the best natural harbors in the Southeast,<br />
<strong>Jacksonville</strong> quickly became an important destination<br />
for people and goods from around Florida, the South,<br />
and the East Coast. At the peak of the railroad era in<br />
<strong>Jacksonville</strong>, the City’s rail terminal (now the Prime<br />
Osborne Convention Center) could accommodate<br />
more than 200 trains per day and served as many as<br />
100,000 passengers per day.<br />
At that time, local street railroads were the primary<br />
means of connecting <strong>Jacksonville</strong>’s urban and<br />
suburban neighborhoods. The first streetcars were<br />
powered by mules and horses, but by 1895 the city’s<br />
streetcar fleet was entirely electric. At its pinnacle,<br />
the <strong>Jacksonville</strong> street railway network extended over<br />
59 miles of track, served by 101 passenger cars. The<br />
streetcars were largely responsible for <strong>Jacksonville</strong>’s<br />
earliest suburban developments: Riverside,<br />
Springfield, Avondale, Ortega, Murray Hill, San<br />
Marco, and Fairfield were all “streetcar suburbs”<br />
oriented to the popular transit service.<br />
The Riverside Avenue street car line radiating out of<br />
downtown (upper right corner) gives rise to ‘streetcar<br />
neighborhoods.’ Close up from a 1893 map of <strong>Jacksonville</strong><br />
by Augustus Koch, US Library of Congress archives.<br />
San Marco Main Street, <strong>Jacksonville</strong><br />
Springfield, <strong>Jacksonville</strong><br />
14 | What is Required to Make TOD Work
City of <strong>Jacksonville</strong><br />
<strong>Policy</strong> <strong>Framework</strong> for Transit-Oriented Development<br />
The vast network of streetcars and intercity railroads<br />
have had a lasting effect on central <strong>Jacksonville</strong>’s urban<br />
form. The streetcar neighborhoods retain a high level<br />
of street connectivity, transit-supportive densities,<br />
and ample pedestrian facilities. These neighborhoods<br />
demonstrate that transit-friendly development<br />
patterns are viable and liveable in <strong>Jacksonville</strong>, and<br />
they are appropriate areas for redevelopment TOD<br />
projects. Similarly, suburban greenfield TOD<br />
projects can support high quality transit service in<br />
other burgeoning parts of the region.<br />
Several cities across the U.S. are reinvesting in<br />
streetcars, historic and modern, as part of their<br />
premium public transportation network. The cities<br />
of Tampa and Charlotte restored historic streetcar<br />
routes in their city centers. The city of Portland<br />
realized the revival of the Pearl District by investing<br />
in a new streetcar route through the district.<br />
Downtown <strong>Jacksonville</strong><br />
Streetcar Railroad Ports Bridges<br />
<strong>Jacksonville</strong>’s origins are closely tied to many transportation and transit investments illustrated in the above 1893 map of<br />
<strong>Jacksonville</strong> by Augustus Koch, US Library of Congress archives.<br />
What is Required to Make TOD Work | 15
City of <strong>Jacksonville</strong><br />
<strong>Policy</strong> <strong>Framework</strong> for Transit-Oriented Development<br />
Evaluation of TOD Potential<br />
To better understand the potential impact of TOD policies in defined transit corridors, an evaluation of<br />
each transit corridor was conducted. The TOD policies represent a potential intensification for different<br />
corridors. What exists today and what could be possible given the realization of a TOD buildout is necessary<br />
to understand the impacts on different transit corridors. This land use and buildout potential evaluation,<br />
detailed in Appendix A, Analysis of TOD Potential, was addressed in three major steps below:<br />
What exists today: To better understand what<br />
exists today a ‘virtual present’ is created for existing<br />
residential and employment densities. This ‘virtual<br />
present’ is created by analyzing the parcels that<br />
were in a half-mile distance, or buffer, on either<br />
side of a fixed-route transit corridors for existing<br />
land use. The present day jobs and households data<br />
from the regional travel demand model were then<br />
associated with residential and employment parcels<br />
to approximate where people currently live and work<br />
in each transit corridor. The findings are summarized<br />
by transit corridor in Appendix A, Tables 1-4.<br />
What could change: Evaluate the development and<br />
redevelopment potential for parcels based on analysis<br />
of existing land use classification and/or improvement<br />
and land value assessments. Every parcel in Duval<br />
County parcels contains land use codes and tax<br />
assessment data from the Department of Revenue.<br />
(DOR). These data were analyzed using GIS. The<br />
improvement value to land value ratios for parcels<br />
were calculated, averaged by land use type, and<br />
then grouped into development potential categories<br />
of: vacant/high potential, medium potential, low<br />
potential, full developed or unbuildable (no future<br />
potential) as explained in Appendix A, Table 5.<br />
How could it change: Examine transit-oriented<br />
development (TOD) buildout potential by creating<br />
a ‘virtual future.’ Creating this virtual future involved<br />
combining the results of previous steps. First, parcels<br />
that were evaluated to have some level of development<br />
potential (low, medium, high or vacant) and were<br />
assigned a TOD place type. Each TOD place type has<br />
with it an associated development multiplier such as<br />
jobs or houses per acre. Each acre with development<br />
potential could then be multiplied by the dwellings/<br />
acre or employees/acre values of a given TOD policy.<br />
The TOD buildout factor was adjusted based on<br />
the high, medium and low development potential<br />
evaluated in the “what could change” step. Vacant<br />
and high redevelopment potential areas received<br />
16 | Evaluation of TOD Potential<br />
TOD Density, Use, and<br />
Design Recommendations<br />
Transit stations and corridors will differ in urban<br />
form, density and intensity. To account for a range<br />
of suburban to urban TOD policies, a typology<br />
of place making elements were composed. These<br />
were developed from standards provided by<br />
Reconnecting America, Florida Department<br />
of <strong>Transportation</strong> Design Guidelines and the<br />
City of <strong>Jacksonville</strong> Comprehensive Plan. These<br />
place making elements were grouped into two<br />
generalized categories of urban and suburban<br />
(based on the City of <strong>Jacksonville</strong> 2030<br />
Comprehensive Plan), and within those two<br />
categories the scales of development and land<br />
use intensity varied from neighborhoods, to<br />
villages, to towns, to downtown districts. Using<br />
the CorPlan, a GIS-based land use analysis<br />
application, the average dwelling units per acre<br />
and employees per acre were approximated. On<br />
page 14 is a table that represents the relative<br />
density and intensity of the place making<br />
elements.<br />
100% buildout potential, the medium redevelopment<br />
potential received 66%, and the low redevelopment<br />
potential received 33%. Finally, any parcel that<br />
qualified for the residential-neighborhood “scale<br />
transition” protection was post-processed to reduce<br />
the overall buildout potential by an additional 15%.<br />
The definition of parcels qualifying for this residentialneighborhood,<br />
“scaled transition” protection comes<br />
from the City of <strong>Jacksonville</strong> Comprehensive Plan<br />
(Section 3.1.25). Appendix A, Tables 11-15 outline<br />
the results of this TOD potential analysis, by corridor<br />
and by TOD place making element.
103rd St<br />
Garden St<br />
Crystal Springs Rd<br />
Prichard Rd<br />
Collins Rd<br />
Wilson Blvd<br />
Dunn Ave<br />
Park St<br />
San Juan Blvd<br />
Kingsley Ave<br />
Bowden Rd<br />
Arlington Expy<br />
Zoo Parkway<br />
Old St Augustine Rd<br />
Southside Blvd<br />
Baymeadows Rd<br />
Heckscher Dr<br />
J Turner Butler<br />
Beach Blvd<br />
City of <strong>Jacksonville</strong><br />
<strong>Policy</strong> <strong>Framework</strong> for Transit-Oriented Development<br />
TOD Place Making Elements Allocated<br />
to Vacant/Redevelopable Parcels<br />
S1 Campus<br />
S2 Town Center<br />
S3 Village<br />
S4 Suburban Neighborhood<br />
SC Suburban Corridor<br />
U1 Downtown<br />
U2 Urban Center<br />
U3 Main Street<br />
U4 Urban Neighborhood<br />
UC Urban Corridor<br />
TOD Study Area<br />
1<br />
295<br />
Lem Turner Rd<br />
95<br />
Ye low Blu f Rd<br />
9A<br />
New Berlin Rd<br />
Starre t Rd<br />
Kings Rd<br />
Monument Rd<br />
Beaver St<br />
90<br />
Atlantic Blvd<br />
Atlantic Blvd<br />
10<br />
Normandy Blvd<br />
17<br />
St Johns River<br />
295<br />
9A<br />
San Jose Blvd<br />
95<br />
Old Middleburg Rd<br />
Hood Rd<br />
1<br />
17<br />
95<br />
0 5<br />
Miles<br />
Figure 6 - TOD Corridor and Station Allocation Map<br />
TOD Place Making Element *<br />
Average Density<br />
(DUs per Acre)<br />
Average Intensity<br />
(Non-Res FAR)<br />
Average<br />
Employment Per Acre<br />
S1 Campus - 1.0 - 2.5 125<br />
S2 Town Center 35 - 50 3.5 - 4.0 100<br />
S3 Village 8 - 12 0.8 - 1.5 20<br />
S4 Suburban Neighborhood 6 - 10 0.5 - 0.8 10<br />
SC Suburban Corridor 6 - 10 0.5 - 0.8 10<br />
U1 Downtown > 40 4.0 - 8.0 300<br />
U2 Urban Center 15 - 30 2.0 - 4.0 173<br />
U3 Main Street 10 - 18 1.0 - 2.0 62<br />
U4 Urban Neighborhood 10 - 18 0.8 - 1.0 15<br />
UC Urban Corridor 10 - 18 0.8 - 1.0 15<br />
* Place Types are addressed in greater<br />
detail in the Design Guidelines<br />
Table 2: TOD Corridor and Station Area Summary<br />
Evaluation of TOD Potential | 17
City of <strong>Jacksonville</strong><br />
<strong>Policy</strong> <strong>Framework</strong> for Transit-Oriented Development<br />
Transit Technologies<br />
When planning a TOD project or district, it is important to consider the kind of transit technology that will<br />
serve the area. The major transit technologies are commuter rail, express bus, light rail, bus rapid transit,<br />
monorail, streetcar, and local service bus. Each technology has characteristics that influence the intensity,<br />
spacing, and form of TODs. Transit technology choices will largely reflect the needs of the transit system, but<br />
they will also consider future development and redevelopment plans along a prospective alignment. While<br />
TODs respond to transit technologies, they also can influence what technologies are viable and best suited for<br />
a particular corridor. The major transit technologies are described briefly below. Each technology has distinct<br />
vehicle and operational characteristics. Vehicle type, size, costs, and right-of-way requirements vary among<br />
the different technologies. These factors influence operational characteristics like optimal travel distances and<br />
times, station spacing, and the size and nature of station service areas.<br />
Commuter Rail<br />
Commuter rail technology utilizes relatively large<br />
train cars that can carry a high number of passengers.<br />
Commuter rail operates in its own right-of-way,<br />
separate from automobile traffic; but in many cities,<br />
commuter trains share track and right-of-way with<br />
freight rail carriers. Because of the capacities and<br />
speeds achievable with commuter rail, this technology<br />
is best suited for covering long distances with stations<br />
spaced from 1 to 5 miles apart. Station service areas<br />
are large and often accessed by driving from the<br />
surrounding community.<br />
Commuter rail is most effective in areas that have<br />
strong regional centers with high employment<br />
densities, linking them to suburban communities.<br />
However, suburban commuter rail station areas can<br />
include an even mix of residential and commercial<br />
uses at medium to high densities. Park and ride access<br />
is appropriate near commuter station areas given that<br />
they will draw ridership from nearby communities.<br />
Walkable TOD communities should be implemented<br />
in the immediate vicinity of the station, transitioning<br />
smoothly to a lower density development pattern in<br />
the greater station area.<br />
Service Area:1mile to 5 miles<br />
Station Spacing: 1miles to 5 miles<br />
Optimal Transit Shed: 5 miles to 100 miles<br />
Commuter Rail Characteristics<br />
Express Bus<br />
An express bus operates in a similar manner to<br />
commuter rail, serving a regional center from<br />
outlying areas, with few stops in between. However,<br />
express bus cannot provide the same passenger<br />
capacity and speed as commuter rail. It is well suited<br />
for serving low to medium density communities and<br />
often only operates during the morning and evening<br />
peak commuting hours to allow suburban residents<br />
18 | Transit Technologies
City of <strong>Jacksonville</strong><br />
<strong>Policy</strong> <strong>Framework</strong> for Transit-Oriented Development<br />
to reach urban employment destinations. TODs<br />
in express bus service areas would exhibit similar<br />
characteristics to those in local bus service areas, and<br />
a single TOD project or district may be served by<br />
both local and express bus routes.<br />
Light Rail<br />
In contrast to commuter rail, light rail can operate<br />
either in a dedicated right-of-way or in mixed traffic<br />
with automobiles. Also, light rail vehicles are smaller<br />
than commuter rail cars, carrying fewer passengers.<br />
Light rail can cover long distances, but is best suited<br />
for short to intermediate trips. Stations are usually<br />
one to two miles apart. Park and ride access is<br />
appropriate in low density areas, while walk access<br />
to stations becomes more viable in areas of increased<br />
employment activity and/or residential density.<br />
Since light rail transit can effectively serve a wide<br />
variety of place types along a single alignment,<br />
TODs in light rail station areas will vary to reflect<br />
the character and intensity of nearby neighborhoods<br />
and development. In urban centers, TODs will<br />
exhibit high densities and a thorough mix of uses.<br />
In neighborhoods and community centers, there<br />
will likely be a greater emphasis placed on residential<br />
uses at medium to lower densities, with supporting<br />
community retail and commercial services.<br />
Bus Rapid Transit<br />
Bus rapid transit, or BRT, combines the flexibility<br />
of a bus with the high quality service of rail transit.<br />
BRT can operate in an exclusive right-of-way or in<br />
mixed traffic. BRT routes generally have fewer stops<br />
than a normal bus route, spaced about a half mile<br />
to one mile apart, and the stops usually have special<br />
treatments akin to a light rail platform, including<br />
shelters and ticket vending machines. BRT can<br />
cover substantial distances and serve as an effective<br />
and affordable alternative to rail transit in certain<br />
contexts.<br />
Like light rail, BRT can serve many different types<br />
of places with varying densities and mixes of uses.<br />
Hence, TODs in BRT station areas are generally<br />
similar to those found in comparable light rail station<br />
areas, although they often have lower densities and a<br />
higher ratio of homes to jobs.<br />
Service Area:1/4 mile to 5 miles<br />
Station Spacing: 1 mile to 2 miles<br />
Optimal Transit Shed: 5 miles to 50 miles<br />
Light Rail Characteristics<br />
Service Area:1/4 mile to 3 miles<br />
Station Spacing: 1/2 mile to 1 mile<br />
Optimal Transit Shed: 5 miles to 20 miles<br />
Bus Rapid Transit Characteristics<br />
Transit Technologies | 19
City of <strong>Jacksonville</strong><br />
<strong>Policy</strong> <strong>Framework</strong> for Transit-Oriented Development<br />
Monorail “Skyway”<br />
Automated monorail systems are fixed transit facilities<br />
that operate on elevated guideways. The elevated<br />
design allows monorails to be routed directly to<br />
specific activity centers in a given service area without<br />
having to conform to, or compete with, established<br />
travel right-of-way. This “automated people mover”<br />
transit technology is designed to enhance mobility<br />
in targeted areas of intense activity such as core<br />
business districts, airport hubs, or entertainment/<br />
campus facilities. Activity centers served by monorail<br />
typically have very high levels of investment, or urban<br />
development, that warrant the higher investment in<br />
transit.<br />
In <strong>Jacksonville</strong> the JTA operates the 2.5-mile Skyway,<br />
a fully automated transit system operating on an<br />
elevated dual guideway. Nine two-car trains serve<br />
eight stations on both sides of the St. Johns River<br />
and in the central business district. Station spacing<br />
for monorails is variable and depends on the specific<br />
activity centers of a service area. The Skyway system<br />
is interconnected with JTA’s free Trolley service,<br />
providing riders with expanded mobility in the<br />
downtown area linking specific destinations such as<br />
the Prime Obsorne Convention Center, the Florida<br />
State College (FSC) and San Marco. The JTA<br />
Skyway is one of seven urban “automated people<br />
mover” systems that were built in the U.S. beginning<br />
in the 1970s. The other six major urban systems<br />
are in Detroit, Michigan; Irving, Texas; Miami,<br />
Florida; Las Vegas, Nevada; Indianapolis, Indiana;<br />
and Morgantown, West Virginia. Monorail “people<br />
mover” systems are also installed at amusement parks<br />
(Disney) and major airports (Dallas-Fort Worth)<br />
throughout the country.<br />
Streetcar<br />
Streetcars serve a similar function to local buses,<br />
meeting localized travel demand over short distances.<br />
Service is generally frequent and there are a variety<br />
of vehicle types from historic and vintage streetcars<br />
to modern cars. Modern cars have higher passenger<br />
capacities, multiple doors and low floors for quick<br />
boarding and alighting, and generally rely on ticket<br />
vending machines at platforms to manage fare<br />
collection. Because of these attributes, the modern<br />
20 | Transit Technologies<br />
Monorail “Skyway”<br />
Service Area:1/4 mile to 1 mile<br />
Station Spacing: 1/8 mile to 1/4 mile<br />
Optimal Transit Shed: 5 miles to 10 miles<br />
Street Car Characteristics
City of <strong>Jacksonville</strong><br />
<strong>Policy</strong> <strong>Framework</strong> for Transit-Oriented Development<br />
streetcar can provide capacity and operational<br />
efficiency advantages to the average bus.<br />
However similar to bus transit, streetcars have been<br />
demonstrated to have a greater influence on urban<br />
form than their rubber-wheeled counterparts.<br />
Streetcars provide local accessibility to medium and<br />
high density areas. Several streetcar projects across the<br />
country have spurred successful TOD redevelopment<br />
projects in urban areas, introducing or increasing<br />
residential activity mixed with office and retail uses.<br />
Local Bus<br />
The most common mode of transit is the bus. Buses<br />
provide a high level of flexibility in terms of route<br />
alignment, service frequency, and stop location. Bus<br />
transit is well suited for low to medium density areas,<br />
but high frequency service is warranted to provide<br />
local accessibility in dense urban areas as well. Buses<br />
often complement high capacity transit facilities<br />
like commuter rail and light rail, providing a more<br />
localized service with more stops spaced closely<br />
together, often about a quarter mile apart.<br />
TODs in urban and suburban contexts can boost<br />
route and system productivity for buses and justify<br />
service enhancements such as improved headways or<br />
new routes. Suburban TODs can provide outlying<br />
transit hubs and create vibrant public spaces in low<br />
to medium density neighborhoods.<br />
Street Car Example<br />
Service Area:1/4 mile to 1/2 mile<br />
Station Spacing: 1/8 mile to 1/4 mile<br />
Optimal Transit Shed: 5 miles to 10 miles<br />
Local Bus Characteristics<br />
<strong>Policy</strong> Issues and Opportunities<br />
Multimodal <strong>Transportation</strong> Plan<br />
The City of <strong>Jacksonville</strong> has completed the 2030 Multimodal <strong>Transportation</strong> Study, an appendix of the 2030<br />
Mobility Plan. This study addresses new requirements for integrated land use and transportation planning<br />
stipulated in Senate Bill 360 passed by the Florida legislature in 2009. The new requirements are designed<br />
to encourage urban areas to incentivize the use of alternative modes of transportation, reduce vehicle miles<br />
traveled (VMT), and reduce greenhouse gas emissions. The plan outlines transportation strategies and needed<br />
improvements to address <strong>Jacksonville</strong>’s traffic congestion and mobility needs.<br />
The Multimodal <strong>Transportation</strong> Plan incorporates highway, transit, bicycle, and pedestrian improvements<br />
in the North Florida TPO’s Cost Feasible Plan for 2030, as well as City-managed projects in the Better<br />
<strong>Jacksonville</strong> Plan. Planned transit projects include BRT, commuter rail, and streetcar projects, as well as an<br />
extension of the Skyway to San Marco. Over 100 miles of bicycle improvements and 68 miles of sidewalk are<br />
included in the plan.<br />
<strong>Policy</strong> Issues and Opportunities | 21
City of <strong>Jacksonville</strong><br />
<strong>Policy</strong> <strong>Framework</strong> for Transit-Oriented Development<br />
Mobility Fee<br />
In conjunction with the 2030 Multimodal <strong>Transportation</strong> Study, the City has developed a 2030 Mobility<br />
Plan to create a viable multimodal system. The plan, which is scheduled for adoption in mid-2011, includes<br />
a mobility fee that will apply to new developments and replace the existing proportionate fair share program<br />
administered through the City’s concurrency management system. The mobility fee is based on VMT and<br />
will fund multimodal transportation projects, including roads, transit, and bicycle and pedestrian facilities.<br />
The assessed fee can be reduced by implementing traffic reduction measures that include increasing residential<br />
densities, providing a mix of uses, locating development in areas served by transit, creating bicycle and pedestrian<br />
friendly communities, and providing below market rate dwelling units. The goal of allowing for mobility fee<br />
reductions is to encourage urban infill development and foster transit-friendly development patterns.<br />
The mobility fee addresses the problem of paying for the transportation impacts of development in a different<br />
manner than former impact fees and concurrency management processes. The result is less incentive for<br />
developers to pursue low-density projects in greenfield areas. Over time TOD is more likely to become a<br />
typical development pattern rather than a novelty, supported by an expanding metropolitan transit network.<br />
TOD Incentives<br />
While most communities and developers support the basic principles behind TOD, implementing TOD has<br />
been lagging. The primary reasons for this lag in implementation are lack of committed funding for transit<br />
and the perception of risk in TOD. Creating incentives for TOD at the city and county level can help lower<br />
the risk for developers and encourage transit supportive land use patterns.<br />
Station Area Planning<br />
Strategic planning for development within transit priority corridors and around transit stations can reduce the<br />
perception of risk for developers and increase the possibility of securing committed funding for transit. Creating<br />
the station area master plan through a public process generates community support for TOD. Station area<br />
plans further signal clear development intentions for this area which should help reduce both uncertainties and<br />
perceptions of risk to prospective developers.<br />
Density Bonuses<br />
Allowing higher density and intensity within walking<br />
distance of transit stops creates more opportunity for<br />
people to live and work in places with easy access to<br />
transit. Encouraging compact and pedestrian friendly<br />
neighborhoods can result in a sustainable urban pattern<br />
that is beneficial to residents and local businesses.<br />
Location Efficient Mortgages<br />
A “Location Efficient Mortgage” rewards households<br />
with lower transportation expenses by allowing them<br />
to qualify for larger loan amounts. Location efficient<br />
mortgages allow people to relocate to TODs and<br />
generate more demand for TOD.<br />
Parking Reduction<br />
Reducing minimum parking requirements along<br />
transit priority corridors and around transit stations<br />
lowers the cost of development and encourages transit<br />
use. Phased parking reduction and maximizing shared<br />
and/or public parking opportunities make transit use<br />
more convenient.<br />
22 | <strong>Policy</strong> Issues and Opportunities<br />
LOCATION EFFICIENT MORTGAGE<br />
A Location Efficient Mortgage (LEM) is a<br />
mortgage that helps people become homeowners<br />
in location efficient communities. These are<br />
convenient neighborhoods in which residents<br />
can walk from their homes to stores, schools,<br />
recreation, and public transportation. People<br />
who live in location efficient communities<br />
have less need to drive, which allows them to<br />
save money and improves the environment<br />
for everyone. The LEM combines a low down<br />
payment, competitive interest rates, and flexible<br />
criteria for financial qualification to allow more<br />
people to own the home of their dreams.<br />
http://www.locationefficiency.com/
City of <strong>Jacksonville</strong><br />
<strong>Policy</strong> <strong>Framework</strong> for Transit-Oriented Development<br />
Property Tax Abatement<br />
Reducing property taxes on high density, mixed<br />
use developments within walking distance of<br />
transit stations lowers land and/or development<br />
cost for developers and creates affordable housing<br />
opportunities for the community.<br />
Park and Ride<br />
A significant means of accessing transit, especially<br />
commuter rail and express bus, are park and ride lots,<br />
which allow riders to arrive at transit station areas by<br />
car. While TODs enhance the accessibility and utility<br />
of transit service for residents and workers within the<br />
development, they also become focal points for activity<br />
and transit access from the surrounding community.<br />
This can be especially prominent in suburban areas.<br />
Development policies should address the need to<br />
incorporate park and ride facilities in TODs where<br />
warranted, based on the scale of the development<br />
and/or neighborhood contexts.<br />
In order to strategically and efficiently implement<br />
appropriate park and ride lots, candidate locations<br />
should be identified based on existing and planned<br />
transit alignments. This allows developers to<br />
understand the quantity and nature of transit<br />
facilities that are appropriate for a given TOD<br />
project. The provision of park and ride spaces as<br />
part of a TOD should apply to the overall obligation<br />
for new development to mitigate its impacts on the<br />
transportation system.<br />
Intermodal Transfer Station<br />
Park and Ride<br />
<strong>Policy</strong> Issues and Opportunities | 23
City of <strong>Jacksonville</strong><br />
<strong>Policy</strong> <strong>Framework</strong> for Transit-Oriented Development<br />
Summary<br />
The quality of mobility and vitality in <strong>Jacksonville</strong> are closely linked to investments in transportation. The land<br />
use policies designed in accordance with transportation investments serve to shape, and thereby encourage,<br />
transit supportive development patterns. This has proven true for <strong>Jacksonville</strong>’s past and remains a viable and<br />
achievable direction for the future. These policy framework and design guidelines are intended to help achieve<br />
the transit and mobility goals set by JTA for the region. The future land use and mobility plans of the City<br />
are supportive of transit supportive and transit oriented development. The proposed design guidelines are a<br />
tool to realize these aims and potential. By encouraging a place-making approach to development, designing<br />
walkable communities, and encouraging a dynamic and diverse mixture of uses in close proximity to transit,<br />
the return on investment for <strong>Jacksonville</strong> could be multi fold. Approximately 15% of all land in <strong>Jacksonville</strong><br />
is within a half-mile of existing or proposed premium transit corridors. Under the proposed TOD place type<br />
policy framework there is buildout capacity for <strong>Jacksonville</strong> to more than double in size with improved access<br />
to transit, and increased transportation choices. These framework and design guidelines present a future that is<br />
optimistic of the potential for increased transit ridership and reduced dependency on automobile travel while<br />
encouraging a high quality and human-scaled built environment. Orienting future jobs and houses within<br />
reach of transit, existing transportation networks and each other will reduce public and private sector spending<br />
on extending infrastructure. It will also reduce household expenditures on transportation.<br />
There is not a misconception that the future TOD policy scenario presented here will be auto-free, rather that<br />
auto-dependency will be reduced simply by providing choices. People in this future TOD framework will have<br />
quality, vibrant, enjoyable places to live, work and recreate, places allow for choice in transportation, reduce<br />
dependency on foreign oil, and create economic opportunities throughout the region.<br />
24 | Summary<br />
Appendix A
Appendix A
City of <strong>Jacksonville</strong><br />
<strong>Policy</strong> <strong>Framework</strong> for Transit-Oriented Development<br />
Appendix A: Analysis of TOD Potential<br />
Contents<br />
Introduction 2<br />
What Exists Today? 3<br />
Defining the Study Area 3<br />
Where Do People Live and Work Today? 4<br />
What Could Change? 9<br />
Creating a Virtual Future – Evaluating TOD Potential 14<br />
Summary 17<br />
List of Figures<br />
Figure 1: Transit Lines 3<br />
Figure 2: Rapid Fixed Transit Corridors 4<br />
Figure 3: Transit Line Buffers Compose the Study Area 5<br />
Figure 4: Generalized Land Use 6<br />
Figure 5: Study Area Parcels by Development Potential Category 12<br />
Figure 6: TOD Place Types 13<br />
Figure 7: TOD Place Types Allocated to Vacant/Redevelopable Parcels 14<br />
List of Tables<br />
Table 1: Existing Dwelling Units / Densities by Transit Corridor 6<br />
Table 2: Existing Employment / Densities by Transit Corridor 7<br />
Table 3: Existing Jobs/Housing Ratios 7<br />
Table 4: Existing Average Floor-to-Area Ratio by Corridor 8<br />
Table 5: Improvement Value/Land Value Ratio (example) 8<br />
Table 6: Development Potential Status and Acres 9<br />
Table 7: Development Potential Summarized 10<br />
Table 8: Development Potential by Corridor (Acres) 11<br />
Table 9: Development Potential by Corridor (Percentage) 11<br />
Table 10: Development Potential by Corridor - Summary 12<br />
Table 11: TOD Place Making Element Density/Intensity 13<br />
Table 12: Potential New Dwelling Units and Jobs by Place Type 15<br />
Table 13: Potential Acres Developed by Place Type 15<br />
Table 14: Potential New Development Summarized by Transit Corridor/Area 16<br />
Table 15: Total Future Buildout – Existing and Future Potential 16<br />
Appendix A: Analysis of TOD Potential | A-1
City of <strong>Jacksonville</strong><br />
<strong>Policy</strong> <strong>Framework</strong> for Transit-Oriented Development<br />
Introduction<br />
The purpose of Appendix A is to provide a more thorough explanation of the methods, assumptions, and<br />
quantitative aspects of the land use and buildout potential analysis performed during the Transit Oriented<br />
Development <strong>Policy</strong> <strong>Framework</strong> conducted for the <strong>Jacksonville</strong> <strong>Transportation</strong> <strong>Authority</strong>. The process followed<br />
three primary stages:<br />
Step 1: Determine What exists today<br />
Evaluating future potential requires a clear understanding of present conditions. To accomplish this a ‘virtual<br />
present’ is created for existing residential and employment densities. The steps involved analyzing the parcels<br />
that were in the half-mile buffer of fixed-route transit corridors for existing land use. The present day jobs<br />
and households data from the regional travel demand model were then associated with residential and<br />
employment parcels to approximate where people currently live and work in each transit corridor. The findings<br />
are summarized by transit corridor in Appendix A, Tables 1-4.<br />
Step 2: Identify Areas with Propensity for Change<br />
The next step involved identifying the areas with some propensity for change by evaluating the development and<br />
redevelopment potential for parcels based on analysis of existing land use classification and/or improvement and<br />
land value assessments. The steps involved analyzing the County GIS parcels with the Department of Revenue<br />
land use codes and tax assessment information. This provided the base of the analysis. The improvement value<br />
to land value ratio for parcels were calculated, averaged by land use type, and then grouped into development<br />
potential categories of vacant/high potential, medium potential, low potential, full developed or unbuildable<br />
(no future potential) as explained in Appendix A, Table 5.<br />
Step 3: Test Capacity for Change Under Proposed TOD Policies<br />
The final step tested the capacity for change under proposed TOD policies by examining buildout potential by<br />
creating a ‘virtual future.’ Creating this ‘virtual future’ involved combining the results of previous steps. Parcels<br />
evaluated to have some development potential were assigned a TOD place making element, and their acreage<br />
was multiplied by the dwelling/acre or employee/acre values for the place making element. The TOD buildout<br />
potential was adjusted based on the high, medium and low development potential evaluated in the “what<br />
could change” step. Vacant and high redevelopment potential areas received 100% buildout potential, the<br />
medium redevelopment potential received 66%, and the low redevelopment potential received 33%. Finally,<br />
any parcel that qualified for the residential-neighborhood “scale transition” protection was post-processed<br />
to reduce the overall buildout potential by 15%. Appendix A, Tables 11-15 outline the results of this TOD<br />
potential analysis, but by corridor and by TOD place making element.<br />
A-2 | Appendix A: Analysis of TOD Potential
103rd St<br />
Garden St<br />
Crystal Springs Rd<br />
Prichard Rd<br />
Collins Rd<br />
Wilson Blvd<br />
Dunn Ave<br />
Park St<br />
San Juan Blvd<br />
Kingsley Ave<br />
Bowden Rd<br />
Arlington Expy<br />
Zoo Parkway<br />
Old St Augustine Rd<br />
Southside Blvd<br />
Baymeadows Rd<br />
Heckscher Dr<br />
J Turner Butler<br />
Beach Blvd<br />
City of <strong>Jacksonville</strong><br />
<strong>Policy</strong> <strong>Framework</strong> for Transit-Oriented Development<br />
What Exists Today?<br />
Defining the Study Area<br />
The study area was defined by taking the premium fixed transit lines shown in Figure 1, and buffering them<br />
by a ½ mile. A buffer is the distance from the transit corridor/station area. Premium fixed transit lines are the<br />
rapid transit (BRT/light rail), the Skyway, and Street Car. Figure 2 shows the rapid fixed transit corridors (BRT/<br />
light rail) that were analyzed individually and reported on separately for purposes of comparing corridors. The<br />
high frequency transit (HFT) lines were not buffered as part of the study area, since the nature and timing<br />
of implementing this transit infrastructure is uncertain, and represents less infrastructure investment as fixed<br />
transits routes. Potential station areas along HFT lines were included in the study area, as shown in Figure<br />
3, because these hubs have greater investment and certainty associated with them. The general intent of new<br />
development or redevelopment efforts along the corridors is to create ‘transit-ready’ or ‘transit supportive’<br />
urban environments that encompass a ½ mile offset from transit corridors and transit station/ stop locations,<br />
and are either defined as a place type or transit corridor. Station and corridor Place Types are defined in greater<br />
detail in the supporting TOD Design Guidelines. Figure 3 also shows the location of all TOD hubs, or station<br />
areas, that were evaluated as part of this study.<br />
Rapid, Fixed Transit<br />
Commuter Rail<br />
Skyway<br />
Street Car<br />
High Frequency Transit Line<br />
95<br />
Ye low Blu f Rd<br />
Starre t Rd<br />
Lem Turner Rd<br />
New Berlin Rd<br />
9A<br />
1<br />
295<br />
Kings Rd<br />
Monument Rd<br />
Beaver St<br />
90<br />
Atlantic Blvd<br />
Atlantic Blvd<br />
10<br />
Normandy Blvd<br />
17<br />
St Johns River<br />
295<br />
9A<br />
San Jose Blvd<br />
95<br />
Old Middleburg Rd<br />
Hood Rd<br />
1<br />
17<br />
95<br />
0 5<br />
Miles<br />
Figure 1: Transit Lines<br />
Appendix A: Analysis of TOD Potential | A-3
103rd St<br />
Garden St<br />
Crystal Springs Rd<br />
Prichard Rd<br />
Collins Rd<br />
Wilson Blvd<br />
Dunn Ave<br />
Park St<br />
San Juan Blvd<br />
Kingsley Ave<br />
Bowden Rd<br />
Arlington Expy<br />
Zoo Parkway<br />
Old St Augustine Rd<br />
Southside Blvd<br />
Baymeadows Rd<br />
Heckscher Dr<br />
J Turner Butler<br />
Beach Blvd<br />
City of <strong>Jacksonville</strong><br />
<strong>Policy</strong> <strong>Framework</strong> for Transit-Oriented Development<br />
Rapid Fixed- Transit Corridors<br />
Rapid A<br />
95<br />
Rapid B<br />
Rapid C<br />
Ye low Blu f Rd<br />
Rapid D<br />
Rapid E<br />
Starre t Rd<br />
Rapid F<br />
Lem Turner Rd<br />
Rapid G<br />
New Berlin Rd<br />
1<br />
295<br />
F<br />
9A<br />
E<br />
G<br />
Kings Rd<br />
B<br />
Monument Rd<br />
Beaver St<br />
90<br />
Atlantic Blvd<br />
A<br />
Atlantic Blvd<br />
10<br />
Normandy Blvd<br />
17<br />
St Johns River<br />
C<br />
295<br />
9A<br />
San Jose Blvd<br />
D<br />
95<br />
Old Middleburg Rd<br />
Hood Rd<br />
1<br />
17<br />
95<br />
0 5<br />
Miles<br />
Where Do People Live and Work Today?<br />
A-4 | Appendix A: Analysis of TOD Potential<br />
Figure 2: Rapid Fixed Transit Corridors<br />
To understand potential for the future, a detailed examination of the present was needed. An analysis was<br />
conducted to develop an understanding of where people live and work in the transit corridors and at what<br />
densities. This picture of current development is called a ‘virtual present.’ This snapshot provides the baseline<br />
against which a virtual TOD ‘future’ can be envisioned.<br />
The steps to build a virtual present involved first classifying the existing land uses. The GIS parcel database for<br />
<strong>Jacksonville</strong> was the primary source of land use data. A half-mile buffer of all premium fixed route transit, as<br />
well as high frequency transit station areas, was used to clip parcels and select them for analysis. Clipping is a<br />
process of using GIS to extract one area from another, in this case the 1/2 mile area was used to extract parcels<br />
that matched its coverage. These clipped study area parcels, depicted by the buffer areas in Figure 3, represent<br />
67,672 acres, or 15% of land in <strong>Jacksonville</strong>. Traffic Analysis Zones (TAZ) from the regional travel demand<br />
forecasting model contain the jobs and housing data studied. Parcel-level information, TAZs and planned<br />
fixed route transit GIS data were the three primary data sources used to evaluate what exists today.<br />
Real-estate parcel data contains Department of Revenue (DOR) land use code classifications, as shown<br />
in Figure 4. DOR classifications can be grouped into generalized land use categories such as residential or<br />
employment uses. These classifications inform us where people currently live and work, while a different set<br />
of data is examined to inform us of how many live there. Using GIS, the household and job totals from a<br />
TAZs are disaggregated and associated with parcels identified with an existing residential or employment land
103rd St<br />
Garden St<br />
Crystal Springs Rd<br />
Prichard Rd<br />
Collins Rd<br />
Wilson Blvd<br />
Dunn Ave<br />
Park St<br />
San Juan Blvd<br />
Kingsley Ave<br />
Bowden Rd<br />
Arlington Expy<br />
Zoo Parkway<br />
Old St Augustine Rd<br />
Southside Blvd<br />
Baymeadows Rd<br />
Heckscher Dr<br />
J Turner Butler<br />
Beach Blvd<br />
City of <strong>Jacksonville</strong><br />
<strong>Policy</strong> <strong>Framework</strong> for Transit-Oriented Development<br />
use. Present day estimates of jobs and household data from regional travel demand model TAZs were then<br />
proportionally assigned to residential or employment study area parcels. Once these values are assigned, a clear<br />
‘virtual present’ picture emerges of where people live and work and in what densities.<br />
The results of the virtual present were summarized by transit corridor/station areas. Assigning a single parcel<br />
to a single transit corridor is not feasible at this level of analysis given that there is overlap between corridors<br />
especially when many of them converge near downtown. Therefore it should be noted that there is overlap<br />
in the by-corridor summaries. The by-corridor summaries allow a comparison between corridors, but should<br />
not be totaled for the whole study area because of the overlap. In the study area, there are approximately<br />
102,866 dwelling units, 209,44 jobs, on 67,672 acres. Tables 1 and 2 on the next page contain the present<br />
day residential and employment estimates for each transit corridor. Tables 3 and 4 contain a household-to-job<br />
ratios, and floor-to-area ratio coverages, by transit corridor.<br />
Transit Routes and Buffers<br />
Rapid Transit (1/2 mile buffer)<br />
95<br />
Commuter Rail (1/2 mile buffer)<br />
Skyway (1/2 mile buffer)<br />
Ye low Blu f Rd<br />
Streetcar (1/2 mile buffer)<br />
High Frequency Transit Station Area<br />
Starre t Rd<br />
High Frequency Transit Line<br />
TOD Hubs<br />
Lem Turner Rd<br />
New Berlin Rd<br />
Premium Fixed Transit Station<br />
Commuter Rail Station<br />
1<br />
295<br />
9A<br />
High Frequency Transit Station<br />
Kings Rd<br />
Monument Rd<br />
Beaver St<br />
90<br />
Atlantic Blvd<br />
Atlantic Blvd<br />
10<br />
Normandy Blvd<br />
17<br />
St Johns River<br />
295<br />
9A<br />
San Jose Blvd<br />
95<br />
Old Middleburg Rd<br />
Hood Rd<br />
1<br />
17<br />
95<br />
0 5<br />
Miles<br />
Figure 3: Transit Line Buffers Compose the Study Area<br />
Appendix A: Analysis of TOD Potential | A-5
103rd St<br />
Garden St<br />
Crystal Springs Rd<br />
Prichard Rd<br />
Collins Rd<br />
Wilson Blvd<br />
Dunn Ave<br />
Park St<br />
San Juan Blvd<br />
Kingsley Ave<br />
Bowden Rd<br />
Arlington Expy<br />
Zoo Parkway<br />
Old St Augustine Rd<br />
Southside Blvd<br />
Baymeadows Rd<br />
Heckscher Dr<br />
J Turner Butler<br />
Beach Blvd<br />
City of <strong>Jacksonville</strong><br />
<strong>Policy</strong> <strong>Framework</strong> for Transit-Oriented Development<br />
Study Area<br />
Generalized Existing Land Use<br />
Employment (Com, Off, Ind, Gov, Mil, Civ)<br />
Vacant; Agriculture<br />
Residential (SF, MF)<br />
Undevelopable (Utility, Rds, ROW)<br />
95<br />
Ye low Blu f Rd<br />
Starre t Rd<br />
Lem Turner Rd<br />
New Berlin Rd<br />
9A<br />
1<br />
295<br />
Kings Rd<br />
Monument Rd<br />
Beaver St<br />
90<br />
Atlantic Blvd<br />
Atlantic Blvd<br />
10<br />
Normandy Blvd<br />
17<br />
St Johns River<br />
295<br />
9A<br />
San Jose Blvd<br />
95<br />
Old Middleburg Rd<br />
Hood Rd<br />
1<br />
17<br />
95<br />
0 5<br />
Miles<br />
Figure 4: Generalized Land Use<br />
Transit Corridor/Area<br />
Total<br />
Residential Acres<br />
Total DUs<br />
Per Corridor<br />
Avg DUs<br />
per Acre<br />
Total<br />
Corridor Acres<br />
Percent<br />
Residential<br />
Rapid Trans - Corridor A 3,172 19,377 6.11 10,020 32%<br />
Rapid Trans - Corridor B 3,059 21,022 6.87 9,072 34%<br />
Rapid Trans - Corridor C 1,309 10,017 7.65 7,485 17%<br />
Rapid Trans - Corridor D 2,732 16,288 5.96 6,479 42%<br />
Rapid Trans - Corridor E 2,093 12,116 5.79 4,975 42%<br />
Rapid Trans - Corridor F 1,578 8,968 5.68 7,184 22%<br />
Rapid Trans - Corridor G 631 5,481 8.69 2,344 27%<br />
Commuter Rail 8,962 46,551 5.19 37,903 24%<br />
Skyway 46 997 21.69 1,317 3%<br />
Street Car 801 9,444 11.79 3,552 23%<br />
HFT Station Area 1,543 6,213 4.03 4,276 36%<br />
A-6 | Appendix A: Analysis of TOD Potential<br />
Table 1: Existing Dwelling Units / Densities by Transit Corridor
City of <strong>Jacksonville</strong><br />
<strong>Policy</strong> <strong>Framework</strong> for Transit-Oriented Development<br />
Transit Corridor/Area<br />
Total<br />
Employment<br />
Acres<br />
Total<br />
Employees<br />
Per Corridor<br />
Avg Emp/<br />
Acre<br />
Total<br />
Corridor<br />
Acres<br />
Percent<br />
Employment<br />
Rapid Trans - Corridor A 3,536 61,067 17.27 10,020 35%<br />
Rapid Trans - Corridor B 3,414 64,359 18.85 9,072 38%<br />
Rapid Trans - Corridor C 3,540 80,124 22.64 7,485 47%<br />
Rapid Trans - Corridor D 2,148 46,021 21.42 6,479 33%<br />
Rapid Trans - Corridor E 1,543 40,849 26.47 4,975 31%<br />
Rapid Trans - Corridor F 1,949 17,165 8.81 7,184 27%<br />
Rapid Trans - Corridor G 732 11,498 15.71 2,344 31%<br />
Commuter Rail 10,164 126,012 12.40 37,903 27%<br />
Skyway 748 49,226 65.79 1,317 57%<br />
Street Car 1,586 76,182 48.03 3,552 45%<br />
HFT Station Area 1,345 3,150 2.34 4,276 31%<br />
Table 2: Existing Employment / Densities by Transit Corridor<br />
Transit Corridor/Area<br />
Existing Dwelling<br />
Units<br />
Existing Employment<br />
Jobs/House Ratio<br />
Rapid Trans - Corridor A 19,377 61,067 3.15<br />
Rapid Trans - Corridor B 21,022 64,359 3.06<br />
Rapid Trans - Corridor C 10,017 80,124 8.00<br />
Rapid Trans - Corridor D 16,288 46,021 2.83<br />
Rapid Trans - Corridor E 12,116 40,849 3.37<br />
Rapid Trans - Corridor F 8,968 17,165 1.91<br />
Rapid Trans - Corridor G 5,481 11,498 2.10<br />
Commuter Rail 46,551 126,012 2.71<br />
Skyway 997 49,226 49.37<br />
Street Car 9,444 76,182 8.07<br />
HFT Station Area 6,213 3,150 0.51<br />
Table 3: Existing Jobs/Housing Ratios<br />
Appendix A: Analysis of TOD Potential | A-7
City of <strong>Jacksonville</strong><br />
<strong>Policy</strong> <strong>Framework</strong> for Transit-Oriented Development<br />
Transit Corridor/Area<br />
Avg Emp/Acre<br />
FAR at<br />
300 SF/Emp<br />
FAR at<br />
450 SF/Emp<br />
FAR at<br />
600 SF/Emp<br />
Rapid Trans - Corridor A 17.3 0.12 0.18 0.24<br />
Rapid Trans - Corridor B 18.9 0.13 0.19 0.26<br />
Rapid Trans - Corridor C 22.6 0.16 0.23 0.31<br />
Rapid Trans - Corridor D 21.4 0.15 0.22 0.30<br />
Rapid Trans - Corridor E 26.5 0.18 0.27 0.36<br />
Rapid Trans - Corridor F 8.8 0.06 0.09 0.12<br />
Rapid Trans - Corridor G 15.7 0.11 0.16 0.22<br />
Commuter Rail 12.4 0.09 0.13 0.17<br />
Skyway 65.8 0.45 0.68 0.91<br />
Street Car 48.0 0.33 0.50 0.66<br />
HFT Station Area 2.3 0.02 0.02 0.03<br />
Table 4: Existing Average Floor-to-Area Ratio by Corridor<br />
Improvement to land<br />
value ratio example<br />
Percentile used<br />
to determine<br />
redevelopment potential<br />
REDEV STATUS (GIS)<br />
Redevelopment<br />
Potential assigned a<br />
parcel<br />
0.82 75 % DEVT Fully Developed<br />
VAC<br />
UNBLD<br />
Vacant<br />
Unbuildable<br />
Table 5: Improvement Value/Land Value Ratio (example)<br />
A-8 | Appendix A: Analysis of TOD Potential
City of <strong>Jacksonville</strong><br />
<strong>Policy</strong> <strong>Framework</strong> for Transit-Oriented Development<br />
What Could Change?<br />
After determining a virtual present, the next phase in understanding a future TOD scenario was to evaluate<br />
the potential for change. Vacant areas have the highest potential to develop, while high investment areas, such<br />
as established single family neighborhoods or tall office condos, probably have very low or no redevelopment<br />
potential. Parcels with existing development may have different potential for change based on land use or<br />
tax assessment values. Real-estate parcel data contains an improvement value and land value assessments.<br />
Improvement values are a measure of the total investment in building or other enhancements made to realestate.<br />
Land values are assessments of just the land before any improvements. Both assessment values come<br />
from the local assessors office. The ratio of improvement value to land value is a useful indicator of how much<br />
investment has been made on a property, and thus its potential to develop more in the future. A combination<br />
of DOR land use status, and tax assessment value were studied for all parcels in the transit corridor study<br />
area. The ratio of improvement value to land value was calculated, averaged, and then grouped by percentile<br />
to determine a parcel’s redevelopment potential for increased investment. Table 5 below shows an example<br />
of how an average improvement-to-land ratio was classified into redevelopment status based on a percentile<br />
grouping.<br />
The different redevelopment potential categories listed in Table 5 were assigned each parcel. These categories<br />
are explained further in Table 6, and quantified in Tables 7-10.<br />
Developed<br />
Approximately 43% (28,842 acres) of the study area was determined to be currently developed with little to<br />
no potential for future redevelopment. These parcels often had very high improvement to land value ratios,<br />
generally in top 25%. In addition, all existing single family residential was considered developed. Military,<br />
state, federal, and religious properties and institutions were classified as developed. The County owned lands<br />
were manually evaluated and where there were major civic or public facilities such as schools, hospitals, airports<br />
and stadiums were classified as developed, otherwise they were considered vacant.<br />
STATUS<br />
(GIS)<br />
DEVT<br />
REDEV1<br />
REDEV2<br />
REDEV3<br />
REDEV STATUS EXPLANATION ACRES<br />
Developed<br />
High Potential<br />
Redevelopment<br />
Medium Potential<br />
Redevelopment<br />
Low Potential<br />
Redevelopment<br />
Evaluated not likely to redevelop given high improvement<br />
to land value ratios.<br />
Improvement values to land value ratio averages were<br />
generally were in the lowest 25%.<br />
Improvement values to land value ratio averages were<br />
generally were in the 25-50% range.<br />
Improvement values to land value ratio averages were<br />
generally were in the 50-75% range.<br />
PERCENT<br />
OF TOTAL<br />
28,842 43%<br />
5,837 9%<br />
1,949 3%<br />
1,694 3%<br />
UNBLD<br />
Unbuildable, not<br />
likely to develop.<br />
Unbuildable areas included general public ROW, utilities,<br />
storm water retention, natural areas (FNAI), as well as<br />
Federal, State owned and some County owned lands.<br />
12,383 18%<br />
VAC<br />
Vacant or<br />
agriculture<br />
Areas labeled as vacant or agricultural by the Department<br />
of Revenue existing land use classification.<br />
16,966 25%<br />
Table 6: Development Potential Status and Acres<br />
Appendix A: Analysis of TOD Potential | A-9
City of <strong>Jacksonville</strong><br />
<strong>Policy</strong> <strong>Framework</strong> for Transit-Oriented Development<br />
High redevelopment potential<br />
Approximately 9% (5,837 acres) of the study area was determined to have improvement value to land value<br />
ratio averages that were generally were in the lowest 25%. These areas have the lowest investment, or larger<br />
acreage, relative to their land values.<br />
Medium redevelopment potential<br />
Approximately 3% (1,949 acres) of the study area was determined to have improvement values to land value<br />
ratio averages that were generally in the 25-50% range, indicating a relatively medium average potential for<br />
change.<br />
Low redevelopment potential<br />
Approximately 3% (1,694 acres) of the study area was determined to have improvement values to land value<br />
ratio averages that were generally were in the 50-75% range, indicating these parcels have a pretty significant<br />
current investment level but some remaining possibility for change or future development.<br />
Unbuildable OR not likely to develop<br />
Approximately 18% (12,383 acres) of the study area was evaluated as being ‘unbuildable’ or no development<br />
potential in the project horizon. Unbuildable areas included general public right-of-way, utilities, storm water<br />
retention, natural areas in the Florida Natural Areas Inventory Program, as well as federal, state owned and<br />
some County owned lands. Aerials were surveyed of large County owned parcels and where there was no<br />
visible development, these larger parcels were given a vacant classification.<br />
Vacant or agriculture<br />
Approximately 25% (16,966 acres) of the study area was evaluated as being ‘vacant’ or in agriculture use per<br />
their DOR land use classification. Some parcels that did not fit any of the categories above, and that had zero<br />
improvement values, were manually classified as vacant. When performing the future buildout, vacant parcels<br />
were allocated the full possible buildout potential of a TOD place type.<br />
Table 6 lists the acres associated with each development potential classification, and Table 7 provides a more<br />
concise summary by grouping all redevelopment categories into just one for simplicity. Tables 8-10 are<br />
summaries by transit corridor, shown both as total acres and as a percent of transit corridor acreage. It should<br />
be noted that there is significant overlap between corridors, especially downtown where many lines converge.<br />
It makes more sense to keep the overlap in order to compare corridors. Making a judgement about why one<br />
parcel would be assigned, or attributed, to one corridor and not the other would be difficult and prone to<br />
inaccuracies at this level of analysis. The summary in Table 7 of overall land with development potential shows<br />
that a majority of land in the study area, 61%, was determined to be fully developed or not developable. These<br />
lands were not allocated a TOD place type and did not receive and future buildout potential. The 14% of<br />
land with some redevelopment potential, and the 25% of vacant land, constitute the areas that were assigned<br />
a TOD place type and therefore some future buildout potential in terms of new jobs or dwellings. The areas<br />
with some level of development potential, either vacant or redevelopable, are shown in Figure 5.<br />
SUMMARY ACRES PERCENT OF TOTAL<br />
Developed /Unbuildable 41,225 61%<br />
Redevelopable 9,480 14%<br />
Vacant 16,966 25%<br />
Total 67,672 100%<br />
Table 7: Development Potential Summarized<br />
A-10 | Appendix A: Analysis of TOD Potential
City of <strong>Jacksonville</strong><br />
<strong>Policy</strong> <strong>Framework</strong> for Transit-Oriented Development<br />
TRANSIT<br />
CORRIDOR/AREA<br />
TOTAL ACRES<br />
DEVELOPED<br />
HIGH REDEV<br />
POTENTIAL<br />
MEDIUM REDEV<br />
POTENTIAL<br />
LOW REDEV<br />
POTENTIAL<br />
UNBUILDABLE<br />
VACANT<br />
Rapid Trans - Corridor A 10,020 5,000 1,291 370 355 1,243 1,762<br />
Rapid Trans - Corridor B 9,072 5,020 927 342 307 1,302 1,174<br />
Rapid Trans - Corridor C 7,485 3,212 1,159 406 407 1,182 1,118<br />
Rapid Trans - Corridor D 6,479 4,040 762 243 173 581 679<br />
Rapid Trans - Corridor E 4,975 3,077 387 207 122 373 808<br />
Rapid Trans - Corridor F 7,184 2,926 450 305 138 1,111 2,254<br />
Rapid Trans - Corridor G 2,344 1,283 141 51 49 495 325<br />
Commuter Rail 37,903 13,979 3,280 959 925 7,160 11,600<br />
Skyway 1,317 544 290 74 58 209 143<br />
Street Car 3,552 1,880 645 176 113 371 366<br />
HFT Station 4,276 1,636 238 60 44 1,359 938<br />
Table 8: Development Potential by Corridor (Acres)<br />
TRANSIT CORRIDOR/<br />
AREA<br />
TOTAL ACRES<br />
DEVELOPED<br />
HIGH REDEV<br />
POTENTIAL<br />
MEDIUM REDEV<br />
POTENTIAL<br />
LOW REDEV<br />
POTENTIAL<br />
UNBUILDABLE<br />
VACANT<br />
Rapid Trans - Corridor A 10,020 50% 13% 4% 4% 12% 18%<br />
Rapid Trans - Corridor B 9,072 55% 10% 4% 3% 14% 13%<br />
Rapid Trans - Corridor C 7,485 43% 15% 5% 5% 16% 15%<br />
Rapid Trans - Corridor D 6,479 62% 12% 4% 3% 9% 10%<br />
Rapid Trans - Corridor E 4,975 62% 8% 4% 2% 8% 16%<br />
Rapid Trans - Corridor F 7,184 41% 6% 4% 2% 15% 31%<br />
Rapid Trans - Corridor G 2,344 55% 6% 2% 2% 21% 14%<br />
Commuter Rail 37,903 37% 9% 3% 2% 19% 31%<br />
Skyway 1,317 41% 22% 6% 4% 16% 11%<br />
Street Car 3,552 53% 18% 5% 3% 10% 10%<br />
HFT Station 4,276 46% 7% 2% 1% 38% 26%<br />
Table 9: Development Potential by Corridor (Percentage)<br />
Appendix A: Analysis of TOD Potential | A-11
103rd St<br />
Garden St<br />
Crystal Springs Rd<br />
Prichard Rd<br />
Collins Rd<br />
Wilson Blvd<br />
Dunn Ave<br />
Park St<br />
San Juan Blvd<br />
Kingsley Ave<br />
Bowden Rd<br />
Arlington Expy<br />
Zoo Parkway<br />
Old St Augustine Rd<br />
Southside Blvd<br />
Baymeadows Rd<br />
Heckscher Dr<br />
J Turner Butler<br />
Beach Blvd<br />
City of <strong>Jacksonville</strong><br />
<strong>Policy</strong> <strong>Framework</strong> for Transit-Oriented Development<br />
95<br />
Development/Redevelopment Potential<br />
Ye low Blu f Rd<br />
REDEV1 - High Potential<br />
REDEV2 - Med Potential<br />
Starre t Rd<br />
REDEV3 - Low Potential<br />
Lem Turner Rd<br />
VAC - Vacant (High Potential)<br />
New Berlin Rd<br />
(Fully developed or undevelopable<br />
parcels not shown)<br />
9A<br />
1<br />
295<br />
Kings Rd<br />
Monument Rd<br />
Beaver St<br />
90<br />
Atlantic Blvd<br />
Atlantic Blvd<br />
10<br />
Normandy Blvd<br />
17<br />
St Johns River<br />
295<br />
9A<br />
San Jose Blvd<br />
95<br />
Old Middleburg Rd<br />
Hood Rd<br />
1<br />
17<br />
95<br />
0 5<br />
Miles<br />
Figure 5: Study Area Parcels by Development Potential Category<br />
TRANSIT CORRIDOR/AREA<br />
TOTAL ACRES<br />
DEVELOPED OR<br />
UNBUILDABLE<br />
REDEVELOP-<br />
ABLE<br />
VACANT<br />
Rapid Trans - Corridor A 10,020 62% 20% 18%<br />
Rapid Trans - Corridor B 9,072 70% 17% 13%<br />
Rapid Trans - Corridor C 7,485 59% 26% 15%<br />
Rapid Trans - Corridor D 6,479 71% 18% 10%<br />
Rapid Trans - Corridor E 4,975 69% 14% 16%<br />
Rapid Trans - Corridor F 7,184 56% 12% 31%<br />
Rapid Trans - Corridor G 2,344 76% 10% 14%<br />
Commuter Rail 37,903 56% 14% 31%<br />
Skyway 1,317 57% 32% 11%<br />
Street Car 3,552 63% 26% 10%<br />
HFT Station Area 4,276 84% 10% 26%<br />
A-12 | Appendix A: Analysis of TOD Potential<br />
Table 10: Development Potential by Corridor - Summary
103rd St<br />
Garden St<br />
Crystal Springs Rd<br />
Prichard Rd<br />
Collins Rd<br />
Wilson Blvd<br />
Dunn Ave<br />
Park St<br />
San Juan Blvd<br />
Kingsley Ave<br />
Bowden Rd<br />
Arlington Expy<br />
Zoo Parkway<br />
Old St Augustine Rd<br />
Southside Blvd<br />
Baymeadows Rd<br />
Heckscher Dr<br />
J Turner Butler<br />
Beach Blvd<br />
City of <strong>Jacksonville</strong><br />
<strong>Policy</strong> <strong>Framework</strong> for Transit-Oriented Development<br />
TOD Place Types<br />
S1 Campus/Facilities<br />
95<br />
S2 Town Center<br />
S3 Village<br />
Ye low Blu f Rd<br />
S4 Suburban Neighborhood<br />
SC Suburban Corridor<br />
Starre t Rd<br />
U1 Downtown<br />
Lem Turner Rd<br />
U2 Urban Center<br />
New Berlin Rd<br />
U3 Main Street<br />
U4 Urban Neighborhood<br />
UC Urban Corridor<br />
Commuter Stations<br />
1<br />
295<br />
9A<br />
Kings Rd<br />
Monument Rd<br />
Beaver St<br />
90<br />
Atlantic Blvd<br />
Atlantic Blvd<br />
10<br />
Normandy Blvd<br />
17<br />
St Johns River<br />
295<br />
9A<br />
San Jose Blvd<br />
95<br />
Old Middleburg Rd<br />
Hood Rd<br />
1<br />
17<br />
95<br />
0 5<br />
Miles<br />
Figure 6: TOD Place Types<br />
TOD PLACE MAKING<br />
ELEMENT<br />
AVERAGE<br />
DU PER ACRE<br />
AVERAGE FAR<br />
(NON-RES ONLY)<br />
EMPLOYMENT PER<br />
ACRE<br />
S1 Campus 0.0 1.2 89.2<br />
S2 Town Center 28.7 3.3 103.5<br />
S3 Village 10.1 0.8 20.9<br />
S4 Suburban Neighborhood 7.7 0.6 10.3<br />
SC Suburban Corridor 7.7 0.6 10.3<br />
U1 Downtown 47.5 5.0 299.8<br />
U2 Urban Center 23.1 2.6 173.4<br />
U3 Main Street 16.3 1.4 61.9<br />
U4 Urban Neighborhood 15.6 0.9<br />
UC Urban Corridor 15.6 0.9 15.6<br />
Table 11: TOD Place Making Element Density/Intensity<br />
Appendix A: Analysis of TOD Potential | A-13
103rd St<br />
Garden St<br />
Crystal Springs Rd<br />
Prichard Rd<br />
Collins Rd<br />
Wilson Blvd<br />
Dunn Ave<br />
Park St<br />
San Juan Blvd<br />
Kingsley Ave<br />
Bowden Rd<br />
Arlington Expy<br />
Zoo Parkway<br />
Old St Augustine Rd<br />
Southside Blvd<br />
Baymeadows Rd<br />
Heckscher Dr<br />
J Turner Butler<br />
Beach Blvd<br />
City of <strong>Jacksonville</strong><br />
<strong>Policy</strong> <strong>Framework</strong> for Transit-Oriented Development<br />
Creating a Virtual Future – Evaluating TOD Potential<br />
A virtual future was created to test the future buildout potential of different TOD policies. The steps in this<br />
process involved identifying the location of future transit hubs (stations areas), and assigning them one of<br />
eight station area, or one of two corridor TOD place types. A typology map of TOD Place Types is shown in<br />
Figure 6. Station areas were assigned to a half-mile area, or buffer, around each hub. The corridors between the<br />
hubs were either assigned an urban corridor, or a suburban corridor place type based depending on where that<br />
corridor intersected with <strong>Jacksonville</strong>’s 2030 Mobility Plan development area designation (Central Business;<br />
Urban Priority, Suburban Priority, see Figure 3 in the <strong>Policy</strong> <strong>Framework</strong>).<br />
Each TOD place making element has associated with it a density and intensity intention for the policy framework.<br />
The density/intensity values are shown in Table 11. The average dwelling units/acre and employment/acre for<br />
each TOD place type is typically given as a variable range, but for purposes of this buildout an exact figure was<br />
adopted. The place making elements were composed and allocated to study area parcels in GIS using CorPlan<br />
- a land use evaluation and allocation tool.<br />
The density/intensity values shown in Table 11 were applied only to study parcels determined to be vacant or<br />
redevelopable to some degree. A map of the TOD place type allocation to study area vacant and redevelopment<br />
parcels is shown in Figure 7. Areas that were vacant or that had high redevelopment potential received 100%<br />
of the TOD potential jobs and houses. Areas of medium redevelopment potential received 66% of the full<br />
TOD buildout, and areas of low redevelopment potential received 33%. In addition, any developable parcel<br />
TOD Place Making Elements Allocated<br />
to Vacant/Redevelopable Parcels<br />
S1 Campus<br />
S2 Town Center<br />
95<br />
S3 Village<br />
Ye low Blu f Rd<br />
S4 Suburban Neighborhood<br />
SC Suburban Corridor<br />
U1 Downtown<br />
Starre t Rd<br />
Lem Turner Rd<br />
U2 Urban Center<br />
U3 Main Street<br />
New Berlin Rd<br />
U4 Urban Neighborhood<br />
UC Urban Corridor<br />
1<br />
295<br />
9A<br />
TOD Study Area<br />
Kings Rd<br />
Monument Rd<br />
Beaver St<br />
90<br />
Atlantic Blvd<br />
Atlantic Blvd<br />
10<br />
Normandy Blvd<br />
17<br />
St Johns River<br />
295<br />
9A<br />
San Jose Blvd<br />
95<br />
Old Middleburg Rd<br />
Hood Rd<br />
1<br />
17<br />
95<br />
0 5<br />
Miles<br />
A-14 | Appendix A: Analysis of TOD Potential<br />
Figure 7: TOD Place Types Allocated to Vacant/Redevelopable Parcels
City of <strong>Jacksonville</strong><br />
<strong>Policy</strong> <strong>Framework</strong> for Transit-Oriented Development<br />
that qualified for the residential-neighborhood 'Scale Transition' protection had the development potential<br />
reduced by 15%. The definition of parcels qualifying for this residential-neighborhood, “scaled transition”<br />
protection comes from the City of <strong>Jacksonville</strong> Comprehensive plan, “In order to maintain and enhance existing<br />
residential enclaves and low density residential areas, the commercial, industrial, Medium Density Residential, and<br />
High Density Residential future land use category descriptions shall include provisions for general neighborhood<br />
protection.”<br />
Table 12 shows the potential for new dwelling units and jobs within the total area for each TOD place type<br />
within the study area. Table 13 shows the total acres for each TOD place type, the jobs/housing ratio for each<br />
and the potential dwelling units per acre and employees per acre that could be achieved with the TOD areas.<br />
TOD Place Type Dwellings Percent of Total Jobs Percent of Total<br />
S1 Campus 0 0% 49,029 6%<br />
S2 Town Center 32,373 11% 116,499 14%<br />
S3 Village 26,506 9% 54,764 7%<br />
S4 Suburban Neighborhood 7,435 2% 9,892 1%<br />
SC Suburban Corridor 85,234 28% 113,409 14%<br />
U1 Downtown 26,026 9% 164,351 20%<br />
U2 Urban Center 16,800 6% 126,330 16%<br />
U3 Main Street 24,290 8% 92,203 11%<br />
U4 Urban Neighborhood 7,253 2% 7,304 1%<br />
UC Urban Corridor 74,262 25% 74,792 9%<br />
Total 300,178 808,573<br />
Table 12: Potential New Dwelling Units and Jobs by Place Type<br />
TOD Place Type<br />
Acres<br />
(Vac/Redev)<br />
Percent of<br />
Total<br />
Jobs/Housing<br />
Ratio<br />
DU/Acre<br />
EMP/Acre<br />
S1 Campus 578 2% na 0.0 84.8<br />
S2 Town Center 1,263 5% 1.34 25.6 92.2<br />
S3 Village 2,870 11% 0.77 9.2 19.1<br />
S4 Suburban Neighborhood 997 4% 0.49 7.5 9.9<br />
SC Suburban Corridor 11,404 43% 0.49 7.5 9.9<br />
U1 Downtown 607 2% 2.34 42.9 270.9<br />
U2 Urban Center 882 3% 2.79 19.1 143.3<br />
U3 Main Street 1,829 7% 1.41 13.3 50.4<br />
U4 Urban Neighborhood 5,443 21% 0.37 13.6 13.7<br />
UC Urban Corridor 574 2% 0.37 12.6 12.7<br />
Total 26,447 2.69<br />
Table 13: Potential Acres Developed by Place Type<br />
Appendix A: Analysis of TOD Potential | A-15
City of <strong>Jacksonville</strong><br />
<strong>Policy</strong> <strong>Framework</strong> for Transit-Oriented Development<br />
The final tables combine the existing and future dwelling units and jobs by TOD place type and transit<br />
corridor/area. Table 14 shows the future potential for new dwelling units and jobs within the TOD area by<br />
transit corridor/area. It also shows the potential average dwelling unit per acre and employment per acre with<br />
each corridor/area. Table 15 shows the existing plus future total potential buildout for each corridor/area. The<br />
dwelling units and employment are the sum of what is in Tables 1, 2 and 14.<br />
Transit Corridor/Area<br />
Future<br />
Dwellings<br />
Future<br />
Jobs<br />
Acres<br />
Vac/Redev<br />
Jobs/<br />
Housing<br />
Average<br />
DU/Acre<br />
Average<br />
EMP/Acre<br />
Rapid Trans - Corridor A 59,888 248,180 3,778 4.14 15.85 65.70<br />
Rapid Trans - Corridor B 54,381 225,840 2,750 4.15 19.77 82.11<br />
Rapid Trans - Corridor C 52,596 196,941 3,091 3.74 17.01 63.71<br />
Rapid Trans - Corridor D 30,370 118,218 1,857 3.89 16.35 63.64<br />
Rapid Trans - Corridor E 25,079 102,710 1,524 4.10 16.46 67.40<br />
Rapid Trans - Corridor F 35,251 113,121 3,148 3.21 11.20 35.94<br />
Rapid Trans - Corridor G 10,969 40,668 566 3.71 19.38 71.86<br />
Commuter Rail 185,664 449,885 16,764 2.42 11.08 26.84<br />
Skyway 19,722 117,956 564 5.98 34.95 209.07<br />
Street Car 35,908 187,823 1,301 5.23 27.60 144.39<br />
HFT Station Area 11,771 58,001 1,281 4.93 9.19 45.26<br />
Table 14: Potential New Development Summarized by Transit Corridor/Area<br />
Virtual Future (Existing<br />
+ TOD Buildout)<br />
Dwelling<br />
Units<br />
Employment<br />
Jobs/House<br />
Ratio<br />
Average DU/<br />
Acre<br />
Average<br />
Emp/Acre<br />
Rapid Trans - Corridor A 79,265 309,247 3.90 10.98 41.48<br />
Rapid Trans - Corridor B 75,403 290,199 3.85 13.32 50.48<br />
Rapid Trans - Corridor C 62,613 277,065 4.43 12.33 43.17<br />
Rapid Trans - Corridor D 46,658 164,239 3.52 11.16 42.53<br />
Rapid Trans - Corridor E 37,195 143,559 3.86 11.12 46.94<br />
Rapid Trans - Corridor F 44,219 130,286 2.95 8.44 22.37<br />
Rapid Trans - Corridor G 16,450 52,166 3.17 14.04 43.79<br />
Commuter Rail 232,215 575,897 2.48 8.13 19.62<br />
Skyway 20,719 167,182 8.07 28.32 137.43<br />
Street Car 45,352 264,005 5.82 19.70 96.21<br />
HFT Station Area 17,984 61,151 3.40 6.61 23.80<br />
Table 15: Total Future Buildout – Existing and Future Potential<br />
A-16 | Appendix A: Analysis of TOD Potential
City of <strong>Jacksonville</strong><br />
<strong>Policy</strong> <strong>Framework</strong> for Transit-Oriented Development<br />
Summary<br />
The full TOD potential buildout for the whole study area of 300,178 new dwellings and 808,573 new jobs<br />
represents a maximum possible buildout based on TOD policies (density/intensity) as applied to land currently<br />
evaluated to be developable or redevelopable. Full buildouts are seldom realized, however the significant<br />
potential shows that if transit oriented policies are realized a significant number of future households and jobs<br />
can be served by transit investments.<br />
The intensity /density and mix of use guidelines included in the Design Guidelines for Transit Oriented<br />
Development are informed by the analysis included in this Appendix. TOD within the designated rapid transit<br />
corridors and station areas represents a small proportion of land in the City of <strong>Jacksonville</strong> but has a significant<br />
development potential. In order to represent realistic growth targets and manage the long term jobs to housing<br />
balance within and outside the rapid transit corridors, the station area and corridor intensity/density in the<br />
design guidelines are adjusted lower.<br />
Appendix A: Analysis of TOD Potential | A-17
City of <strong>Jacksonville</strong><br />
<strong>Policy</strong> <strong>Framework</strong> for Transit-Oriented Development<br />
References and Resources<br />
“City of <strong>Jacksonville</strong> 2030 Comprehensive Plan”, November 2010, City of <strong>Jacksonville</strong> Planning and Development<br />
Department<br />
“City of <strong>Jacksonville</strong> 2030 Mobility Plan”, November 2010, City of <strong>Jacksonville</strong> Planning and Development<br />
Department<br />
“<strong>Jacksonville</strong> Florida Transit Initiatives”, <strong>Jacksonville</strong> <strong>Transportation</strong> <strong>Authority</strong>, July 14, 2009<br />
“<strong>Policy</strong> of the <strong>Jacksonville</strong> <strong>Transportation</strong> <strong>Authority</strong> for Development Adjacent to Transit Facilities”, <strong>Jacksonville</strong><br />
<strong>Transportation</strong> <strong>Authority</strong>, September 10, 2008<br />
“City of <strong>Jacksonville</strong>, Ordinance 2007-587-E”, Enacted June 27, 2007<br />
“<strong>Jacksonville</strong> Design Guidelines and Best Practices Handbook” Prepared by Miller, Sellen, Conner, & Walsh<br />
“TOD 101: Why Transit-Oriented Development and Why Now?” By Reconnecting America and the Center for<br />
Transit-Oriented Development, www.reconnectingamerica.org<br />
“TOD 202: Station Area Planning, How to Make Great Transit-Oriented Places” By Reconnecting America and<br />
the Center for Transit-Oriented Development, www.reconnectingamerica.org<br />
“Vine Street Redevelopment Overlay Design Guidelines”, City of Kissimmee, Florida, November 13, 2009,<br />
Prepared by Renaissance Planning Group<br />
“SmartCode v 9.2” www.SmartCodeCentral.org<br />
“Florida Department of <strong>Transportation</strong>, Transit Oriented Development Design Guidelines”, Draft April ‘09<br />
Some Images were courtesy the Reconnecting America Image bank, www.reconnectingamerica.org<br />
A-18 | Appendix A: Analysis of TOD Potential