Policy Framework - Jacksonville Transportation Authority
Policy Framework - Jacksonville Transportation Authority
Policy Framework - Jacksonville Transportation Authority

You also want an ePaper? Increase the reach of your titles
YUMPU automatically turns print PDFs into web optimized ePapers that Google loves.
103rd St<br />
Garden St<br />
Crystal Springs Rd<br />
Prichard Rd<br />
Collins Rd<br />
Wilson Blvd<br />
Dunn Ave<br />
Park St<br />
San Juan Blvd<br />
Kingsley Ave<br />
Bowden Rd<br />
Arlington Expy<br />
Zoo Parkway<br />
Old St Augustine Rd<br />
Southside Blvd<br />
Baymeadows Rd<br />
Heckscher Dr<br />
J Turner Butler<br />
Beach Blvd<br />
City of <strong>Jacksonville</strong><br />
<strong>Policy</strong> <strong>Framework</strong> for Transit-Oriented Development<br />
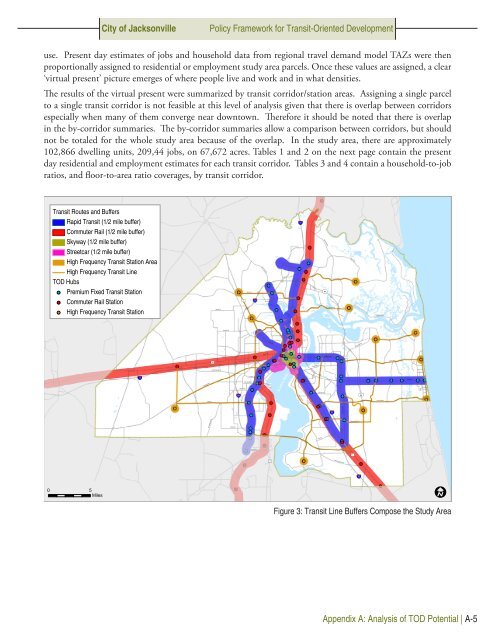
use. Present day estimates of jobs and household data from regional travel demand model TAZs were then<br />
proportionally assigned to residential or employment study area parcels. Once these values are assigned, a clear<br />
‘virtual present’ picture emerges of where people live and work and in what densities.<br />
The results of the virtual present were summarized by transit corridor/station areas. Assigning a single parcel<br />
to a single transit corridor is not feasible at this level of analysis given that there is overlap between corridors<br />
especially when many of them converge near downtown. Therefore it should be noted that there is overlap<br />
in the by-corridor summaries. The by-corridor summaries allow a comparison between corridors, but should<br />
not be totaled for the whole study area because of the overlap. In the study area, there are approximately<br />
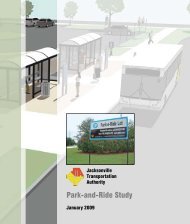
102,866 dwelling units, 209,44 jobs, on 67,672 acres. Tables 1 and 2 on the next page contain the present<br />
day residential and employment estimates for each transit corridor. Tables 3 and 4 contain a household-to-job<br />
ratios, and floor-to-area ratio coverages, by transit corridor.<br />
Transit Routes and Buffers<br />
Rapid Transit (1/2 mile buffer)<br />
95<br />
Commuter Rail (1/2 mile buffer)<br />
Skyway (1/2 mile buffer)<br />
Ye low Blu f Rd<br />
Streetcar (1/2 mile buffer)<br />
High Frequency Transit Station Area<br />
Starre t Rd<br />
High Frequency Transit Line<br />
TOD Hubs<br />
Lem Turner Rd<br />
New Berlin Rd<br />
Premium Fixed Transit Station<br />
Commuter Rail Station<br />
1<br />
295<br />
9A<br />
High Frequency Transit Station<br />
Kings Rd<br />
Monument Rd<br />
Beaver St<br />
90<br />
Atlantic Blvd<br />
Atlantic Blvd<br />
10<br />
Normandy Blvd<br />
17<br />
St Johns River<br />
295<br />
9A<br />
San Jose Blvd<br />
95<br />
Old Middleburg Rd<br />
Hood Rd<br />
1<br />
17<br />
95<br />
0 5<br />
Miles<br />
Figure 3: Transit Line Buffers Compose the Study Area<br />
Appendix A: Analysis of TOD Potential | A-5