Policy Framework - Jacksonville Transportation Authority
Policy Framework - Jacksonville Transportation Authority
Policy Framework - Jacksonville Transportation Authority

You also want an ePaper? Increase the reach of your titles
YUMPU automatically turns print PDFs into web optimized ePapers that Google loves.
103rd St<br />
Garden St<br />
Crystal Springs Rd<br />
Prichard Rd<br />
Collins Rd<br />
Wilson Blvd<br />
Dunn Ave<br />
Park St<br />
San Juan Blvd<br />
Kingsley Ave<br />
Bowden Rd<br />
Arlington Expy<br />
Zoo Parkway<br />
Old St Augustine Rd<br />
Southside Blvd<br />
Baymeadows Rd<br />
Heckscher Dr<br />
J Turner Butler<br />
Beach Blvd<br />
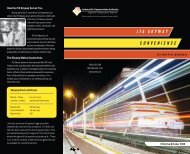
City of <strong>Jacksonville</strong><br />
<strong>Policy</strong> <strong>Framework</strong> for Transit-Oriented Development<br />
Rapid Fixed- Transit Corridors<br />
Rapid A<br />
95<br />
Rapid B<br />
Rapid C<br />
Ye low Blu f Rd<br />
Rapid D<br />
Rapid E<br />
Starre t Rd<br />
Rapid F<br />
Lem Turner Rd<br />
Rapid G<br />
New Berlin Rd<br />
1<br />
295<br />
F<br />
9A<br />
E<br />
G<br />
Kings Rd<br />
B<br />
Monument Rd<br />
Beaver St<br />
90<br />
Atlantic Blvd<br />
A<br />
Atlantic Blvd<br />
10<br />
Normandy Blvd<br />
17<br />
St Johns River<br />
C<br />
295<br />
9A<br />
San Jose Blvd<br />
D<br />
95<br />
Old Middleburg Rd<br />
Hood Rd<br />
1<br />
17<br />
95<br />
0 5<br />
Miles<br />
Where Do People Live and Work Today?<br />
A-4 | Appendix A: Analysis of TOD Potential<br />
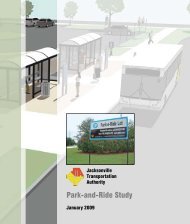
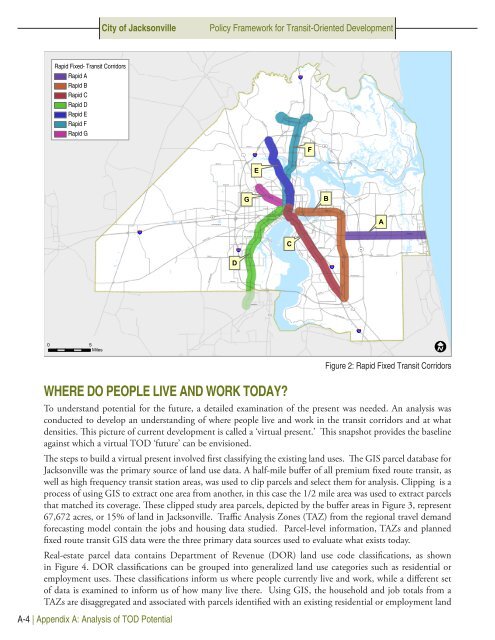
Figure 2: Rapid Fixed Transit Corridors<br />
To understand potential for the future, a detailed examination of the present was needed. An analysis was<br />
conducted to develop an understanding of where people live and work in the transit corridors and at what<br />
densities. This picture of current development is called a ‘virtual present.’ This snapshot provides the baseline<br />
against which a virtual TOD ‘future’ can be envisioned.<br />
The steps to build a virtual present involved first classifying the existing land uses. The GIS parcel database for<br />
<strong>Jacksonville</strong> was the primary source of land use data. A half-mile buffer of all premium fixed route transit, as<br />
well as high frequency transit station areas, was used to clip parcels and select them for analysis. Clipping is a<br />
process of using GIS to extract one area from another, in this case the 1/2 mile area was used to extract parcels<br />
that matched its coverage. These clipped study area parcels, depicted by the buffer areas in Figure 3, represent<br />
67,672 acres, or 15% of land in <strong>Jacksonville</strong>. Traffic Analysis Zones (TAZ) from the regional travel demand<br />
forecasting model contain the jobs and housing data studied. Parcel-level information, TAZs and planned<br />
fixed route transit GIS data were the three primary data sources used to evaluate what exists today.<br />
Real-estate parcel data contains Department of Revenue (DOR) land use code classifications, as shown<br />
in Figure 4. DOR classifications can be grouped into generalized land use categories such as residential or<br />
employment uses. These classifications inform us where people currently live and work, while a different set<br />
of data is examined to inform us of how many live there. Using GIS, the household and job totals from a<br />
TAZs are disaggregated and associated with parcels identified with an existing residential or employment land