Policy Framework - Jacksonville Transportation Authority
Policy Framework - Jacksonville Transportation Authority
Policy Framework - Jacksonville Transportation Authority

You also want an ePaper? Increase the reach of your titles
YUMPU automatically turns print PDFs into web optimized ePapers that Google loves.
City of <strong>Jacksonville</strong><br />
<strong>Policy</strong> <strong>Framework</strong> for Transit-Oriented Development<br />
What Could Change?<br />
After determining a virtual present, the next phase in understanding a future TOD scenario was to evaluate<br />
the potential for change. Vacant areas have the highest potential to develop, while high investment areas, such<br />
as established single family neighborhoods or tall office condos, probably have very low or no redevelopment<br />
potential. Parcels with existing development may have different potential for change based on land use or<br />
tax assessment values. Real-estate parcel data contains an improvement value and land value assessments.<br />
Improvement values are a measure of the total investment in building or other enhancements made to realestate.<br />
Land values are assessments of just the land before any improvements. Both assessment values come<br />
from the local assessors office. The ratio of improvement value to land value is a useful indicator of how much<br />
investment has been made on a property, and thus its potential to develop more in the future. A combination<br />
of DOR land use status, and tax assessment value were studied for all parcels in the transit corridor study<br />
area. The ratio of improvement value to land value was calculated, averaged, and then grouped by percentile<br />
to determine a parcel’s redevelopment potential for increased investment. Table 5 below shows an example<br />
of how an average improvement-to-land ratio was classified into redevelopment status based on a percentile<br />
grouping.<br />
The different redevelopment potential categories listed in Table 5 were assigned each parcel. These categories<br />
are explained further in Table 6, and quantified in Tables 7-10.<br />
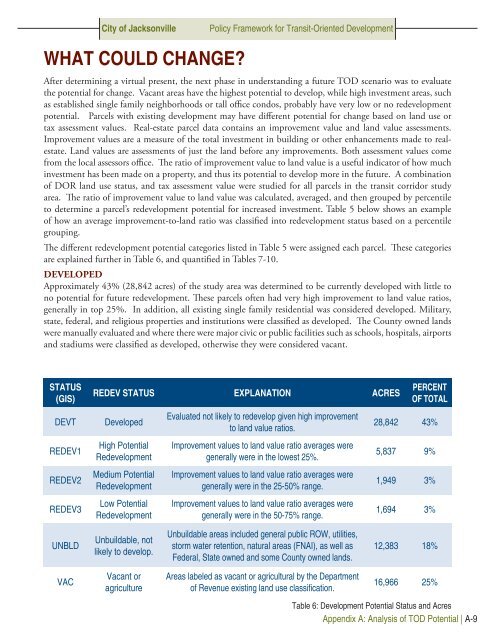
Developed<br />
Approximately 43% (28,842 acres) of the study area was determined to be currently developed with little to<br />
no potential for future redevelopment. These parcels often had very high improvement to land value ratios,<br />
generally in top 25%. In addition, all existing single family residential was considered developed. Military,<br />
state, federal, and religious properties and institutions were classified as developed. The County owned lands<br />
were manually evaluated and where there were major civic or public facilities such as schools, hospitals, airports<br />
and stadiums were classified as developed, otherwise they were considered vacant.<br />
STATUS<br />
(GIS)<br />
DEVT<br />
REDEV1<br />
REDEV2<br />
REDEV3<br />
REDEV STATUS EXPLANATION ACRES<br />
Developed<br />
High Potential<br />
Redevelopment<br />
Medium Potential<br />
Redevelopment<br />
Low Potential<br />
Redevelopment<br />
Evaluated not likely to redevelop given high improvement<br />
to land value ratios.<br />
Improvement values to land value ratio averages were<br />
generally were in the lowest 25%.<br />
Improvement values to land value ratio averages were<br />
generally were in the 25-50% range.<br />
Improvement values to land value ratio averages were<br />
generally were in the 50-75% range.<br />
PERCENT<br />
OF TOTAL<br />
28,842 43%<br />
5,837 9%<br />
1,949 3%<br />
1,694 3%<br />
UNBLD<br />
Unbuildable, not<br />
likely to develop.<br />
Unbuildable areas included general public ROW, utilities,<br />
storm water retention, natural areas (FNAI), as well as<br />
Federal, State owned and some County owned lands.<br />
12,383 18%<br />
VAC<br />
Vacant or<br />
agriculture<br />
Areas labeled as vacant or agricultural by the Department<br />
of Revenue existing land use classification.<br />
16,966 25%<br />
Table 6: Development Potential Status and Acres<br />
Appendix A: Analysis of TOD Potential | A-9