Ground-Water Hydrology of the Upper Klamath Basin, Oregon and ...
Ground-Water Hydrology of the Upper Klamath Basin, Oregon and ...
Ground-Water Hydrology of the Upper Klamath Basin, Oregon and ...

You also want an ePaper? Increase the reach of your titles
YUMPU automatically turns print PDFs into web optimized ePapers that Google loves.
50 <strong>Ground</strong>-<strong>Water</strong> <strong>Hydrology</strong> <strong>of</strong> <strong>the</strong> <strong>Upper</strong> <strong>Klamath</strong> <strong>Basin</strong>, <strong>Oregon</strong> <strong>and</strong> California<br />
wells were measured quarterly during this study by <strong>the</strong> USGS<br />
for periods ranging from 1 to 6 years (fig. 22). Nineteen wells<br />
were instrumented with continuous recorders, devices that<br />
measure <strong>and</strong> record <strong>the</strong> water-level elevation every 2 hours.<br />
Graphs <strong>of</strong> water-level fluctuations in all <strong>of</strong> <strong>the</strong> wells monitored<br />
by <strong>the</strong> USGS are available on <strong>the</strong> USGS web site (http://<br />
waterdata.usgs.gov/or/nwis/gw). Not all wells monitored in<br />
<strong>the</strong> upper <strong>Klamath</strong> <strong>Basin</strong> are shown in figure 22. Scores <strong>of</strong><br />
additional wells have been or currently are monitored by <strong>the</strong><br />
CDWR <strong>and</strong> <strong>the</strong> OWRD for specific purposes. Data from <strong>the</strong><br />
wells shown in figure 22, which includes all wells monitored<br />
by <strong>the</strong> USGS, provide a comprehensive picture <strong>of</strong> <strong>the</strong> dynamic<br />
nature <strong>of</strong> <strong>the</strong> regional ground-water system.<br />
Climate-Induced Fluctuations<br />
<strong>Water</strong> levels in most wells fluctuate in response to natural,<br />
climate-induced changes in recharge. The greatest response<br />
to climate-induced water-level fluctuations in <strong>the</strong> upper<br />
<strong>Klamath</strong> <strong>Basin</strong> occurs in <strong>the</strong> Cascade Range. The response to<br />
diminished precipitation (<strong>and</strong> hence recharge) in <strong>the</strong> Cascade<br />
Range during <strong>the</strong> current drought cycle is exemplified by <strong>the</strong><br />
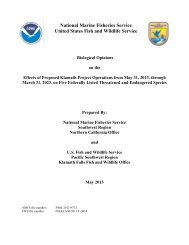
hydrograph <strong>of</strong> well 30S/07E-06AAA on <strong>the</strong> lower eastern<br />
flank <strong>of</strong> <strong>the</strong> Crater Lake highl<strong>and</strong>s (fig. 23). The water level in<br />
that well has declined approximately 12 ft since 2000 because<br />
<strong>of</strong> climate-related decreased recharge. On <strong>the</strong> eastern side <strong>of</strong><br />
<strong>the</strong> basin, a similar post-2000 trend exists in well 36S/14E-<br />
25BCB (fig. 24), but <strong>the</strong> magnitude <strong>of</strong> <strong>the</strong> recent decline is<br />
less. A comparison <strong>of</strong> <strong>the</strong>se water-level fluctuations with<br />
precipitation at Crater Lake in <strong>the</strong> Cascade Range (fig. 24)<br />
shows that periods <strong>of</strong> rising ground-water levels generally<br />
correspond to periods <strong>of</strong> increasing precipitation, <strong>and</strong> falling<br />
water-levels correspond to periods <strong>of</strong> decreasing precipitation.<br />
Figure 24 also shows that <strong>the</strong> decadal drought cycles are<br />
responsible for <strong>the</strong> largest water-level fluctuations. During<br />
periods <strong>of</strong> abundant precipitation, <strong>the</strong> rate <strong>of</strong> ground-water<br />
recharge exceeds, at least temporarily, <strong>the</strong> rate <strong>of</strong> discharge.<br />
When ground-water recharge exceeds discharge, <strong>the</strong> amount <strong>of</strong><br />
ground water in storage must increase, causing <strong>the</strong> water table<br />
to rise. During dry periods, in contrast, <strong>the</strong> rate <strong>of</strong> discharge<br />
exceeds <strong>the</strong> rate <strong>of</strong> recharge, <strong>and</strong> ground-water levels decline<br />
as a result.<br />
<strong>Water</strong> table fluctuations in response to variations in<br />
recharge are most prominent in <strong>the</strong> Cascade Range, <strong>the</strong><br />
primary recharge area. Climate-related fluctuations may be<br />
difficult to discern in some interior parts <strong>of</strong> <strong>the</strong> basin, for<br />
two reasons. First, precipitation <strong>and</strong>, hence, recharge are<br />
comparatively small in <strong>the</strong> interior parts <strong>of</strong> <strong>the</strong> basin, so<br />
climate-induced water-level fluctuations are correspondingly<br />
small. Second, water levels in <strong>the</strong>se areas are affected by<br />
ground-water pumping, canal operation, <strong>and</strong> irrigation, <strong>the</strong><br />
effects <strong>of</strong> which can mask <strong>the</strong> climate signal.<br />
186<br />
188<br />
190<br />
DEPTH TO WATER, IN FEET<br />
192<br />
194<br />
196<br />
198<br />
200<br />
J M M J S N J M M J S N J M M J S N J M M J S N J M M J S N J M M J S N<br />
2000 2001 2002 2003 2004 2005<br />
Figure 23.<br />
<strong>Water</strong>-level fluctuations in well 30S/07E-06AAA near Bear Creek nor<strong>the</strong>ast <strong>of</strong> Crater Lake, <strong>Oregon</strong>.