Ground-Water Hydrology of the Upper Klamath Basin, Oregon and ...
Ground-Water Hydrology of the Upper Klamath Basin, Oregon and ...
Ground-Water Hydrology of the Upper Klamath Basin, Oregon and ...

You also want an ePaper? Increase the reach of your titles
YUMPU automatically turns print PDFs into web optimized ePapers that Google loves.
62 <strong>Ground</strong>-<strong>Water</strong> <strong>Hydrology</strong> <strong>of</strong> <strong>the</strong> <strong>Upper</strong> <strong>Klamath</strong> <strong>Basin</strong>, <strong>Oregon</strong> <strong>and</strong> California<br />
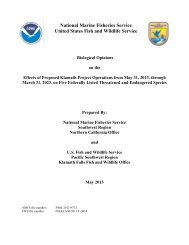
DEPTH TO WATER, IN FEET<br />
0<br />
10<br />
20<br />
30<br />
40<br />
50<br />
48N/04E-35L02<br />
60<br />
1985 1990 1995 2000 2005<br />
Figure 39.<br />
<strong>Water</strong>-level fluctuations in well 48N/04E-35L02 near <strong>the</strong> town <strong>of</strong> Tulelake, California.<br />
The year-to-year water-level declines can be evaluated<br />
by observing <strong>the</strong> changes in water levels between spring 2001<br />
<strong>and</strong> spring 2004 (fig. 40). Although data are sparse in <strong>the</strong><br />
nor<strong>the</strong>rn part <strong>of</strong> <strong>the</strong> area, measurements show that over <strong>the</strong><br />
3-year period, water levels declined more than 10 ft in deep<br />
water-bearing zones (primarily basalt underlying basin-filling<br />
sediments) over more than 135 mi 2 <strong>of</strong> <strong>the</strong> <strong>Klamath</strong> Valley<br />
<strong>and</strong> nor<strong>the</strong>rn Tule Lake subbasin. Declines exceed 15 ft over<br />
an area <strong>of</strong> about 37 mi 2 encompassing <strong>the</strong> State line in <strong>the</strong><br />
Tule Lake subbasin <strong>and</strong> extending southward to <strong>the</strong> town <strong>of</strong><br />
Tulelake <strong>and</strong> northward to Malin. Declines <strong>of</strong> 10–15 ft during<br />
this period are common north <strong>of</strong> Malin. Declines <strong>of</strong> 5 to 10 ft<br />
are common in <strong>the</strong> sou<strong>the</strong>ast part <strong>of</strong> <strong>the</strong> Tule Lake subbasin.<br />
Levels in three wells on <strong>the</strong> Modoc Plateau sou<strong>the</strong>ast <strong>of</strong> <strong>the</strong><br />
Tule Lake subbasin declined 5 to 10 ft (fig. 40). The decline in<br />
this sou<strong>the</strong>rnmost area, where no new pumping has occurred,<br />
is somewhat enigmatic, but may indicate that effects are<br />
propagating sou<strong>the</strong>astward from pumping centers in <strong>the</strong> Tule<br />
Lake subbasin.<br />
If <strong>the</strong> post-2000 pumping rates continue in <strong>the</strong> future, <strong>the</strong><br />
regional ground-water system possibly will eventually achieve<br />
a new state <strong>of</strong> dynamic equilibrium. This will occur when<br />
<strong>the</strong> depression in <strong>the</strong> water table is large enough to redirect<br />
sufficient regional ground-water flow into <strong>the</strong> area to <strong>of</strong>fset<br />
<strong>the</strong> increased pumping. At equilibrium, however, <strong>the</strong> increased<br />
discharge in <strong>the</strong> area <strong>of</strong> pumping must be <strong>of</strong>fset by decreased<br />
discharge elsewhere, likely manifesting itself as a combination<br />
<strong>of</strong> decreased discharge to adjacent basins <strong>and</strong> decreased<br />
discharge to streams, lakes, <strong>and</strong> wetl<strong>and</strong>s.<br />
Certain details are readily apparent from <strong>the</strong> recently<br />
collected data <strong>and</strong> existing knowledge <strong>of</strong> <strong>the</strong> area. <strong>Ground</strong>water<br />
pumping is accompanied by declines in water levels that<br />
occur at a variety <strong>of</strong> temporal <strong>and</strong> spatial scales. The amount<br />
<strong>of</strong> ground water that can be pumped in a period <strong>of</strong> time will<br />
be determined in part by how much drawdown water users<br />
<strong>and</strong> regulatory agencies will tolerate, <strong>and</strong> in part by how<br />
much interference with streams <strong>and</strong> lakes will be considered<br />
acceptable. The drawdown can be easily measured. Where<br />
drawdowns acutely affect individual springs, <strong>the</strong> effects on<br />
discharge may be easy to measure. However, where <strong>the</strong> effects<br />
are to larger streams or lakes <strong>and</strong> represent a small part <strong>of</strong> <strong>the</strong><br />
overall flow, <strong>the</strong>y usually are difficult to discriminate from<br />
o<strong>the</strong>r fluctuations by measurement. Such effects, however, can<br />
be calculated using computer models or analytical methods.<br />
OR19-0048_fig39