Annual Report 2007 - Komatsu
Annual Report 2007 - Komatsu
Annual Report 2007 - Komatsu

You also want an ePaper? Increase the reach of your titles
YUMPU automatically turns print PDFs into web optimized ePapers that Google loves.
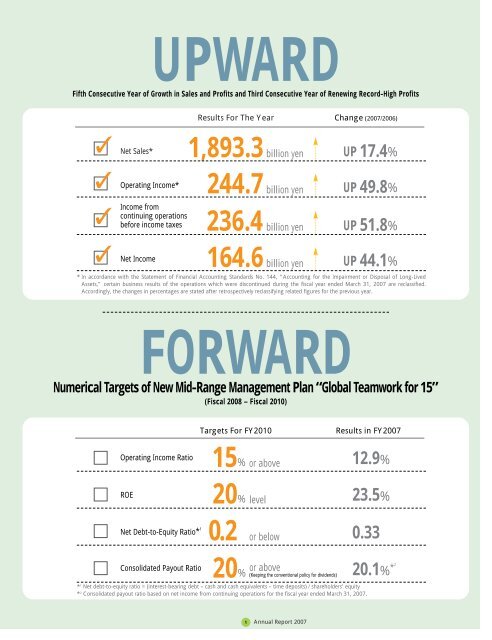
UPWARD<br />
Fifth Consecutive Year of Growth in Sales and Profits and Third Consecutive Year of Renewing Record-High Profits<br />
Results For The Year<br />
Change (<strong>2007</strong>/2006)<br />
✓ Net Sales* 1,893.3 billion yen UP 17.4%<br />
✓ Operating Income*<br />
244.7 billion yen UP 49.8%<br />
✓<br />
Income<br />
from<br />
continuing operations<br />
236.4 billion yen<br />
before income taxes UP 51.8%<br />
✓ Net Income<br />
164.6 billion yen UP 44.1%<br />
* In accordance with the Statement of Financial Accounting Standards No. 144, “Accounting for the Impairment or Disposal of Long-Lived<br />
Assets,” certain business results of the operations which were discontinued during the fiscal year ended March 31, <strong>2007</strong> are reclassified.<br />
Accordingly, the changes in percentages are stated after retrospectively reclassifying related figures for the previous year.<br />
FORWARD<br />
Numerical Targets of New Mid-Range Management Plan “Global Teamwork for 15”<br />
(Fiscal 2008 – Fiscal 2010)<br />
Targets For FY2010<br />
Results in FY<strong>2007</strong><br />
Operating Income Ratio<br />
15% or above 12.9%<br />
ROE<br />
20% level 23.5%<br />
Net Debt-to-Equity Ratio* 1 0.2<br />
or below 0.33<br />
or above<br />
Consolidated Payout Ratio<br />
20.1% *2<br />
20% (Keeping the conventional policy for dividends)<br />
* 1 Net debt-to-equity ratio = (interest-bearing debt – cash and cash equivalents – time deposits) / shareholders’ equity<br />
* 2 Consolidated payout ratio based on net income from continuing operations for the fiscal year ended March 31, <strong>2007</strong>.<br />
1 <strong>Annual</strong> <strong>Report</strong> <strong>2007</strong>