Annual Report 2007 - Komatsu
Annual Report 2007 - Komatsu
Annual Report 2007 - Komatsu

Create successful ePaper yourself
Turn your PDF publications into a flip-book with our unique Google optimized e-Paper software.
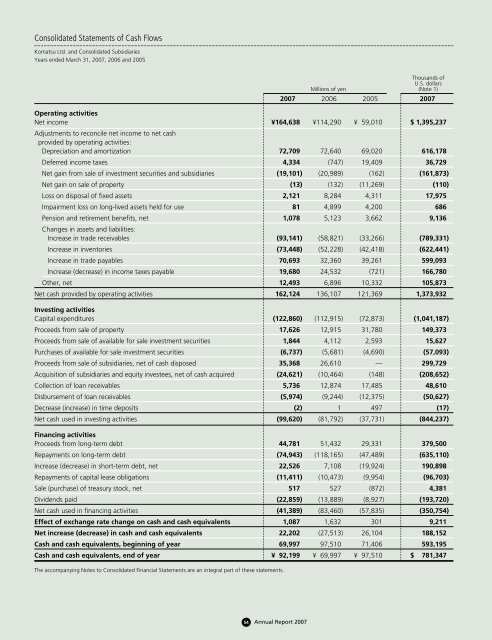
Consolidated Statements of Cash Flows<br />
<strong>Komatsu</strong> Ltd. and Consolidated Subsidiaries<br />
Years ended March 31, <strong>2007</strong>, 2006 and 2005<br />
Thousands of<br />
U.S. dollars<br />
Millions of yen (Note 1)<br />
<strong>2007</strong> 2006 2005 <strong>2007</strong><br />
Operating activities<br />
Net income ¥164,638 ¥114,290 ¥ 59,010 $ 1,395,237<br />
Adjustments to reconcile net income to net cash<br />
provided by operating activities:<br />
Depreciation and amortization 72,709 72,640 69,020 616,178<br />
Deferred income taxes 4,334 (747) 19,409 36,729<br />
Net gain from sale of investment securities and subsidiaries (19,101) (20,989) (162) (161,873)<br />
Net gain on sale of property (13) (132) (11,269) (110)<br />
Loss on disposal of fixed assets 2,121 8,284 4,311 17,975<br />
Impairment loss on long-lived assets held for use 81 4,899 4,200 686<br />
Pension and retirement benefits, net 1,078 5,123 3,662 9,136<br />
Changes in assets and liabilities:<br />
Increase in trade receivables (93,141) (58,821) (33,266) (789,331)<br />
Increase in inventories (73,448) (52,228) (42,418) (622,441)<br />
Increase in trade payables 70,693 32,360 39,261 599,093<br />
Increase (decrease) in income taxes payable 19,680 24,532 (721) 166,780<br />
Other, net 12,493 6,896 10,332 105,873<br />
Net cash provided by operating activities 162,124 136,107 121,369 1,373,932<br />
Investing activities<br />
Capital expenditures (122,860) (112,915) (72,873) (1,041,187)<br />
Proceeds from sale of property 17,626 12,915 31,780 149,373<br />
Proceeds from sale of available for sale investment securities 1,844 4,112 2,593 15,627<br />
Purchases of available for sale investment securities (6,737) (5,681) (4,690) (57,093)<br />
Proceeds from sale of subsidiaries, net of cash disposed 35,368 26,610 — 299,729<br />
Acquisition of subsidiaries and equity investees, net of cash acquired (24,621) (10,464) (148) (208,652)<br />
Collection of loan receivables 5,736 12,874 17,485 48,610<br />
Disbursement of loan receivables (5,974) (9,244) (12,375) (50,627)<br />
Decrease (increase) in time deposits (2) 1 497 (17)<br />
Net cash used in investing activities (99,620) (81,792) (37,731) (844,237)<br />
Financing activities<br />
Proceeds from long-term debt 44,781 51,432 29,331 379,500<br />
Repayments on long-term debt (74,943) (118,165) (47,489) (635,110)<br />
Increase (decrease) in short-term debt, net 22,526 7,108 (19,924) 190,898<br />
Repayments of capital lease obligations (11,411) (10,473) (9,954) (96,703)<br />
Sale (purchase) of treasury stock, net 517 527 (872) 4,381<br />
Dividends paid (22,859) (13,889) (8,927) (193,720)<br />
Net cash used in financing activities (41,389) (83,460) (57,835) (350,754)<br />
Effect of exchange rate change on cash and cash equivalents 1,087 1,632 301 9,211<br />
Net increase (decrease) in cash and cash equivalents 22,202 (27,513) 26,104 188,152<br />
Cash and cash equivalents, beginning of year 69,997 97,510 71,406 593,195<br />
Cash and cash equivalents, end of year ¥ 92,199 ¥ 69,997 ¥ 97,510 $ 781,347<br />
The accompanying Notes to Consolidated Financial Statements are an integral part of these statements.<br />
54 <strong>Annual</strong> <strong>Report</strong> <strong>2007</strong>