Regional Formation 2012,1 - KlaipÄdos universitetas
Regional Formation 2012,1 - KlaipÄdos universitetas
Regional Formation 2012,1 - KlaipÄdos universitetas

You also want an ePaper? Increase the reach of your titles
YUMPU automatically turns print PDFs into web optimized ePapers that Google loves.
Gintarė Pociūtė<br />
THE PROBLEM OF KLAIPĖDA REGION PERIPHERALITY<br />
in this way it is possible to notice if Western Lithuanian region appears peripheral or central in Lithuanian<br />
context. However, it should be stressed that while presenting the statistical data we still have to understand<br />
that positive numbers do not mean that the situation in the region is perfect as there might be hidden factors<br />
that could strain the real region’s situation. For instance, it might be noticed the growing numbers of foreign<br />
direct investment for a person but at the same time it might be admitted that these numbers are growing influenced<br />
by the decreasing county’s inhabitants’ number. Thus, one statistical data should supplement other<br />
and the overview of the situation in the region should be based on interpretations of taking into account the<br />
group of various indicators.<br />
The article is based on researches of peripherality, thus, the indicators were selected in order to measure<br />
this phenomenon. Meanwhile peripherality is being understood as the deviation from the average towards<br />
negative side, in order to notice if Klaipėda might be called as peripheral region there is the need to compare<br />
the regions’ statistical data with Lithuanian average (Fig. 1).<br />
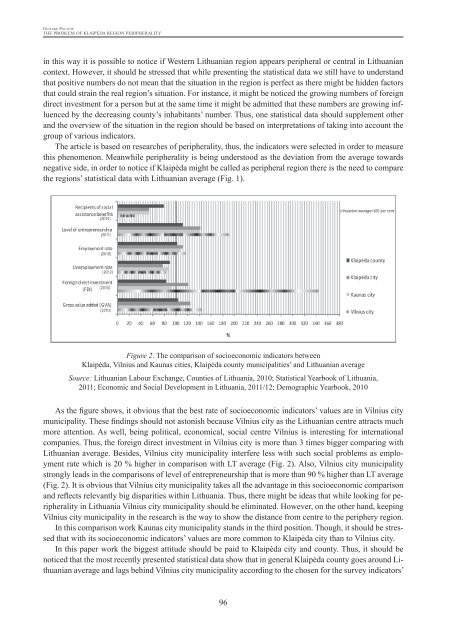
Figure 2. The comparison of socioeconomic indicators between<br />
Klaipėda, Vilnius and Kaunas cities, Klaipėda county municipalities’ and Lithuanian average<br />
Source: Lithuanian Labour Exchange, Counties of Lithuania, 2010; Statistical Yearbook of Lithuania,<br />
2011; Economic and Social Development in Lithuania, 2011/12; Demographic Yearbook, 2010<br />
As the figure shows, it obvious that the best rate of socioeconomic indicators’ values are in Vilnius city<br />
municipality. These findings should not astonish because Vilnius city as the Lithuanian centre attracts much<br />
more attention. As well, being political, economical, social centre Vilnius is interesting for international<br />
companies. Thus, the foreign direct investment in Vilnius city is more than 3 times bigger comparing with<br />
Lithuanian average. Besides, Vilnius city municipality interfere less with such social problems as employment<br />
rate which is 20 % higher in comparison with LT average (Fig. 2). Also, Vilnius city municipality<br />
strongly leads in the comparisons of level of entrepreneurship that is more than 90 % higher than LT average<br />
(Fig. 2). It is obvious that Vilnius city municipality takes all the advantage in this socioeconomic comparison<br />
and reflects relevantly big disparities within Lithuania. Thus, there might be ideas that while looking for peripherality<br />
in Lithuania Vilnius city municipality should be eliminated. However, on the other hand, keeping<br />
Vilnius city municipality in the research is the way to show the distance from centre to the periphery region.<br />
In this comparison work Kaunas city municipality stands in the third position. Though, it should be stressed<br />
that with its socioeconomic indicators’ values are more common to Klaipėda city than to Vilnius city.<br />
In this paper work the biggest attitude should be paid to Klaipėda city and county. Thus, it should be<br />
noticed that the most recently presented statistical data show that in general Klaipėda county goes around Lithuanian<br />
average and lags behind Vilnius city municipality according to the chosen for the survey indicators’<br />
96