i2 Analyst's Notebook 8 Product Overview White Paper - ISS Africa ...
i2 Analyst's Notebook 8 Product Overview White Paper - ISS Africa ...
i2 Analyst's Notebook 8 Product Overview White Paper - ISS Africa ...

You also want an ePaper? Increase the reach of your titles
YUMPU automatically turns print PDFs into web optimized ePapers that Google loves.
<strong>i2</strong> Analyst’s <strong>Notebook</strong> 8 <strong>Product</strong> <strong>Overview</strong><br />
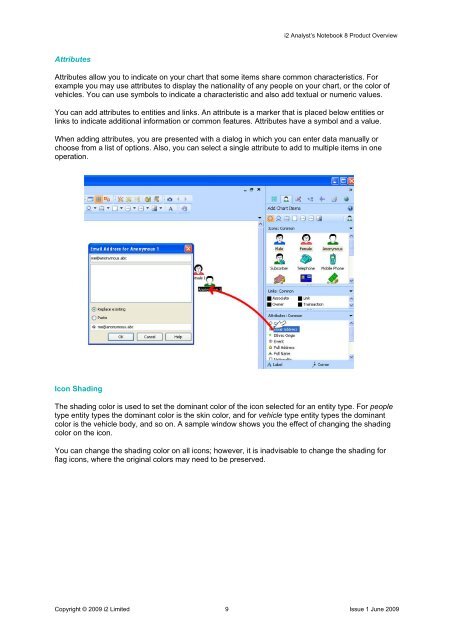
Attributes<br />
Attributes allow you to indicate on your chart that some items share common characteristics. For<br />
example you may use attributes to display the nationality of any people on your chart, or the color of<br />
vehicles. You can use symbols to indicate a characteristic and also add textual or numeric values.<br />
You can add attributes to entities and links. An attribute is a marker that is placed below entities or<br />
links to indicate additional information or common features. Attributes have a symbol and a value.<br />
When adding attributes, you are presented with a dialog in which you can enter data manually or<br />
choose from a list of options. Also, you can select a single attribute to add to multiple items in one<br />
operation.<br />
Icon Shading<br />
The shading color is used to set the dominant color of the icon selected for an entity type. For people<br />
type entity types the dominant color is the skin color, and for vehicle type entity types the dominant<br />
color is the vehicle body, and so on. A sample window shows you the effect of changing the shading<br />
color on the icon.<br />
You can change the shading color on all icons; however, it is inadvisable to change the shading for<br />
flag icons, where the original colors may need to be preserved.<br />
Copyright © 2009 <strong>i2</strong> Limited 9 Issue 1 June 2009