Overview - Parramatta City Council - NSW Government
Overview - Parramatta City Council - NSW Government
Overview - Parramatta City Council - NSW Government

You also want an ePaper? Increase the reach of your titles
YUMPU automatically turns print PDFs into web optimized ePapers that Google loves.
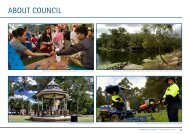
Working towards a triple bottom line<br />
For the first time, we are reporting our organisational health under a ‘triple bottom line’ framework. Together with our Corporate Wellbeing<br />
Measures, they reflect how healthy <strong>Parramatta</strong> <strong>City</strong> <strong>Council</strong> is and the impact it is having on the rest of <strong>Parramatta</strong>. <strong>Council</strong>’s organisational<br />
‘health check’ report card encapsulates the year’s performance across our Corporate, Economic, Environmental and Social ‘bottom lines’.<br />
What do we mean by Corporate wellbeing?<br />
These Measures indicate the corporate performance of our internal<br />
operations and how effective we are in managing the organisation.<br />
PERCENTAGE OF THE<br />
PREVIOUS FINANCIAL<br />
YEAR’S PROJECTS BUDGET<br />
REVOTED TO THE NEXT<br />
FINANCIAL YEAR.<br />
Positive downward trend<br />
reflects increasing<br />
organisational capacity to<br />
complete projects and a<br />
reduction in revoted funds<br />
that could otherwise have<br />
been used elsewhere in the<br />
organisation.<br />
25<br />
20<br />
15<br />
10<br />
5<br />
(%)<br />
23.14%<br />
19.75%<br />
13.82%<br />
18.43%<br />
12.96%<br />
01/02 02/03 03/04 04/05 05/06<br />
What do we mean by Economic wellbeing?<br />
These Measures indicate the economic performance of the<br />
organisation and how we manage our finances.<br />
RATIO OF CURRENT<br />
ASSETS TO CURRENT<br />
LIABILITIES, INDICATING<br />
OUR ABILITY TO MEET<br />
FINANCIAL OBLIGATIONS.<br />
For every $1 of current<br />
liabilities for 2005/06, we<br />
had $2.92 to meet<br />
obligations such as<br />
payment for goods and<br />
services.<br />
6<br />
5<br />
4<br />
3<br />
2<br />
1<br />
(ratio)<br />
3.31:1<br />
5.51:1<br />
actual<br />
4.43:1<br />
2.94:1<br />
required<br />
2.92:1<br />
01/02 02/03 03/04 04/05 05/06<br />
STATUTORY OPERATING<br />
RESULT AGAINST<br />
ORIGINAL BUDGET.<br />
Compares the amount<br />
provided in the original<br />
budget, not including<br />
revisions during the year,<br />
with the actual final net<br />
result for ordinary services<br />
plus capital revenue and<br />
expenditure.<br />
10<br />
8<br />
6<br />
4<br />
2<br />
(millions)<br />
-2<br />
1,312,000<br />
9,056,000<br />
-292,000<br />
7,867,000<br />
budget<br />
760,000<br />
6,732,000<br />
3,372,000<br />
6,932,000<br />
actual<br />
3,285,000<br />
4,787,000<br />
01/02 02/03 03/04 04/05 05/06<br />
<strong>Parramatta</strong> <strong>City</strong> <strong>Council</strong> Organisational Health Check<br />
PERCENTAGE OF PROJECT<br />
MILESTONES MET OR<br />
WHOSE VARIANCES<br />
COULD BE EXPLAINED IN<br />
THE QUARTERLY REVIEW.<br />
A pleasing improvement in<br />
projects either completed<br />
on time or held up by<br />
factors beyond <strong>Council</strong>’s<br />
control, above target<br />
of 80%.<br />
100<br />
80<br />
60<br />
40<br />
20<br />
(%)<br />
79%<br />
82%<br />
04/05 05/06<br />
PERCENTAGE OF<br />
REQUIRED AND ACTUAL<br />
MAINTENANCE COSTS<br />
AGAINST THE ‘AT COST’<br />
VALUE OF OUR ASSETS.<br />
The percentage of how<br />
much we spent on<br />
maintaining assets and<br />
how much needs to be<br />
spent to maintain the<br />
assets in a satisfactory<br />
condition, as a portion of<br />
their ‘at cost’ value.<br />
2.5<br />
2.0<br />
1.5<br />
1.0<br />
0.5<br />
(%)<br />
1.25%<br />
1.09%<br />
0.93%<br />
0.68%<br />
actual<br />
0.86%<br />
0.66%<br />
0.85%<br />
2.06%<br />
required<br />
1.49%<br />
2.16%<br />
01/02 02/03 03/04 04/05 05/06<br />
27<br />
<strong>Parramatta</strong> <strong>City</strong> <strong>Council</strong> 2005/06 Annual Report