macquarie global infrastructure total return fund annual report 2012
macquarie global infrastructure total return fund annual report 2012
macquarie global infrastructure total return fund annual report 2012

Create successful ePaper yourself
Turn your PDF publications into a flip-book with our unique Google optimized e-Paper software.
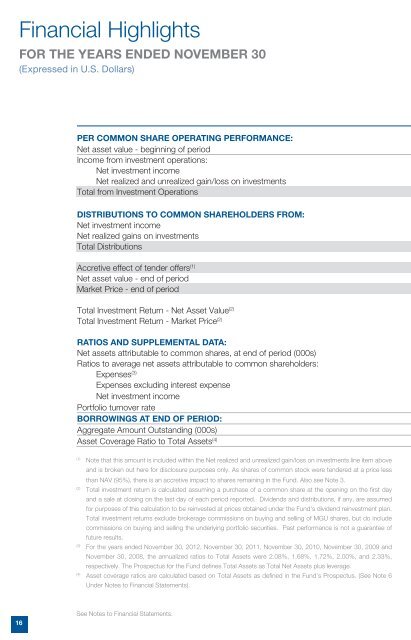
Financial Highlights<br />
FOR the Years ENDED November 30<br />
(Expressed in U.S. Dollars)<br />
PER COMMON SHARE OPERATING PERFORMANCE:<br />
Net asset value - beginning of period<br />
Income from investment operations:<br />
Net investment income<br />
Net realized and unrealized gain/loss on investments<br />
Total from Investment Operations<br />
DISTRIBUTIONS TO COMMON SHAREHOLDERS FROM:<br />
Net investment income<br />
Net realized gains on investments<br />
Total Distributions<br />
Accretive effect of tender offers (1)<br />
Net asset value - end of period<br />
Market Price - end of period<br />
Total Investment Return - Net Asset Value (2)<br />
Total Investment Return - Market Price (2)<br />
RATIOS AND SUPPLEMENTAL DATA:<br />
Net assets attributable to common shares, at end of period (000s)<br />
Ratios to average net assets attributable to common shareholders:<br />
Expenses (3)<br />
Expenses excluding interest expense<br />
Net investment income<br />
Portfolio turnover rate<br />
BORROWINGS AT END OF PERIOD:<br />
Aggregate Amount Outstanding (000s)<br />
Asset Coverage Ratio to Total Assets (4)<br />
(1)<br />
Note that this amount is included within the Net realized and unrealized gain/loss on investments line item above<br />
and is broken out here for disclosure purposes only. As shares of common stock were tendered at a price less<br />
than NAV (95%), there is an accretive impact to shares remaining in the Fund. Also see Note 3.<br />
(2)<br />
Total investment <strong>return</strong> is calculated assuming a purchase of a common share at the opening on the first day<br />
and a sale at closing on the last day of each period <strong>report</strong>ed. Dividends and distributions, if any, are assumed<br />
for purposes of this calculation to be reinvested at prices obtained under the Fund's dividend reinvestment plan.<br />
Total investment <strong>return</strong>s exclude brokerage commissions on buying and selling of MGU shares, but do include<br />
commissions on buying and selling the underlying portfolio securities. Past performance is not a guarantee of<br />
future results.<br />
(3)<br />
For the years ended November 30, <strong>2012</strong>, November 30, 2011, November 30, 2010, November 30, 2009 and<br />
November 30, 2008, the <strong>annual</strong>ized ratios to Total Assets were 2.08%, 1.68%, 1.72%, 2.00%, and 2.33%,<br />
respectively. The Prospectus for the Fund defines Total Assets as Total Net Assets plus leverage.<br />
(4)<br />
Asset coverage ratios are calculated based on Total Assets as defined in the Fund's Prospectus. (See Note 6<br />
Under Notes to Financial Statements).<br />
16<br />
See Notes to Financial Statements.