macquarie global infrastructure total return fund annual report 2012
macquarie global infrastructure total return fund annual report 2012
macquarie global infrastructure total return fund annual report 2012

Create successful ePaper yourself
Turn your PDF publications into a flip-book with our unique Google optimized e-Paper software.
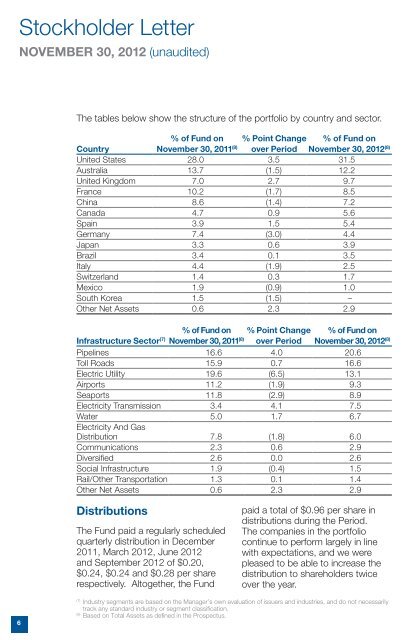
Stockholder Letter<br />
November 30, <strong>2012</strong> (unaudited)<br />
The tables below show the structure of the portfolio by country and sector.<br />
% of Fund on % Point Change % of Fund on<br />
Country<br />
November 30, 2011 (8) over Period November 30, <strong>2012</strong> (8)<br />
United States 28.0 3.5 31.5<br />
Australia 13.7 (1.5) 12.2<br />
United Kingdom 7.0 2.7 9.7<br />
France 10.2 (1.7) 8.5<br />
China 8.6 (1.4) 7.2<br />
Canada 4.7 0.9 5.6<br />
Spain 3.9 1.5 5.4<br />
Germany 7.4 (3.0) 4.4<br />
Japan 3.3 0.6 3.9<br />
Brazil 3.4 0.1 3.5<br />
Italy 4.4 (1.9) 2.5<br />
Switzerland 1.4 0.3 1.7<br />
Mexico 1.9 (0.9) 1.0<br />
South Korea 1.5 (1.5) –<br />
Other Net Assets 0.6 2.3 2.9<br />
% of Fund on % Point Change % of Fund on<br />
Infrastructure Sector (7) November 30, 2011 (8) over Period November 30, <strong>2012</strong> (8)<br />
Pipelines 16.6 4.0 20.6<br />
Toll Roads 15.9 0.7 16.6<br />
Electric Utility 19.6 (6.5) 13.1<br />
Airports 11.2 (1.9) 9.3<br />
Seaports 11.8 (2.9) 8.9<br />
Electricity Transmission 3.4 4.1 7.5<br />
Water 5.0 1.7 6.7<br />
Electricity And Gas<br />
Distribution 7.8 (1.8) 6.0<br />
Communications 2.3 0.6 2.9<br />
Diversified 2.6 0.0 2.6<br />
Social Infrastructure 1.9 (0.4) 1.5<br />
Rail/Other Transportation 1.3 0.1 1.4<br />
Other Net Assets 0.6 2.3 2.9<br />
Distributions<br />
The Fund paid a regularly scheduled<br />
quarterly distribution in December<br />
2011, March <strong>2012</strong>, June <strong>2012</strong><br />
and September <strong>2012</strong> of $0.20,<br />
$0.24, $0.24 and $0.28 per share<br />
respectively. Altogether, the Fund<br />
paid a <strong>total</strong> of $0.96 per share in<br />
distributions during the Period.<br />
The companies in the portfolio<br />
continue to perform largely in line<br />
with expectations, and we were<br />
pleased to be able to increase the<br />
distribution to shareholders twice<br />
over the year.<br />
6<br />
(7)<br />
Industry segments are based on the Manager’s own evaluation of issuers and industries, and do not necessarily<br />
track any standard industry or segment classification.<br />
(8)<br />
Based on Total Assets as defined in the Prospectus.