macquarie global infrastructure total return fund annual report 2012
macquarie global infrastructure total return fund annual report 2012
macquarie global infrastructure total return fund annual report 2012

You also want an ePaper? Increase the reach of your titles
YUMPU automatically turns print PDFs into web optimized ePapers that Google loves.
around 21% of the Fund at the<br />
end of the period. The negative<br />
contribution was largely offset by<br />
the depreciation of the U.S Dollar<br />
by 2% each against the British<br />
Pound and the Canadian Dollar. (6)<br />
Investments in these two currencies<br />
comprised around 15% of the<br />
<strong>global</strong>ly diversified portfolio’s security<br />
positions at the end of the Period.<br />
Leverage<br />
Leverage made a positive<br />
contribution to the Fund’s <strong>return</strong>.<br />
As of November 30, <strong>2012</strong>, the<br />
Fund had USD 83 million and EUR<br />
20 million in leverage outstanding<br />
and USD 17 million of available<br />
commitments. The Fund's leverage<br />
was 26.9%, which is well within<br />
the limit outlined in the Fund's<br />
Prospectus. To avoid magnifying<br />
the USD exposure due to leverage,<br />
the Fund also borrows in Euro<br />
to partially match the currency<br />
exposure of the investments with<br />
the currency of the borrowings.<br />
As always, we balance the cost of<br />
leverage against the longer term<br />
potential for enhanced yield and<br />
capital <strong>return</strong>s.<br />
Performance Relative to<br />
reference benchmarks<br />
The Fund, which is not managed<br />
against any benchmark,<br />
outperformed two reference<br />
benchmarks, the S&P Global<br />
Infrastructure Index (Net Total<br />
Return) and the Macquarie Global<br />
Infrastructure Index (“MGII”).<br />
The main contributors were<br />
positions in Electric Utilities, Airports<br />
and Pipelines. The only detractors<br />
were positions in Seaports and<br />
Electricity Generation.<br />
Fund Diversification by Country & Sector<br />
At the end of the Period, the Fund held positions in 49 <strong>global</strong> <strong>infrastructure</strong><br />
stocks representing 13 countries and 12 <strong>infrastructure</strong> sectors.<br />
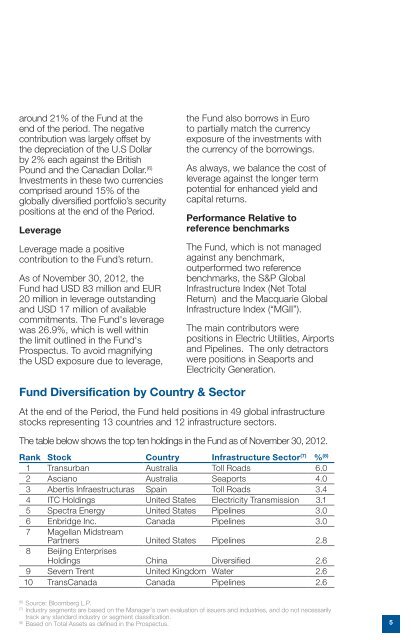
The table below shows the top ten holdings in the Fund as of November 30, <strong>2012</strong>.<br />
Rank Stock Country Infrastructure Sector (7) % (8)<br />
1 Transurban Australia Toll Roads 6.0<br />
2 Asciano Australia Seaports 4.0<br />
3 Abertis Infraestructuras Spain Toll Roads 3.4<br />
4 ITC Holdings United States Electricity Transmission 3.1<br />
5 Spectra Energy United States Pipelines 3.0<br />
6 Enbridge Inc. Canada Pipelines 3.0<br />
7 Magellan Midstream<br />
Partners United States Pipelines 2.8<br />
8 Beijing Enterprises<br />
Holdings China Diversified 2.6<br />
9 Severn Trent United Kingdom Water 2.6<br />
10 TransCanada Canada Pipelines 2.6<br />
(6)<br />
Source: Bloomberg L.P.<br />
(7)<br />
Industry segments are based on the Manager’s own evaluation of issuers and industries, and do not necessarily<br />
track any standard industry or segment classification.<br />
(8)<br />
Based on Total Assets as defined in the Prospectus.<br />
5