2005 Annual Report - Investor Relations - Sherwin-Williams
2005 Annual Report - Investor Relations - Sherwin-Williams
2005 Annual Report - Investor Relations - Sherwin-Williams

Create successful ePaper yourself
Turn your PDF publications into a flip-book with our unique Google optimized e-Paper software.
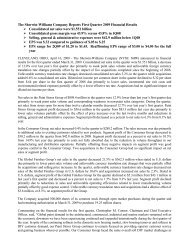
NOTES TO CONSOLIDATED FINANCIAL STATEMENTS<br />
(thousands of dollars unless otherwise indicated)<br />
Significant components of the provisions for income<br />
taxes were as follows:<br />
<strong>2005</strong> 2004 2003<br />
Current:<br />
Federal.................. $ 171,676 $ 126,199 $ 129,146<br />
Foreign ................ 17,321 17,994 5,719<br />
State and local ...... 19,860 24,242 16,131<br />
Total current .... 208,857 168,435 150,996<br />
Deferred:<br />
Federal.................. (4,813) 18,001 32,299<br />
Foreign ................ (7,455) (3,312) 3,554<br />
State and local ...... (4,988) 2,538 4,019<br />
Total deferred.... (17,256) 17,227 39,872<br />
Total provisions<br />
for income taxes .. $ 191,601 $ 185,662 $ 190,868<br />
The provisions for income taxes included estimated<br />
taxes payable on that portion of retained earnings of<br />
foreign subsidiaries expected to be received by the Company.<br />
The effect of the repatriation provisions of the<br />
American Jobs Creation Act of 2004 and the provisions<br />
of APBO No. 23, “Accounting for Income Taxes –<br />
Special Areas,” was $1,234 in <strong>2005</strong> and $2,693 in<br />
2004. A provision was not made with respect to<br />
$13,771 of retained earnings at December 31, <strong>2005</strong> that<br />
have been invested by foreign subsidiaries. It was not<br />
practicable to estimate the amount of unrecognized<br />
deferred tax liability for undistributed foreign earnings.<br />
Significant components of income before income<br />
taxes and minority interest as used for income tax<br />
purposes, were as follows:<br />
<strong>2005</strong> 2004 2003<br />
Domestic ................ $ 583,993 $ 520,454 $ 492,592<br />
Foreign .................... 72,222 59,741 30,334<br />
$ 656,215 $ 580,195 $ 522,926<br />
A reconciliation of the statutory federal income tax<br />
rate to the effective tax rate follows:<br />
<strong>2005</strong> 2004 2003<br />
Statutory federal<br />
income tax rate .................. 35.0% 35.0% 35.0%<br />
Effect of:<br />
State and local<br />
income taxes .............. 1.5 3.0 2.5<br />
Investment vehicles ........ (1.6) (1.6) (0.6)<br />
ESOP dividends .............. (5.2) (4.2) (1.0)<br />
Other - net...................... (0.5) (0.2) 0.6<br />
Effective tax rate.................... 29.2% 32.0% 36.5%<br />
The increase in the ESOP dividends deduction was<br />
the result of increases to the annual dividend payable<br />
for <strong>2005</strong> and 2004 versus 2003 and changes in plan<br />
design which resulted in an increase in deductible dividends.<br />
The decrease in the state and local income tax<br />
component of the effective tax rate in <strong>2005</strong> versus 2004<br />
was due to the favorable impact of state and local tax<br />
settlements.<br />
NOTE 14 – NET INCOME PER COMMON SHARE<br />
<strong>2005</strong> 2004 2003<br />
Basic<br />
Average common shares outstanding ...................................................... 136,816,868 140,801,836 144,846,933<br />
Net income............................................................................................... $ 463,258 $ 393,254 $ 332,058<br />
Net income per common share................................................................. $ 3.39 $ 2.79 $ 2.29<br />
Diluted<br />
Average common shares outstanding ...................................................... 136,816,868 140,801,836 144,846,933<br />
Non-vested restricted stock grants ........................................................... 950,182 870,313 614,458<br />
Stock options and other contingently issuable shares .............................. 3,311,882 3,063,440 1,543,885<br />
Average common shares assuming dilution .............................................. 141,078,932 144,735,589 147,005,276<br />
Net income............................................................................................... $ 463,258 $ 393,254 $ 332,058<br />
Net income per common share................................................................. $ 3.28 $ 2.72 $ 2.26<br />
67