2005 Annual Report - Investor Relations - Sherwin-Williams
2005 Annual Report - Investor Relations - Sherwin-Williams
2005 Annual Report - Investor Relations - Sherwin-Williams

You also want an ePaper? Increase the reach of your titles
YUMPU automatically turns print PDFs into web optimized ePapers that Google loves.
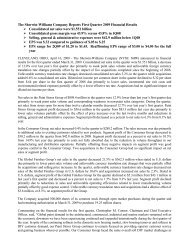
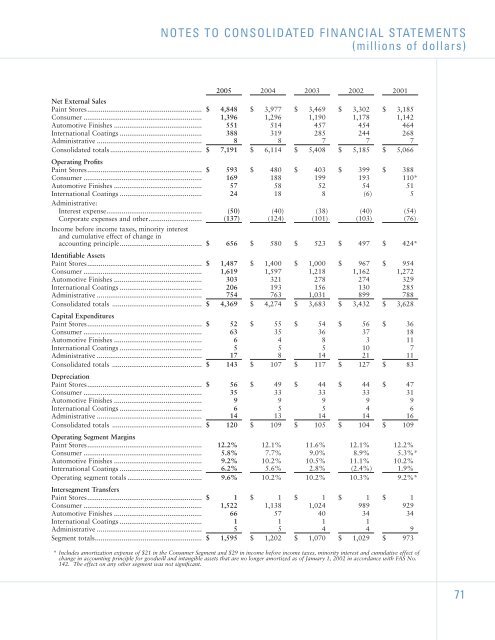
NOTES TO CONSOLIDATED FINANCIAL STATEMENTS<br />
(millions of dollars)<br />
<strong>2005</strong> 2004 2003 2002 2001<br />
Net External Sales<br />
Paint Stores............................................................ $ 4,848 $ 3,977 $ 3,469 $ 3,302 $ 3,185<br />
Consumer .............................................................. 1,396 1,296 1,190 1,178 1,142<br />
Automotive Finishes .............................................. 551 514 457 454 464<br />
International Coatings ........................................... 388 319 285 244 268<br />
Administrative ....................................................... 8 8 7 7 7<br />
Consolidated totals ................................................ $ 7,191 $ 6,114 $ 5,408 $ 5,185 $ 5,066<br />
Operating Profits<br />
Paint Stores............................................................ $ 593 $ 480 $ 403 $ 399 $ 388<br />
Consumer .............................................................. 169 188 199 193 110*<br />
Automotive Finishes .............................................. 57 58 52 54 51<br />
International Coatings ........................................... 24 18 8 (6) 5<br />
Administrative:<br />
Interest expense.................................................. (50) (40) (38) (40) (54)<br />
Corporate expenses and other............................ (137) (124) (101) (103) (76)<br />
Income before income taxes, minority interest<br />
and cumulative effect of change in<br />
accounting principle........................................... $ 656 $ 580 $ 523 $ 497 $ 424*<br />
Identifiable Assets<br />
Paint Stores............................................................ $ 1,487 $ 1,400 $ 1,000 $ 967 $ 954<br />
Consumer .............................................................. 1,619 1,597 1,218 1,162 1,272<br />
Automotive Finishes .............................................. 303 321 278 274 329<br />
International Coatings ........................................... 206 193 156 130 285<br />
Administrative ....................................................... 754 763 1,031 899 788<br />
Consolidated totals ............................................... $ 4,369 $ 4,274 $ 3,683 $ 3,432 $ 3,628<br />
Capital Expenditures<br />
Paint Stores............................................................ $ 52 $ 55 $ 54 $ 56 $ 36<br />
Consumer .............................................................. 63 35 36 37 18<br />
Automotive Finishes .............................................. 6 4 8 3 11<br />
International Coatings ........................................... 5 5 5 10 7<br />
Administrative ....................................................... 17 8 14 21 11<br />
Consolidated totals ............................................... $ 143 $ 107 $ 117 $ 127 $ 83<br />
Depreciation<br />
Paint Stores............................................................ $ 56 $ 49 $ 44 $ 44 $ 47<br />
Consumer .............................................................. 35 33 33 33 31<br />
Automotive Finishes .............................................. 9 9 9 9 9<br />
International Coatings ........................................... 6 5 5 4 6<br />
Administrative ....................................................... 14 13 14 14 16<br />
Consolidated totals ............................................... $ 120 $ 109 $ 105 $ 104 $ 109<br />
Operating Segment Margins<br />
Paint Stores............................................................ 12.2% 12.1% 11.6% 12.1% 12.2%<br />
Consumer .............................................................. 5.8% 7.7% 9.0% 8.9% 5.3%*<br />
Automotive Finishes .............................................. 9.2% 10.2% 10.5% 11.1% 10.2%<br />
International Coatings ........................................... 6.2% 5.6% 2.8% (2.4%) 1.9%<br />
Operating segment totals ....................................... 9.6% 10.2% 10.2% 10.3% 9.2%*<br />
Intersegment Transfers<br />
Paint Stores............................................................ $ 1 $ 1 $ 1 $ 1 $ 1<br />
Consumer .............................................................. 1,522 1,138 1,024 989 929<br />
Automotive Finishes .............................................. 66 57 40 34 34<br />
International Coatings ........................................... 1 1 1 1<br />
Administrative ....................................................... 5 5 4 4 9<br />
Segment totals........................................................ $ 1,595 $ 1,202 $ 1,070 $ 1,029 $ 973<br />
* Includes amortization expense of $21 in the Consumer Segment and $29 in income before income taxes, minority interest and cumulative effect of<br />
change in accounting principle for goodwill and intangible assets that are no longer amortized as of January 1, 2002 in accordance with FAS No.<br />
142. The effect on any other segment was not significant.<br />
71