Eco Today - Mar10:ET Master Page 2007 - ASKnLearn
Eco Today - Mar10:ET Master Page 2007 - ASKnLearn
Eco Today - Mar10:ET Master Page 2007 - ASKnLearn

Create successful ePaper yourself
Turn your PDF publications into a flip-book with our unique Google optimized e-Paper software.
The importance of<br />
productivity growth<br />
P<br />
roductivity growth is arguably<br />
the most important indicator of<br />
living standards in the economy.<br />
Nobel prize-winning economist Paul<br />
Krugman has stated that “Productivity<br />
isn’t everything, but in the long run it is<br />
almost everything.” 1 If the productivity<br />
of resources is increased then an<br />
economy can generate more income or<br />
output per worker, increasing the<br />
standard of living and helping to<br />
eradicate poverty. Higher productivity<br />
growth will increase the economy’s trend<br />
rate of growth. However, because of<br />
the difficulties of calculating the produc -<br />
tivity of certain types of capital, such<br />
as human capital, productivity tends not<br />
to be used as a measure of the standard<br />
of living, so real GDP per capita tends to<br />
be used instead. Nonetheless, there is<br />
no denying the importance of produc -<br />
tivity growth in determining living<br />
standards.<br />
But productivity growth is important<br />
for other reasons. Productivity growth<br />
keeps inflation low. If workers in the<br />
workplace operate more efficiently, then<br />
businesses are able to produce more<br />
goods and services at a lower average<br />
cost, or higher average product (produc-<br />
tivity). If businesses are able to pass<br />
these lower costs on to the consumer<br />
and lower prices, then this will reduce<br />
cost-push inflationary pressure in the<br />
economy. Furthermore, produc tivity<br />
growth drives down unit labour costs,<br />
which will improve the inter national com -<br />
petitiveness of UK goods and services<br />
on world markets.<br />
Measuring productivity<br />
Productivity measures the output<br />
produced by the economy relative to a<br />
given input, or set of inputs. The most<br />
widely-used measure of productivity is<br />
labour productivity, or output per<br />
worker. However, given the fact that over<br />
time there are changes in the structure<br />
of employment, for example between full<br />
and part-time work, or in the number of<br />
hours worked for some other reason,<br />
such as working on Sundays or number<br />
of holidays, then output per hour worked<br />
is actually the more useful measure.<br />
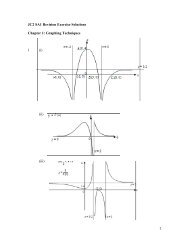
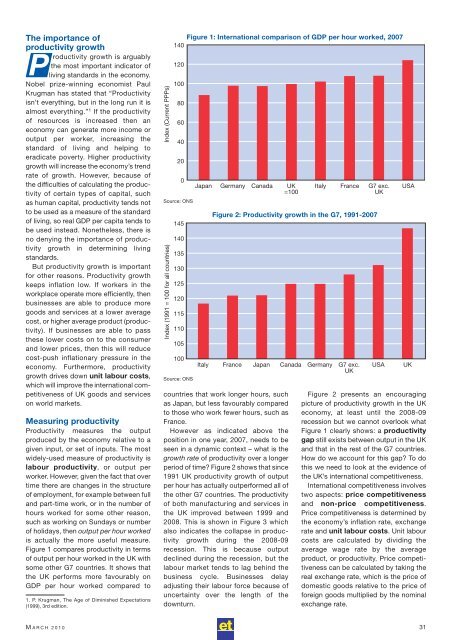
Figure 1 compares productivity in terms<br />
of output per hour worked in the UK with<br />
some other G7 countries. It shows that<br />
the UK performs more favourably on<br />
GDP per hour worked compared to<br />
1. P. Krugman, The Age of Diminished Expectations<br />
(1999), 3rd edition.<br />
Index (Current PPPs)<br />
Figure 1: International comparison of GDP per hour worked, <strong>2007</strong><br />
140<br />
120<br />
100<br />
80<br />
60<br />
40<br />
20<br />
0<br />
Source: ONS<br />
Index (1991 = 100 for all countries)<br />
145<br />
140<br />
135<br />
130<br />
125<br />
120<br />
115<br />
110<br />
105<br />
100<br />
Source: ONS<br />
Japan Germany Canada UK Italy France G7 exc.<br />
=100<br />
UK<br />
Italy<br />
Figure 2: Productivity growth in the G7, 1991-<strong>2007</strong><br />
France<br />
Japan<br />
countries that work longer hours, such<br />
as Japan, but less favourably compared<br />
to those who work fewer hours, such as<br />
France.<br />
However as indicated above the<br />
position in one year, <strong>2007</strong>, needs to be<br />
seen in a dynamic context – what is the<br />
growth rate of productivity over a longer<br />
period of time? Figure 2 shows that since<br />
1991 UK productivity growth of output<br />
per hour has actually outperformed all of<br />
the other G7 countries. The productivity<br />
of both manufacturing and services in<br />
the UK improved between 1999 and<br />
2008. This is shown in Figure 3 which<br />
also indicates the collapse in produc -<br />
tivity growth during the 2008-09<br />
recession. This is because output<br />
declined during the recession, but the<br />
labour market tends to lag behind the<br />
business cycle. Businesses delay<br />
adjusting their labour force because of<br />
uncertainty over the length of the<br />
downturn.<br />
Canada<br />
Germany<br />
G7 exc.<br />
UK<br />
USA<br />
USA<br />
UK<br />
Figure 2 presents an encouraging<br />
picture of productivity growth in the UK<br />
economy, at least until the 2008-09<br />
recession but we cannot overlook what<br />
Figure 1 clearly shows: a productivity<br />
gap still exists between output in the UK<br />
and that in the rest of the G7 countries.<br />
How do we account for this gap? To do<br />
this we need to look at the evidence of<br />
the UK’s international competitiveness.<br />
International competitiveness involves<br />
two aspects: price competitiveness<br />
and non-price competitiveness.<br />
Price competitiveness is determined by<br />
the economy’s inflation rate, exchange<br />
rate and unit labour costs. Unit labour<br />
costs are calculated by dividing the<br />
average wage rate by the average<br />
product, or productivity. Price competi -<br />
tive ness can be calculated by taking the<br />
real exchange rate, which is the price of<br />
domestic goods relative to the price of<br />
foreign goods multiplied by the nominal<br />
exchange rate.<br />
M ARCH 2010 31