optical interference filters - SPOT Imaging Solutions
optical interference filters - SPOT Imaging Solutions
optical interference filters - SPOT Imaging Solutions

Create successful ePaper yourself
Turn your PDF publications into a flip-book with our unique Google optimized e-Paper software.
application note FISH and M-FISH <strong>Imaging</strong><br />
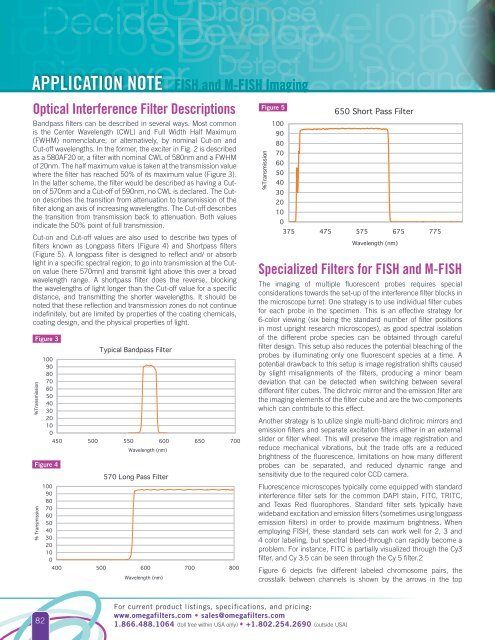
Optical Interference Filter Descriptions<br />
Bandpass <strong>filters</strong> can be described in several ways. Most common<br />
is the Center Wavelength (CWL) and Full Width Half Maximum<br />
(FWHM) nomenclature, or alternatively, by nominal Cut-on and<br />
Cut-off wavelengths. In the former, the exciter in Fig. 2 is described<br />
as a 580AF20 or, a filter with nominal CWL of 580nm and a FWHM<br />
of 20nm. The half maximum value is taken at the transmission value<br />
where the filter has reached 50% of its maximum value (Figure 3).<br />
In the latter scheme, the filter would be described as having a Cuton<br />
of 570nm and a Cut-off of 590nm, no CWL is declared. The Cuton<br />
describes the transition from attenuation to transmission of the<br />
filter along an axis of increasing wavelengths. The Cut-off describes<br />
the transition from transmission back to attenuation. Both values<br />
indicate the 50% point of full transmission.<br />
Cut-on and Cut-off values are also used to describe two types of<br />
<strong>filters</strong> known as Longpass <strong>filters</strong> (Figure 4) and Shortpass <strong>filters</strong><br />
(Figure 5). A longpass filter is designed to reflect and/ or absorb<br />
light in a specific spectral region, to go into transmission at the Cuton<br />
value (here 570mn) and transmit light above this over a broad<br />
wavelength range. A shortpass filter does the reverse, blocking<br />
the wavelengths of light longer than the Cut-off value for a specific<br />
distance, and transmitting the shorter wavelengths. It should be<br />
noted that these reflection and transmission zones do not continue<br />
indefinitely, but are limited by properties of the coating chemicals,<br />
coating design, and the physical properties of light.<br />
Figure 3<br />
%Transmission<br />
100<br />
90<br />
80<br />
70<br />
60<br />
50<br />
40<br />
30<br />
20<br />
10<br />
0<br />
Figure 4<br />
% Transmission<br />
100<br />
90<br />
80<br />
70<br />
60<br />
50<br />
40<br />
30<br />
20<br />
10<br />
0<br />
Typical Bandpass Filter<br />
450 500 550 600 650 700<br />
Wavelength (nm)<br />
570 Long Pass Filter<br />
400 500 600 700 800<br />
Wavelength (nm)<br />
Figure 5<br />
%Transmission<br />
100<br />
90<br />
80<br />
70<br />
60<br />
50<br />
40<br />
30<br />
20<br />
10<br />
0<br />
650 Short Pass Filter<br />
375 475 575 675 775<br />
Wavelength (nm)<br />
Specialized Filters for FISH and M-FISH<br />
The imaging of multiple fluorescent probes requires special<br />
considerations towards the set-up of the <strong>interference</strong> filter blocks in<br />
the microscope turret. One strategy is to use individual filter cubes<br />
for each probe in the specimen. This is an effective strategy for<br />
6-color viewing (six being the standard number of filter positions<br />
in most upright research microscopes), as good spectral isolation<br />
of the different probe species can be obtained through careful<br />
filter design. This setup also reduces the potential bleaching of the<br />
probes by illuminating only one fluorescent species at a time. A<br />
potential drawback to this setup is image registration shifts caused<br />
by slight misalignments of the <strong>filters</strong>, producing a minor beam<br />
deviation that can be detected when switching between several<br />
different filter cubes. The dichroic mirror and the emission filter are<br />
the imaging elements of the filter cube and are the two components<br />
which can contribute to this effect.<br />
Another strategy is to utilize single multi-band dichroic mirrors and<br />
emission <strong>filters</strong> and separate excitation <strong>filters</strong> either in an external<br />
slider or filter wheel. This will preserve the image registration and<br />
reduce mechanical vibrations, but the trade offs are a reduced<br />
brightness of the fluorescence, limitations on how many different<br />
probes can be separated, and reduced dynamic range and<br />
sensitivity due to the required color CCD camera.<br />
Fluorescence microscopes typically come equipped with standard<br />
<strong>interference</strong> filter sets for the common DAPI stain, FITC, TRITC,<br />
and Texas Red fluorophores. Standard filter sets typically have<br />
wideband excitation and emission <strong>filters</strong> (sometimes using longpass<br />
emission <strong>filters</strong>) in order to provide maximum brightness. When<br />
employing FISH, these standard sets can work well for 2, 3 and<br />
4 color labeling, but spectral bleed-through can rapidly become a<br />
problem. For instance, FITC is partially visualized through the Cy3<br />
filter, and Cy 3.5 can be seen through the Cy 5 filter.2<br />
Figure 6 depicts five different labeled chromosome pairs, the<br />
crosstalk between channels is shown by the arrows in the top<br />
82<br />
For current product listings, specifications, and pricing:<br />
www.omega<strong>filters</strong>.com • sales@omega<strong>filters</strong>.com<br />
1.866.488.1064 (toll free within USA only) • +1.802.254.2690 (outside USA)