paper - Odeon
paper - Odeon
paper - Odeon

You also want an ePaper? Increase the reach of your titles
YUMPU automatically turns print PDFs into web optimized ePapers that Google loves.
T30 (s)<br />
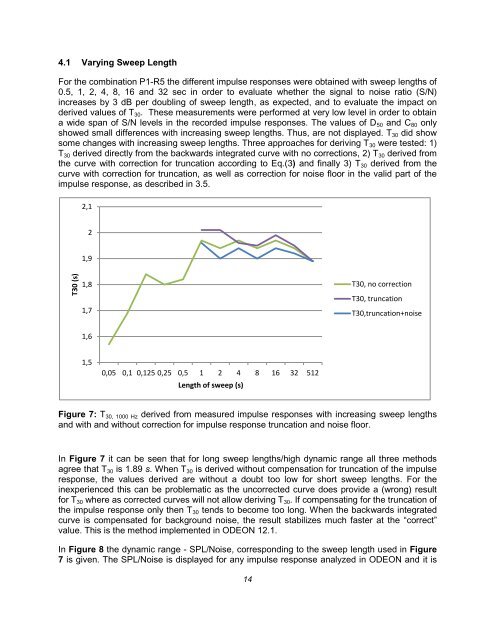
4.1 Varying Sweep Length<br />
For the combination P1-R5 the different impulse responses were obtained with sweep lengths of<br />
0.5, 1, 2, 4, 8, 16 and 32 sec in order to evaluate whether the signal to noise ratio (S/N)<br />
increases by 3 dB per doubling of sweep length, as expected, and to evaluate the impact on<br />
derived values of T 30 . These measurements were performed at very low level in order to obtain<br />
a wide span of S/N levels in the recorded impulse responses. The values of D 50 and C 80 only<br />
showed small differences with increasing sweep lengths. Thus, are not displayed. T 30 did show<br />
some changes with increasing sweep lengths. Three approaches for deriving T 30 were tested: 1)<br />
T 30 derived directly from the backwards integrated curve with no corrections, 2) T 30 derived from<br />
the curve with correction for truncation according to Eq.(3) and finally 3) T 30 derived from the<br />
curve with correction for truncation, as well as correction for noise floor in the valid part of the<br />
impulse response, as described in 3.5.<br />
2,1<br />
2<br />
1,9<br />
1,8<br />
1,7<br />
T30, no correction<br />
T30, truncation<br />
T30,truncation+noise<br />
1,6<br />
1,5<br />
0,05 0,1 0,125 0,25 0,5 1 2 4 8 16 32 512<br />
Length of sweep (s)<br />
Figure 7: T 30, 1000 Hz derived from measured impulse responses with increasing sweep lengths<br />
and with and without correction for impulse response truncation and noise floor.<br />
In Figure 7 it can be seen that for long sweep lengths/high dynamic range all three methods<br />
agree that T 30 is 1.89 s. When T 30 is derived without compensation for truncation of the impulse<br />
response, the values derived are without a doubt too low for short sweep lengths. For the<br />
inexperienced this can be problematic as the uncorrected curve does provide a (wrong) result<br />
for T 30 where as corrected curves will not allow deriving T 30 . If compensating for the truncation of<br />
the impulse response only then T 30 tends to become too long. When the backwards integrated<br />
curve is compensated for background noise, the result stabilizes much faster at the “correct”<br />
value. This is the method implemented in ODEON 12.1.<br />
In Figure 8 the dynamic range - SPL/Noise, corresponding to the sweep length used in Figure<br />
7 is given. The SPL/Noise is displayed for any impulse response analyzed in ODEON and it is<br />
14