paper - Odeon
paper - Odeon
paper - Odeon

You also want an ePaper? Increase the reach of your titles
YUMPU automatically turns print PDFs into web optimized ePapers that Google loves.
T(30) (s)<br />
EDT (s)<br />
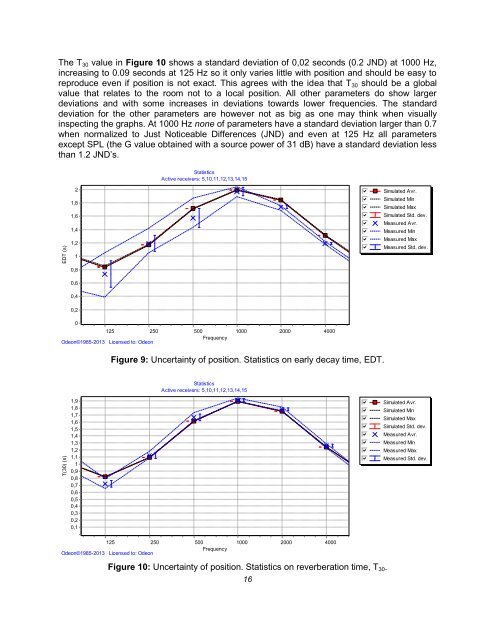
The T 30 value in Figure 10 shows a standard deviation of 0,02 seconds (0.2 JND) at 1000 Hz,<br />
increasing to 0.09 seconds at 125 Hz so it only varies little with position and should be easy to<br />
reproduce even if position is not exact. This agrees with the idea that T 30 should be a global<br />
value that relates to the room not to a local position. All other parameters do show larger<br />
deviations and with some increases in deviations towards lower frequencies. The standard<br />
deviation for the other parameters are however not as big as one may think when visually<br />
inspecting the graphs. At 1000 Hz none of parameters have a standard deviation larger than 0.7<br />
when normalized to Just Noticeable Differences (JND) and even at 125 Hz all parameters<br />
except SPL (the G value obtained with a source power of 31 dB) have a standard deviation less<br />
than 1.2 JND’s.<br />
Statistics<br />
Active receivers: 5,10,11,12,13,14,15<br />
2<br />
1,8<br />
1,6<br />
1,4<br />
1,2<br />
1<br />
gfedcb<br />
gfedcb<br />
gfedcb<br />
gfedcb<br />
gfedcb<br />
gfedcb<br />
gfedcb<br />
gfedcb<br />
Simulated Avr.<br />
Simulated Min<br />
Simulated Max<br />
Simulated Std. dev.<br />
Measured Avr.<br />
Measured Min<br />
Measured Max<br />
Measured Std. dev.<br />
0,8<br />
0,6<br />
0,4<br />
0,2<br />
0<br />
125 250 500 1000 2000 4000<br />
Frequency<br />
<strong>Odeon</strong>©1985-2013 Licensed to: <strong>Odeon</strong><br />
Figure 9: Uncertainty of position. Statistics on early decay time, EDT.<br />
Statistics<br />
Active receivers: 5,10,11,12,13,14,15<br />
1,9<br />
1,8<br />
1,7<br />
1,6<br />
1,5<br />
1,4<br />
1,3<br />
1,2<br />
1,1<br />
1<br />
0,9<br />
0,8<br />
0,7<br />
0,6<br />
0,5<br />
0,4<br />
0,3<br />
0,2<br />
0,1<br />
gfedcb<br />
gfedcb<br />
gfedcb<br />
gfedcb<br />
gfedcb<br />
gfedcb<br />
gfedcb<br />
gfedcb<br />
Simulated Avr.<br />
Simulated Min<br />
Simulated Max<br />
Simulated Std. dev.<br />
Measured Avr.<br />
Measured Min<br />
Measured Max<br />
Measured Std. dev.<br />
125 250 500 1000 2000 4000<br />
Frequency<br />
<strong>Odeon</strong>©1985-2013 Licensed to: <strong>Odeon</strong><br />
Figure 10: Uncertainty of position. Statistics on reverberation time, T 30 .<br />
16